Updated October 13, 2026. Data: U.S. Census Bureau, 2024 survey (latest available), with 2019 for comparison.
The U.S. had about 7.94 million mobile and manufactured homes in 2024, 5.4% of all 146.7 million homes. They were most common in New Mexico (15.0%), Mississippi (14.0%), West Virginia (13.2%), South Carolina (12.8%) and Louisiana (12.2%). Florida had the most by count (824,425).
Mobile homes as a share of all homes
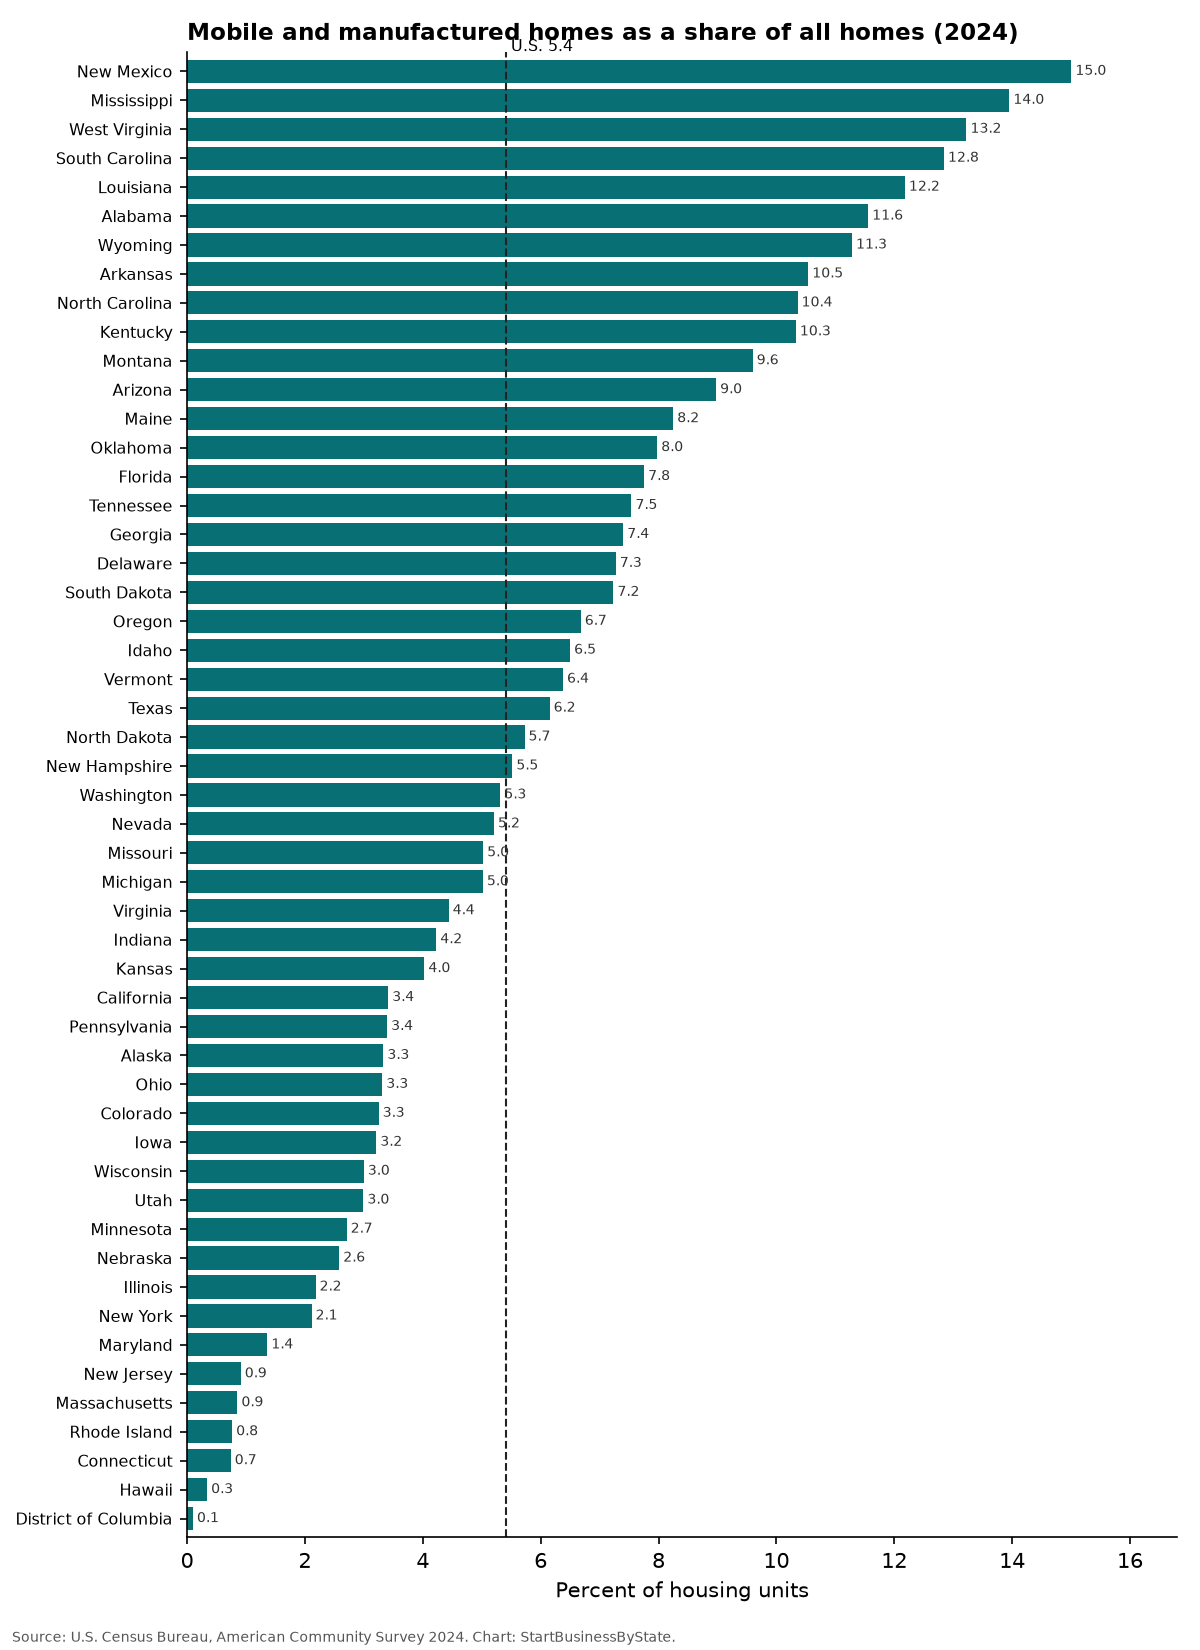
Manufactured homes are built in a factory and moved to a lot or community. They usually cost much less than site-built homes, which makes them an important lower-cost option, especially in rural areas and the South. They were least common in District of Columbia (0.1%), Hawaii (0.3%) and Connecticut (0.7%).
State-by-state table
Click a column to sort. Counts include occupied and vacant homes.
| State | Mobile homes, 2024 | Share of homes, 2024 | Share, 2019 | Mobile homes, 2019 |
|---|---|---|---|---|
| U.S. | 7,939,191 | 5.4% | 6.1% | 8,468,274 |
| Alabama | 275,265 | 11.6% | 13.2% | 300,680 |
| Alaska | 10,983 | 3.3% | 4.2% | 13,323 |
| Arizona | 296,171 | 9.0% | 10.3% | 317,116 |
| Arkansas | 149,775 | 10.5% | 11.8% | 163,623 |
| California | 507,774 | 3.4% | 3.7% | 537,931 |
| Colorado | 86,548 | 3.3% | 4.0% | 97,976 |
| Connecticut | 11,510 | 0.7% | 0.7% | 10,931 |
| Delaware | 34,659 | 7.3% | 7.5% | 33,258 |
| District of Columbia | 369 | 0.1% | 0.1% | 404 |
| Florida | 824,425 | 7.8% | 8.8% | 854,599 |
| Georgia | 345,541 | 7.4% | 9.0% | 391,950 |
| Hawaii | 1,951 | 0.3% | 0.3% | 1,658 |
| Idaho | 54,080 | 6.5% | 8.4% | 63,048 |
| Illinois | 119,544 | 2.2% | 2.4% | 131,171 |
| Indiana | 127,964 | 4.2% | 4.5% | 131,535 |
| Iowa | 46,829 | 3.2% | 3.5% | 49,099 |
| Kansas | 52,753 | 4.0% | 4.5% | 57,763 |
| Kentucky | 211,861 | 10.3% | 11.4% | 228,536 |
| Louisiana | 260,511 | 12.2% | 13.2% | 275,521 |
| Maine | 63,082 | 8.2% | 8.2% | 61,719 |
| Maryland | 35,248 | 1.4% | 1.4% | 35,770 |
| Massachusetts | 26,128 | 0.9% | 0.8% | 23,506 |
| Michigan | 234,347 | 5.0% | 5.3% | 247,267 |
| Minnesota | 70,336 | 2.7% | 3.2% | 78,941 |
| Mississippi | 189,635 | 14.0% | 14.7% | 196,251 |
| Missouri | 143,622 | 5.0% | 6.1% | 170,630 |
| Montana | 51,792 | 9.6% | 9.9% | 51,580 |
| Nebraska | 22,737 | 2.6% | 3.1% | 26,791 |
| Nevada | 71,125 | 5.2% | 5.4% | 69,366 |
| New Hampshire | 36,273 | 5.5% | 5.6% | 36,269 |
| New Jersey | 34,792 | 0.9% | 1.0% | 35,245 |
| New Mexico | 146,137 | 15.0% | 16.8% | 159,462 |
| New York | 183,310 | 2.1% | 2.3% | 190,184 |
| North Carolina | 525,544 | 10.4% | 12.2% | 579,642 |
| North Dakota | 21,813 | 5.7% | 7.1% | 27,036 |
| Ohio | 176,771 | 3.3% | 3.7% | 192,006 |
| Oklahoma | 143,632 | 8.0% | 9.1% | 159,770 |
| Oregon | 126,727 | 6.7% | 7.4% | 134,714 |
| Pennsylvania | 198,970 | 3.4% | 3.7% | 214,090 |
| Rhode Island | 3,736 | 0.8% | 0.8% | 3,939 |
| South Carolina | 325,090 | 12.8% | 15.4% | 361,418 |
| South Dakota | 30,656 | 7.2% | 8.4% | 33,656 |
| Tennessee | 244,600 | 7.5% | 8.8% | 266,965 |
| Texas | 776,232 | 6.2% | 6.8% | 770,903 |
| Utah | 38,395 | 3.0% | 3.3% | 37,153 |
| Vermont | 21,891 | 6.4% | 6.4% | 21,640 |
| Virginia | 166,299 | 4.4% | 4.9% | 173,875 |
| Washington | 180,785 | 5.3% | 6.1% | 196,470 |
| West Virginia | 114,584 | 13.2% | 14.0% | 124,903 |
| Wisconsin | 84,595 | 3.0% | 3.3% | 90,567 |
| Wyoming | 31,794 | 11.3% | 13.0% | 36,424 |
Why it matters for small businesses
- Service demand. Mobile homes need specialized work: skirting, tie-downs, roofs, HVAC and plumbing. In high-share states that’s a steady niche for contractors.
- Housing costs. Where mortgages and rents are high, demand for lower-cost housing grows. Compare rent vs. own costs by state and homeownership by state.
- Insurance and storms. Many high-share states face hurricanes and tornadoes, which affects insurance costs for owners and the businesses that serve them.
About the data
- Source: U.S. Census Bureau, American Community Survey 1-year estimates, table B25024 (units in structure), “mobile home,” 2024 and 2019.
- Counts include all housing units, occupied or vacant. RVs, boats and vans used as homes are counted separately and aren’t included.
- Survey figures have margins of error, especially in smaller states.
Sources
Cite this data
Reporters and bloggers may use these numbers and charts. Please credit StartBusinessByState and link to this page.
Source: StartBusinessByState, “Mobile Homes by State: Where Manufactured Housing Is Most Common,” https://startbusinessbystate.com/mobile-homes-by-state/ (updated October 13, 2026).
FAQ
How many mobile homes are in the U.S.?
About 7,939,191 in 2024, or 5.4% of all homes, according to the U.S. Census Bureau.
Which state has the most mobile homes?
By share of homes, New Mexico (15.0%), followed by Mississippi (14.0%) and West Virginia (13.2%). By count, Florida (824,425).
Which state has the fewest?
District of Columbia (0.1%), then Hawaii (0.3%).
Is the share of mobile homes growing?
No. It slipped from 6.1% of homes in 2019 to 5.4% in 2024.
Where is this data from?
The U.S. Census Bureau’s yearly American Community Survey.
Last updated October 13, 2026 by StartBusinessByState.