By StartBusinessByStatePublisher: Robert SmithResearch process
Training-outcomes research · FY 2024 completion cohort · Published October 26, 2026
“Learn a trade” is easy advice to give. Finishing the training is a different question. The Labor Department’s latest published dashboard puts the nationwide registered-apprenticeship completion rate at 46.49%. In construction, it is 44.61%.
Those figures deserve attention, but they do not mean that the rest simply dropped out. The measure has a defined completion deadline, excludes exits during probation and covers registered apprenticeships across industries. We examined the published rates and the calculation behind them to show what a prospective apprentice—or an employer building a workforce—should actually ask.
Source: U.S. Department of Labor Completion Rate Analysis dashboard (BETA), checked October 26, 2026. Its latest published completion year is FY 2024, not 2026.
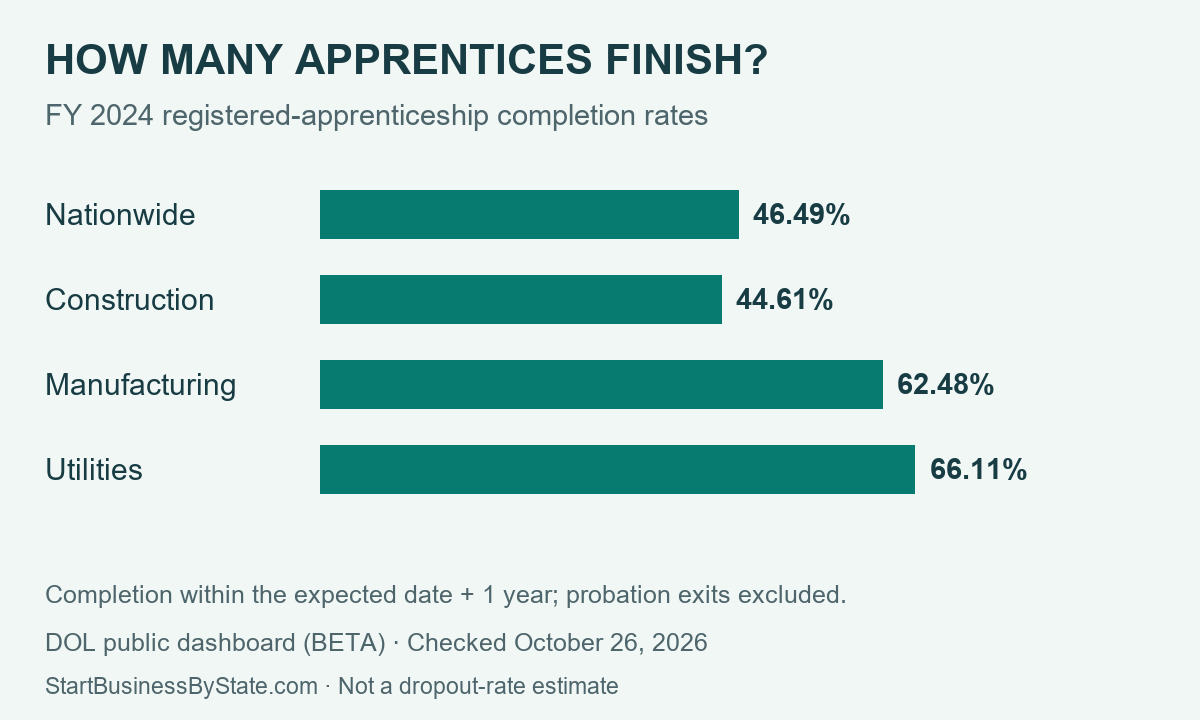
Construction improved, but its rate is still below one-half
Construction moved from 41.60% in FY 2023 to 44.61% in FY 2024, a gain of 3.01 percentage points. Its FY 2020 rate was 42.97%. The latest result is an improvement, not evidence of a new collapse.
For the school-based route, see how certificate programs score on the federal trade school earnings test.
The spread between industries is substantial. Utilities’ 66.11% rate is 21.50 percentage points above construction’s. That does not establish that changing industries causes a better outcome: occupations, sponsors, program lengths and participants differ.
| Industry | FY 2020 | FY 2023 | FY 2024 | 2023–24 change |
|---|---|---|---|---|
| Construction | 42.97% | 41.60% | 44.61% | +3.01 pp |
| Manufacturing | 60.88% | 58.59% | 62.48% | +3.89 pp |
| Utilities | 67.72% | 64.93% | 66.11% | +1.18 pp |
| Transportation and warehousing | 24.59% | 33.65% | 34.51% | +0.86 pp |
| Health care and social assistance | 36.23% | 47.96% | 50.25% | +2.29 pp |
| Educational services | 46.91% | 51.52% | 52.92% | +1.40 pp |
“Construction” is an industry category, not an electrician-only or plumber-only rate. The nationwide figure includes other industries and program types. These selected rows are not a ranking of every training program, trade school or state.
What counts as finishing?
DOL’s March 2026 calculation guidance uses the expected completion date in the apprenticeship agreement and allows one additional year. An apprentice counts as completing if they finish the program requirements within that window. People whose agreements end during probation are excluded from the denominator.
For example, someone whose four-year program was expected to finish in January 2024 has until January 2025 to count as completing within that measure. That is why a FY 2024 completion statistic can require observing events into 2025. It is not a tally of everyone who started or finished during calendar 2024.
Do not calculate a “completion rate” by dividing this year’s completions by this year’s new apprentices. The people in the two groups can be years apart in their training. The dashboard separately reports cancellation, which concerns exits after probation; the complement of the completion percentage is not automatically a dropout rate.
Four questions to ask before committing years to a program
- What is this program’s completion rate for comparable cohorts? Ask which expected completion years it covers, how probationary exits are handled and how much extra time is allowed. A count of graduates without the cohort size does not answer the question.
- What happens if work or instruction is interrupted? Ask about required hours, classroom scheduling, mentor availability and how progress is documented if the employer or project changes.
- What credential will you have at the end? Check the registered-apprenticeship credential and the separate state or local licensing path. Completing training and being authorized to contract independently are different steps.
- What support is available before someone leaves? Ask how the sponsor identifies a struggling apprentice and handles missed instruction, transport problems or gaps in paid work.
For employers, the issue is the pipeline after hiring
Recruiting apprentices only starts the process. A completion measure asks whether the program carries people through the required work and instruction. The result makes supervision, continuity and support part of workforce planning, alongside recruitment.
Pay comparisons answer another part of the decision. Our trade-pay comparison looks at wages; it should not be read as the pay an inexperienced apprentice automatically receives or proof that a particular training purchase pays off.
Method and limits
We used the official dashboard’s default nationwide view and its industry table, with all industries, occupations and states included in the national figure. The table uses Completion, Percentage and Industry as its first column. We transcribed the six displayed industry rows above for FY 2020, FY 2023 and FY 2024, and calculated changes in percentage points. The source exports and calculation checks are retained with this study.
The dashboard is labeled BETA and can be revised. These are published registered-apprenticeship cohort aggregates, not a census of all vocational education or a current 2026 graduation forecast. We do not infer missing state values, rank individual schools, or calculate a probability of success for a specific applicant. Comparing industry averages does not control for the mix of programs or apprentices.
Analysis and chart by StartBusinessByState. Cite this comparison alongside DOL’s underlying dashboard and cohort definition.