Updated October 14, 2026. Data: U.S. Commerce Department, Bureau of Economic Analysis, state household spending for 2025, released September 30, 2026. Next update: fall 2027.
After subtracting the claims insurers expect to pay out, U.S. households spent $323 per person on car insurance in 2025, and the total rose 9.1% in a year. Spending per person was highest in Florida ($568), Massachusetts ($499) and North Dakota ($497). Leaving out Louisiana, the lowest were Georgia ($171), South Dakota ($189) and Alaska ($191). Louisiana’s figure ($98) is far below every other state and is explained below.
Read this first: this is not your premium. The government measures car insurance spending as premiums minus the claims insurers normally pay back to policyholders. Claim payments are counted elsewhere, as spending on car repairs and medical care. So this number is closer to the cost of the insurance itself (insurers’ expenses and profit) than to the bill on your policy. Premiums themselves are much larger, because most of what drivers pay goes back out as claims. The measure also includes a small amount of other transportation insurance.
Why Louisiana looks so low
Louisiana shows $98 per person, less than a third of the U.S. figure and well under the next-lowest state, Georgia ($171). Its total also fell 8.2% from 2024, while the national total rose. Because the measure is premiums minus claims, a state where insurers pay out a large share of what they collect will show a low number, even if drivers there pay high premiums. That makes Louisiana’s figure a statement about claims compared with premiums, not a sign that insurance is cheap there. We haven’t confirmed the exact reason with the department, so we leave Louisiana out of the “lowest” rankings on this page but keep it in the table.
Spending per person in each state
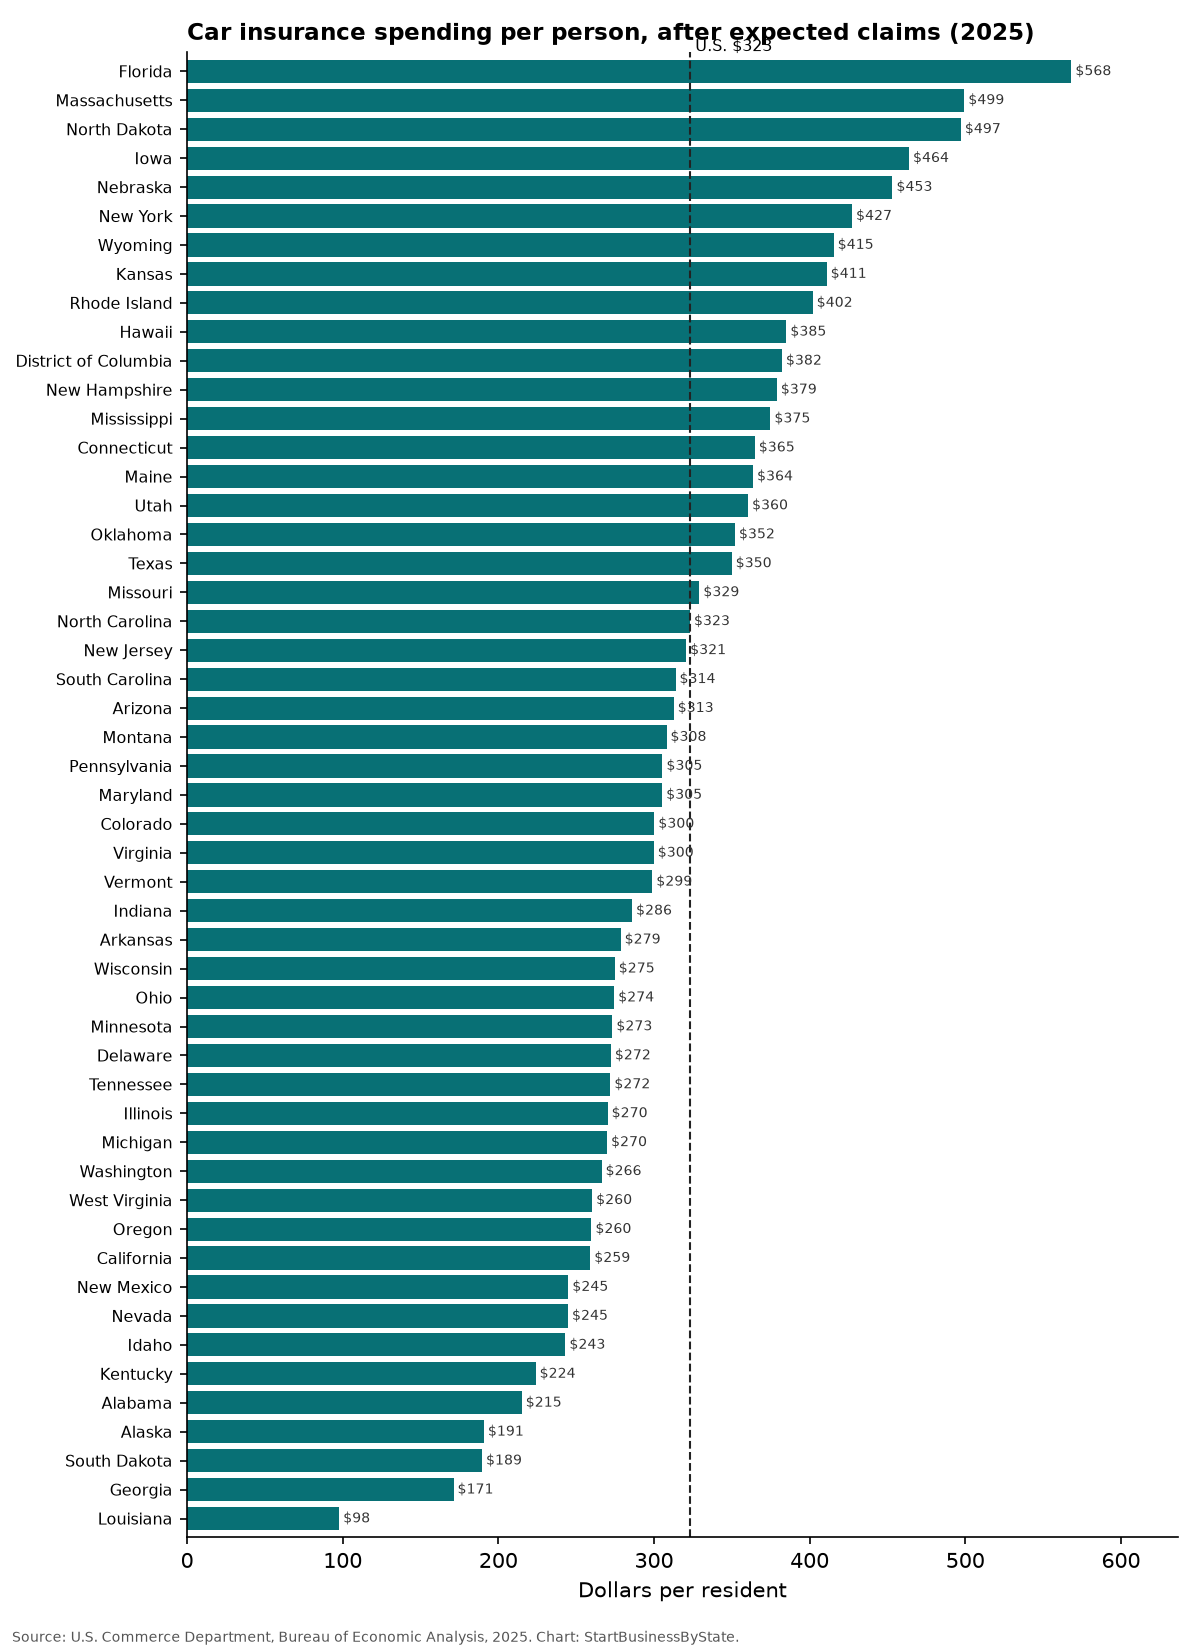
Total spending grew fastest in North Dakota (+19.9%), Montana (+15.5%) and Rhode Island (+14.0%) and slowest in Georgia (+0.1%), Nebraska (+0.2%) and Kansas (+2.7%).
Every state: spending per person, 2025
Click a column to sort.
| State | Per person, 2025 | Per person, 2024 | Per person, 2019 | Total change, 2024–25 | Total, 2025 | Share of all spending |
|---|---|---|---|---|---|---|
| U.S. | $323 | $298 | $251 | +9.1% | $110.5B | 0.53% |
| Alabama | $215 | $198 | $201 | +9.2% | $1.12B | 0.44% |
| Alaska | $191 | $181 | $248 | +5.6% | $0.14B | 0.27% |
| Arizona | $313 | $286 | $231 | +10.2% | $2.38B | 0.54% |
| Arkansas | $279 | $254 | $259 | +10.3% | $0.87B | 0.58% |
| California | $259 | $240 | $221 | +8.0% | $10.20B | 0.37% |
| Colorado | $300 | $270 | $189 | +11.5% | $1.81B | 0.44% |
| Connecticut | $365 | $350 | $331 | +4.7% | $1.35B | 0.52% |
| Delaware | $272 | $247 | $251 | +11.1% | $0.29B | 0.43% |
| District of Columbia | $382 | $366 | $289 | +4.8% | $0.27B | 0.39% |
| Florida | $568 | $515 | $475 | +11.2% | $13.33B | 0.86% |
| Georgia | $171 | $173 | $197 | +0.1% | $1.94B | 0.31% |
| Hawaii | $385 | $363 | $333 | +6.0% | $0.55B | 0.60% |
| Idaho | $243 | $219 | $224 | +12.8% | $0.49B | 0.49% |
| Illinois | $270 | $257 | $219 | +5.3% | $3.44B | 0.42% |
| Indiana | $286 | $266 | $203 | +7.9% | $1.99B | 0.53% |
| Iowa | $464 | $433 | $307 | +7.4% | $1.50B | 0.90% |
| Kansas | $411 | $402 | $301 | +2.7% | $1.22B | 0.77% |
| Kentucky | $224 | $203 | $188 | +11.0% | $1.03B | 0.43% |
| Louisiana | $98 | $107 | $275 | -8.2% | $0.45B | 0.19% |
| Maine | $364 | $342 | $285 | +6.8% | $0.51B | 0.56% |
| Maryland | $305 | $279 | $215 | +9.8% | $1.91B | 0.50% |
| Massachusetts | $499 | $443 | $322 | +12.9% | $3.57B | 0.67% |
| Michigan | $270 | $250 | $130 | +8.1% | $2.73B | 0.47% |
| Minnesota | $273 | $257 | $278 | +6.8% | $1.59B | 0.45% |
| Mississippi | $375 | $347 | $270 | +8.3% | $1.11B | 0.82% |
| Missouri | $329 | $311 | $209 | +6.4% | $2.06B | 0.58% |
| Montana | $308 | $268 | $255 | +15.5% | $0.35B | 0.50% |
| Nebraska | $453 | $455 | $346 | +0.2% | $0.91B | 0.80% |
| Nevada | $245 | $225 | $176 | +9.8% | $0.80B | 0.42% |
| New Hampshire | $379 | $357 | $281 | +6.7% | $0.54B | 0.52% |
| New Jersey | $321 | $290 | $235 | +11.2% | $3.06B | 0.47% |
| New Mexico | $245 | $226 | $183 | +8.4% | $0.52B | 0.48% |
| New York | $427 | $395 | $270 | +8.1% | $8.55B | 0.61% |
| North Carolina | $323 | $301 | $240 | +8.7% | $3.62B | 0.58% |
| North Dakota | $497 | $418 | $544 | +19.9% | $0.40B | 0.81% |
| Ohio | $274 | $257 | $212 | +7.0% | $3.27B | 0.50% |
| Oklahoma | $352 | $333 | $219 | +6.5% | $1.45B | 0.74% |
| Oregon | $260 | $240 | $233 | +8.3% | $1.11B | 0.43% |
| Pennsylvania | $305 | $281 | $231 | +8.7% | $3.99B | 0.49% |
| Rhode Island | $402 | $354 | $262 | +14.0% | $0.45B | 0.66% |
| South Carolina | $314 | $290 | $247 | +9.7% | $1.75B | 0.58% |
| South Dakota | $189 | $175 | $168 | +8.9% | $0.18B | 0.33% |
| Tennessee | $272 | $250 | $183 | +9.7% | $1.99B | 0.51% |
| Texas | $350 | $312 | $288 | +13.7% | $11.10B | 0.63% |
| Utah | $360 | $324 | $246 | +12.5% | $1.28B | 0.66% |
| Vermont | $299 | $286 | $259 | +4.2% | $0.19B | 0.46% |
| Virginia | $300 | $273 | $212 | +10.5% | $2.66B | 0.49% |
| Washington | $266 | $244 | $215 | +10.0% | $2.13B | 0.41% |
| West Virginia | $260 | $248 | $246 | +4.8% | $0.46B | 0.49% |
| Wisconsin | $275 | $259 | $224 | +6.4% | $1.64B | 0.48% |
| Wyoming | $415 | $376 | $255 | +11.0% | $0.24B | 0.66% |
Why it matters for small businesses
- Shops that fix cars are paid largely out of claim money, which this number leaves out. See how many auto repair shops each state has. For the repair side, see what households spend on car repairs.
- Business vehicles cost more to insure. If you drive for work, a personal policy may not cover you. Commercial auto coverage is priced separately.
- Rising costs squeeze budgets. Insurance is one of the fixed bills that leaves less for other spending.
Driving for your business?
Compare business insurance quotes from Simply Business, including commercial auto.
We may earn a commission if you use this link. It doesn’t change what you pay, and it doesn’t affect the data on this page.
How we counted
- Source: U.S. Commerce Department, Bureau of Economic Analysis, state personal consumption spending by type of product (released September 30, 2026), category “Net motor vehicle and other transportation insurance,” 2019, 2024 and 2025, in current dollars (not adjusted for inflation).
- Per person: total spending divided by the department’s own population estimate for the same state and year.
- Where it’s counted: spending is assigned to the state where the buyer lives, as best the department can estimate.
- Change compares total spending in 2025 with 2024. Per-person change is a little lower because population grew.
Sources
Cite this data
Reporters and bloggers may use these numbers and charts. Please credit StartBusinessByState and link to this page.
Source: StartBusinessByState, “Car Insurance Costs Rose 9% in a Year: What Americans Paid Beyond Claims,” https://startbusinessbystate.com/auto-insurance-spending/ (updated October 14, 2026).
FAQ
How much do Americans spend on car insurance per person?
$323 per person in 2025, counting premiums minus the claims insurers normally pay out, according to the U.S. Commerce Department. Actual premiums are much higher.
Which state spends the most on car insurance?
Florida ($568 per person), followed by Massachusetts ($499) and North Dakota ($497).
Why is Louisiana so low?
The measure subtracts claims from premiums. Louisiana’s $98 likely reflects claims that are large compared with premiums, not cheap coverage. We list it but leave it out of the rankings.
Is car insurance spending rising?
Yes. The U.S. total rose 9.1% from 2024 to 2025 before inflation, fastest in North Dakota (+19.9%).
Where is this data from?
The U.S. Commerce Department publishes household spending for each state and type of product every fall.
Last updated October 14, 2026 by StartBusinessByState.