Updated October 15, 2026. Data: U.S. Labor Department, Bureau of Labor Statistics, quarterly count of jobs and wages from employer tax records, first quarter 2026 vs. first quarter 2025. Figures are preliminary. Second-quarter 2026 figures are due in December.
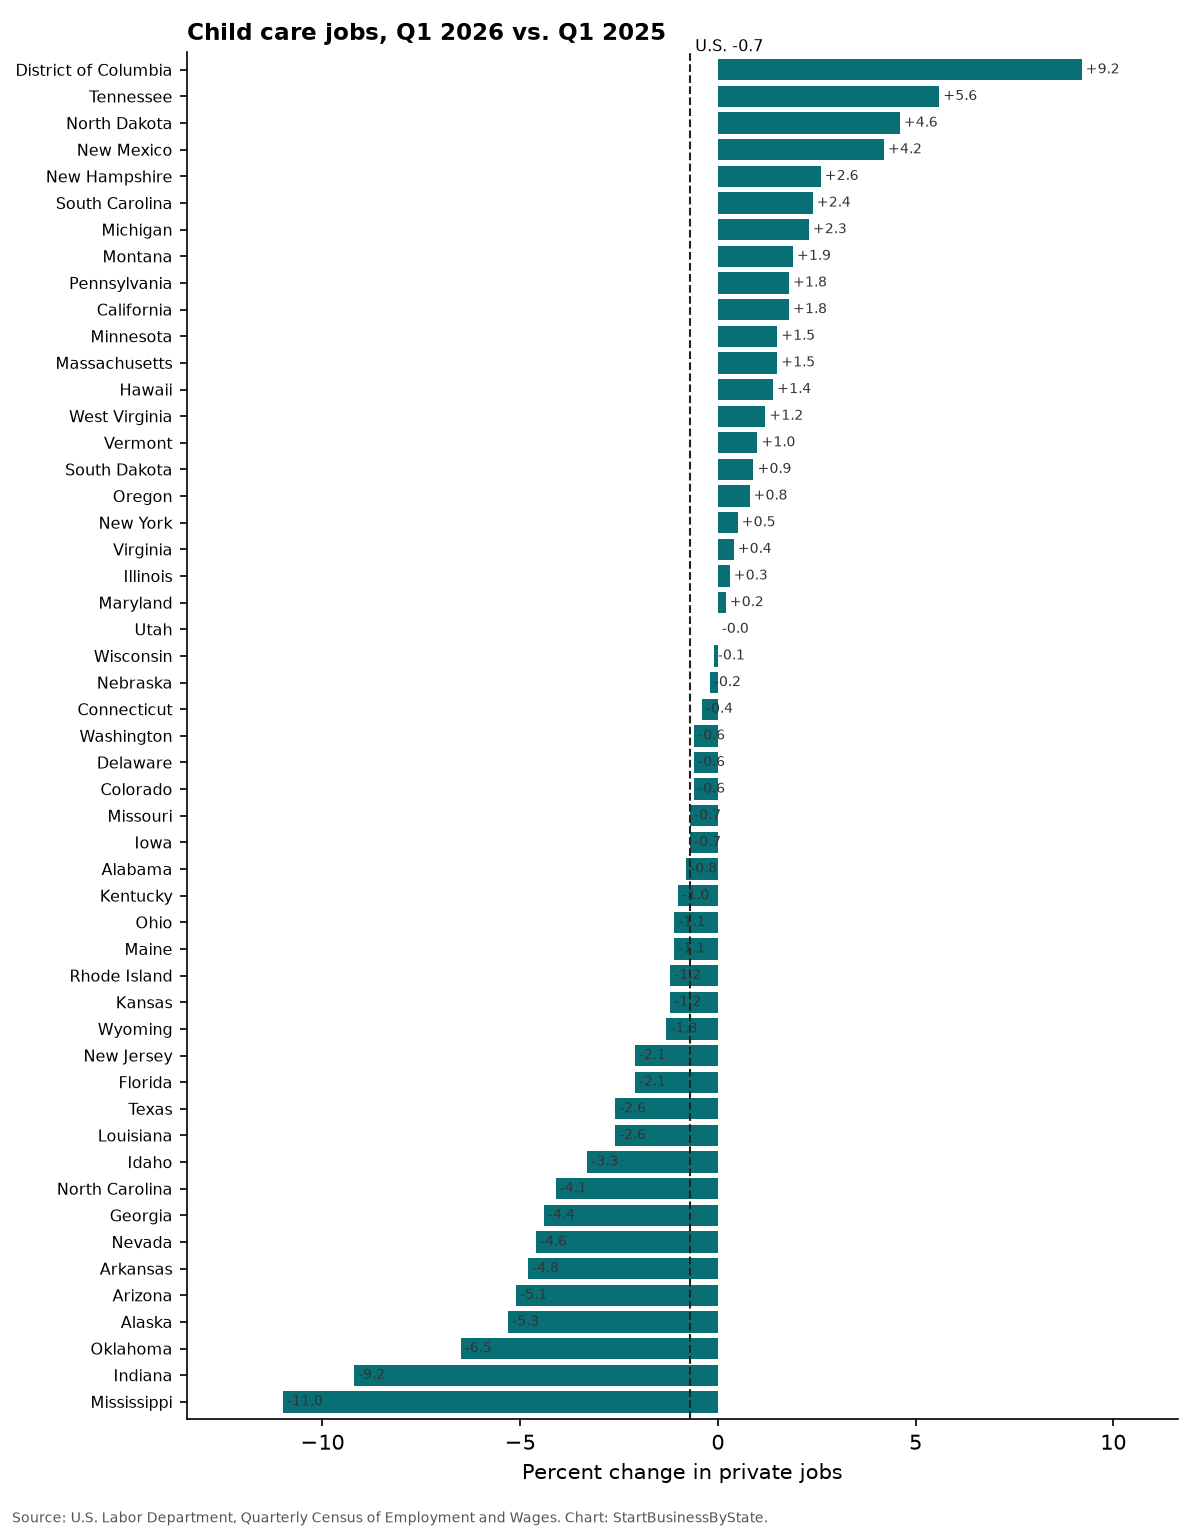
Private child care centers employed about 987,262 people in early 2026, down 0.7% from a year earlier, even though the number of locations rose 0.9%. The biggest cuts were in Mississippi (-11.0%) and Indiana (-9.2%).
The national picture
Private child care businesses, first quarter of each year. Jobs are the average of January, February and March.
| Q1 2025 | Q1 2026 | Change | |
|---|---|---|---|
| Jobs | 994,449 | 987,262 | -0.7% |
| Business locations | 78,906 | 79,617 | +0.9% |
| Jobs per location | 12.6 | 12.4 | -1.6% |
| Average weekly pay | $616 | $632 | +2.6% |
What the numbers show, and what they don’t
- Fewer workers per center. The average fell from 12.6 to 12.4 jobs per location. That fits with centers struggling to hire and keep staff, though the data doesn’t give reasons.
- Mississippi lost about 1,143 child care jobs (-11.0%), while its number of centers rose 3.4%.
- Washington added centers. Locations rose 6.4% and average pay rose 5.9% to $735 a week, while jobs held about steady (-0.6%).
- Pay is still low. Average weekly pay rose 2.6% to $632. Many jobs are part-time.
- What’s included: privately owned child care centers and preschools that aren’t part of a school. Home-based providers with no employees aren’t counted.
For owners and would-be owners
- Insurance is often required for licensing. See what daycare insurance covers. State rules differ; for example, see daycare insurance in Mississippi or daycare insurance in Washington.
- Set up the business. Many centers form an LLC before signing a lease. See how to set up an LLC.
- Paying for a building. See the main types of business loans.
Opening a daycare?
Compare business insurance quotes from Simply Business. Need to form your company first? Form your LLC with ZenBusiness.
We may earn a commission if you use this link. It doesn’t change what you pay, and it doesn’t affect the data on this page.
State numbers
Jobs grew in 21 of the 51 states shown in the chart. The chart leaves out states with fewer than 1,000 jobs a year earlier, because small numbers swing a lot; they’re still in the table.
Click a column to sort.
| State | Jobs, Q1 2026 | Jobs, Q1 2025 | Change | Locations, Q1 2026 | Locations change | Average weekly pay |
|---|---|---|---|---|---|---|
| Alabama | 11,723 | 11,813 | -0.8% | 1,078 | +3.6% | $493 |
| Alaska | 1,623 | 1,713 | -5.3% | 133 | +0.8% | $611 |
| Arizona | 12,957 | 13,657 | -5.1% | 826 | +0.7% | $630 |
| Arkansas | 11,247 | 11,809 | -4.8% | 808 | -2.3% | $531 |
| California | 85,821 | 84,263 | +1.8% | 9,755 | +3.9% | $794 |
| Colorado | 17,104 | 17,209 | -0.6% | 1,111 | +4.1% | $722 |
| Connecticut | 15,739 | 15,809 | -0.4% | 966 | +0.3% | $633 |
| Delaware | 3,893 | 3,918 | -0.6% | 292 | -3.9% | $642 |
| District of Columbia | 4,351 | 3,986 | +9.2% | 278 | +4.5% | $997 |
| Florida | 60,119 | 61,387 | -2.1% | 4,551 | +1.2% | $633 |
| Georgia | 33,291 | 34,834 | -4.4% | 2,637 | -2.9% | $577 |
| Hawaii | 3,589 | 3,540 | +1.4% | 380 | -4.8% | $764 |
| Idaho | 3,941 | 4,076 | -3.3% | 517 | -11.2% | $431 |
| Illinois | 39,265 | 39,143 | +0.3% | 2,914 | +3.1% | $686 |
| Indiana | 13,827 | 15,220 | -9.2% | 1,317 | -1.4% | $555 |
| Iowa | 12,931 | 13,027 | -0.7% | 805 | -0.7% | $443 |
| Kansas | 7,045 | 7,129 | -1.2% | 468 | +0.6% | $507 |
| Kentucky | 12,809 | 12,932 | -1.0% | 1,045 | +0.8% | $501 |
| Louisiana | 12,215 | 12,544 | -2.6% | 1,251 | +1.9% | $491 |
| Maine | 5,677 | 5,738 | -1.1% | 617 | -4.6% | $653 |
| Maryland | 19,359 | 19,312 | +0.2% | 1,316 | -2.0% | $687 |
| Massachusetts | 32,519 | 32,026 | +1.5% | 2,131 | +4.9% | $788 |
| Michigan | 21,283 | 20,798 | +2.3% | 1,733 | -1.8% | $552 |
| Minnesota | 18,883 | 18,599 | +1.5% | 1,256 | +0.7% | $623 |
| Mississippi | 9,223 | 10,366 | -11.0% | 883 | +3.4% | $491 |
| Missouri | 17,040 | 17,159 | -0.7% | 1,341 | -0.2% | $570 |
| Montana | 3,485 | 3,419 | +1.9% | 486 | +3.6% | $520 |
| Nebraska | 10,234 | 10,252 | -0.2% | 721 | +0.3% | $488 |
| Nevada | 5,106 | 5,354 | -4.6% | 354 | +1.7% | $563 |
| New Hampshire | 5,777 | 5,633 | +2.6% | 443 | -1.8% | $647 |
| New Jersey | 41,566 | 42,438 | -2.1% | 2,401 | +0.5% | $676 |
| New Mexico | 7,163 | 6,873 | +4.2% | 438 | -1.4% | $684 |
| New York | 81,399 | 81,018 | +0.5% | 6,285 | -2.0% | $713 |
| North Carolina | 30,852 | 32,176 | -4.1% | 2,514 | +3.1% | $597 |
| North Dakota | 4,401 | 4,207 | +4.6% | 362 | +4.9% | $444 |
| Ohio | 34,249 | 34,644 | -1.1% | 2,835 | -0.8% | $562 |
| Oklahoma | 10,420 | 11,140 | -6.5% | 950 | -3.4% | $467 |
| Oregon | 14,722 | 14,606 | +0.8% | 1,637 | -1.1% | $699 |
| Pennsylvania | 46,937 | 46,116 | +1.8% | 3,734 | +2.3% | $610 |
| Rhode Island | 4,127 | 4,176 | -1.2% | 314 | -1.9% | $663 |
| South Carolina | 10,951 | 10,692 | +2.4% | 841 | +0.6% | $569 |
| South Dakota | 3,709 | 3,675 | +0.9% | 246 | +1.7% | $448 |
| Tennessee | 17,126 | 16,213 | +5.6% | 1,195 | +5.5% | $550 |
| Texas | 82,418 | 84,656 | -2.6% | 6,131 | +0.4% | $557 |
| Utah | 8,117 | 8,120 | -0.0% | 662 | -1.9% | $514 |
| Vermont | 3,213 | 3,181 | +1.0% | 268 | -2.5% | $713 |
| Virginia | 25,332 | 25,233 | +0.4% | 1,829 | +1.8% | $621 |
| Washington | 22,792 | 22,930 | -0.6% | 2,374 | +6.4% | $735 |
| West Virginia | 4,426 | 4,372 | +1.2% | 452 | -2.8% | $455 |
| Wisconsin | 18,949 | 18,972 | -0.1% | 1,531 | +1.1% | $588 |
| Wyoming | 2,318 | 2,348 | -1.3% | 205 | +0.0% | $557 |
How we counted
- Source: U.S. Labor Department, Quarterly Census of Employment and Wages, industry 624410 (child care services), privately owned businesses, first quarter of 2026 and 2025.
- Jobs are the average of the three monthly counts and include full- and part-time workers on payroll. Owners with no payroll and self-employed people aren’t counted.
- Locations are individual work sites, not companies. A company with ten sites counts ten times.
- Weekly pay is total pay divided by jobs, so part-time work pulls it down.
- Preliminary: first-quarter 2026 figures can be revised.
Sources
Cite this data
Reporters and bloggers may use these numbers and charts. Please credit StartBusinessByState and link to this page.
Source: StartBusinessByState, “Child Care Jobs Fell 0.7% in a Year as Centers Run Leaner,” https://startbusinessbystate.com/child-care-jobs/ (updated October 15, 2026).
FAQ
Are child care jobs growing?
No. Private child care jobs were 0.7% lower in the first quarter of 2026 than a year earlier, about 987,262, according to the U.S. Labor Department.
Which states lost the most child care jobs?
Mississippi (-11.0%), Indiana (-9.2%) and Oklahoma (-6.5%).
Where are child care jobs growing?
District of Columbia (+9.2%), Tennessee (+5.6%) and North Dakota (+4.6%).
How much do child care workers earn?
Average weekly pay at private child care centers was $632 in early 2026, up 2.6%.
Where is this data from?
The U.S. Labor Department’s quarterly count of jobs from employer unemployment-insurance tax records, which covers nearly all payroll jobs.
Last updated October 15, 2026 by StartBusinessByState.