Updated October 15, 2026. Data: U.S. Commerce Department, Bureau of Economic Analysis, state household spending for 2025, released September 30, 2026. Next update: fall 2027.
Americans spent $626 per person on gambling in 2025, after winnings, and the total rose 8.5% from 2024. Spending per person was highest in Alaska ($1,418), Washington ($1,128) and District of Columbia ($966) and lowest in Mississippi ($320), Arkansas ($356) and West Virginia ($365).
This is money lost, not money bet. The government counts gambling spending as what people wager minus what they win back. It covers casinos, lotteries, sports betting, horse racing and other legal gambling. Amounts are in current dollars.
Rules on casinos, lotteries and online sports betting differ a lot from state to state, which helps explain the gaps. A state with no casinos can still rank high if residents travel to gamble or play the lottery heavily.
Spending per person in each state
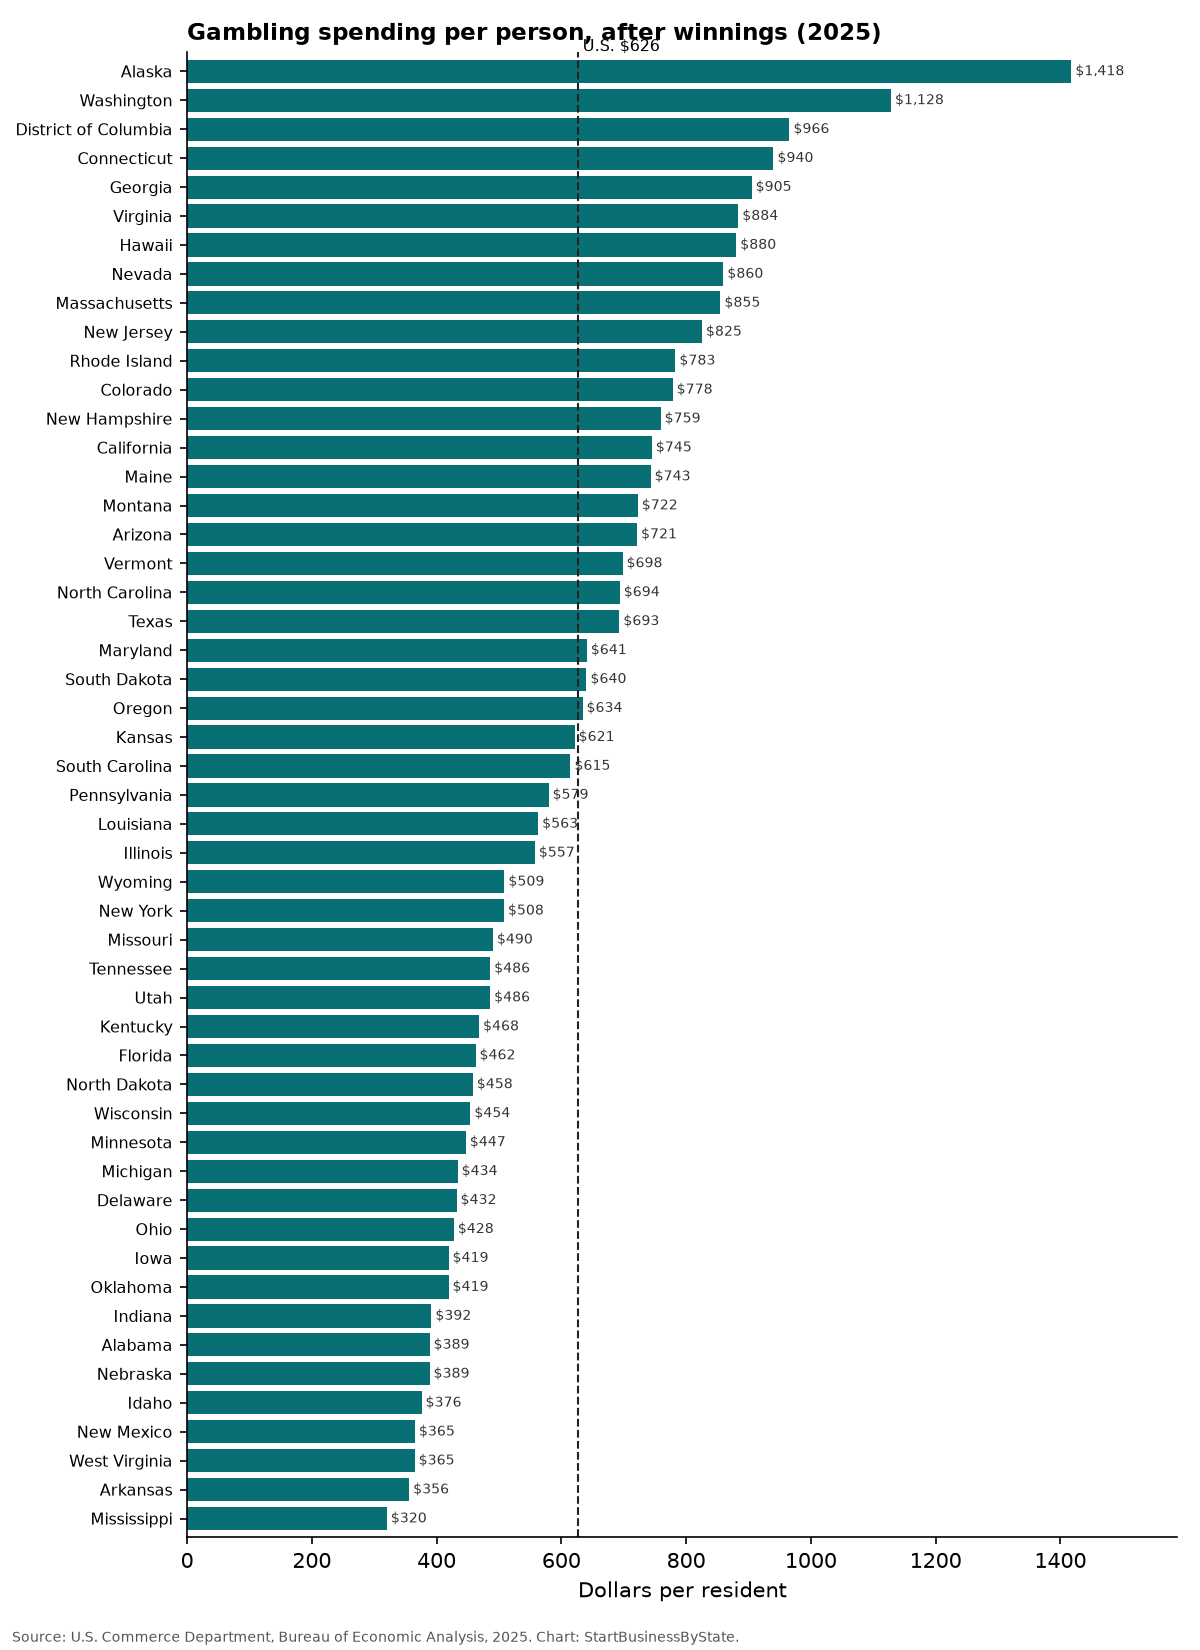
Total spending grew fastest in West Virginia (+15.2%), Washington (+14.7%) and Kentucky (+11.8%) and slowest in Florida (+2.8%), Missouri (+4.4%) and Michigan (+5.5%).
Every state: spending per person, 2025
Click a column to sort.
| State | Per person, 2025 | Per person, 2024 | Per person, 2019 | Total change, 2024–25 | Total, 2025 | Share of all spending |
|---|---|---|---|---|---|---|
| U.S. | $626 | $580 | $448 | +8.5% | $214.0B | 1.03% |
| Alabama | $389 | $353 | $261 | +10.7% | $2.02B | 0.80% |
| Alaska | $1,418 | $1,319 | $1,036 | +7.6% | $1.05B | 2.02% |
| Arizona | $721 | $673 | $548 | +8.1% | $5.50B | 1.24% |
| Arkansas | $356 | $330 | $246 | +8.6% | $1.11B | 0.74% |
| California | $745 | $687 | $513 | +8.5% | $29.32B | 1.06% |
| Colorado | $778 | $729 | $590 | +7.2% | $4.68B | 1.14% |
| Connecticut | $940 | $866 | $578 | +8.9% | $3.47B | 1.34% |
| Delaware | $432 | $412 | $333 | +5.8% | $0.46B | 0.68% |
| District of Columbia | $966 | $890 | $685 | +8.9% | $0.67B | 0.98% |
| Florida | $462 | $454 | $357 | +2.8% | $10.85B | 0.70% |
| Georgia | $905 | $839 | $646 | +8.8% | $10.23B | 1.64% |
| Hawaii | $880 | $807 | $594 | +8.9% | $1.26B | 1.38% |
| Idaho | $376 | $343 | $251 | +11.1% | $0.76B | 0.76% |
| Illinois | $557 | $510 | $420 | +9.5% | $7.09B | 0.87% |
| Indiana | $392 | $357 | $255 | +10.4% | $2.73B | 0.72% |
| Iowa | $419 | $386 | $290 | +8.8% | $1.36B | 0.82% |
| Kansas | $621 | $567 | $425 | +10.0% | $1.85B | 1.16% |
| Kentucky | $468 | $421 | $294 | +11.8% | $2.16B | 0.91% |
| Louisiana | $563 | $524 | $377 | +7.5% | $2.60B | 1.07% |
| Maine | $743 | $685 | $479 | +8.9% | $1.05B | 1.14% |
| Maryland | $641 | $593 | $439 | +8.5% | $4.01B | 1.05% |
| Massachusetts | $855 | $803 | $723 | +6.8% | $6.12B | 1.14% |
| Michigan | $434 | $412 | $307 | +5.5% | $4.39B | 0.76% |
| Minnesota | $447 | $416 | $342 | +8.0% | $2.61B | 0.73% |
| Mississippi | $320 | $301 | $241 | +6.7% | $0.95B | 0.70% |
| Missouri | $490 | $472 | $402 | +4.4% | $3.07B | 0.86% |
| Montana | $722 | $670 | $460 | +8.5% | $0.83B | 1.18% |
| Nebraska | $389 | $357 | $279 | +9.5% | $0.78B | 0.68% |
| Nevada | $860 | $785 | $611 | +10.5% | $2.82B | 1.47% |
| New Hampshire | $759 | $703 | $515 | +8.5% | $1.07B | 1.05% |
| New Jersey | $825 | $761 | $598 | +8.9% | $7.88B | 1.20% |
| New Mexico | $365 | $331 | $266 | +10.1% | $0.78B | 0.72% |
| New York | $508 | $474 | $411 | +7.2% | $10.16B | 0.73% |
| North Carolina | $694 | $648 | $460 | +8.5% | $7.77B | 1.25% |
| North Dakota | $458 | $426 | $335 | +8.4% | $0.37B | 0.75% |
| Ohio | $428 | $397 | $306 | +8.0% | $5.09B | 0.77% |
| Oklahoma | $419 | $388 | $332 | +8.6% | $1.73B | 0.88% |
| Oregon | $634 | $591 | $396 | +7.4% | $2.71B | 1.04% |
| Pennsylvania | $579 | $547 | $433 | +6.1% | $7.57B | 0.93% |
| Rhode Island | $783 | $709 | $507 | +10.8% | $0.87B | 1.28% |
| South Carolina | $615 | $571 | $411 | +9.1% | $3.42B | 1.15% |
| South Dakota | $640 | $579 | $421 | +11.6% | $0.60B | 1.13% |
| Tennessee | $486 | $444 | $349 | +10.4% | $3.55B | 0.91% |
| Texas | $693 | $638 | $480 | +10.0% | $21.98B | 1.24% |
| Utah | $486 | $451 | $371 | +8.8% | $1.72B | 0.89% |
| Vermont | $698 | $634 | $421 | +9.7% | $0.45B | 1.06% |
| Virginia | $884 | $807 | $628 | +10.3% | $7.85B | 1.46% |
| Washington | $1,128 | $993 | $772 | +14.7% | $9.03B | 1.72% |
| West Virginia | $365 | $317 | $219 | +15.2% | $0.64B | 0.69% |
| Wisconsin | $454 | $417 | $310 | +9.3% | $2.71B | 0.79% |
| Wyoming | $509 | $479 | $383 | +6.5% | $0.30B | 0.81% |
Why it matters for small businesses
- Bars and restaurants in some states earn money from licensed gaming machines. Rules vary, so check business license rules in each state before adding them.
- Entertainment budgets compete. Money spent on gambling is money not spent at other local entertainment businesses.
- Help is available. If gambling is causing problems, the national helpline at 1-800-GAMBLER is free and confidential.
How we counted
- Source: U.S. Commerce Department, Bureau of Economic Analysis, state personal consumption spending by type of product (released September 30, 2026), category “Gambling,” 2019, 2024 and 2025, in current dollars (not adjusted for inflation).
- Per person: total spending divided by the department’s own population estimate for the same state and year.
- Where it’s counted: spending is assigned to the state where the buyer lives, as best the department can estimate.
- Change compares total spending in 2025 with 2024. Per-person change is a little lower because population grew.
Sources
Cite this data
Reporters and bloggers may use these numbers and charts. Please credit StartBusinessByState and link to this page.
Source: StartBusinessByState, “Gambling Spending Hit $626 a Person in 2025, Up 8.5%,” https://startbusinessbystate.com/gambling-spending/ (updated October 15, 2026).
FAQ
How much do Americans spend on gambling?
$626 per person in 2025, counting wagers minus winnings, according to the U.S. Commerce Department.
Does this count winnings?
Yes. Winnings are subtracted, so the figure is closer to what people lost than to what they bet.
Which state spends the most on gambling?
Alaska ($1,418 per person), followed by Washington ($1,128) and District of Columbia ($966).
Which state spends the least on gambling?
Mississippi ($320), then Arkansas ($356) and West Virginia ($365).
Is gambling spending rising?
The U.S. total changed +8.5% from 2024 to 2025 before inflation. It grew fastest in West Virginia (+15.2%).
Where is this data from?
The U.S. Commerce Department publishes household spending for each state and type of product every fall.
Last updated October 15, 2026 by StartBusinessByState.