By StartBusinessByStatePublisher: Robert SmithResearch process
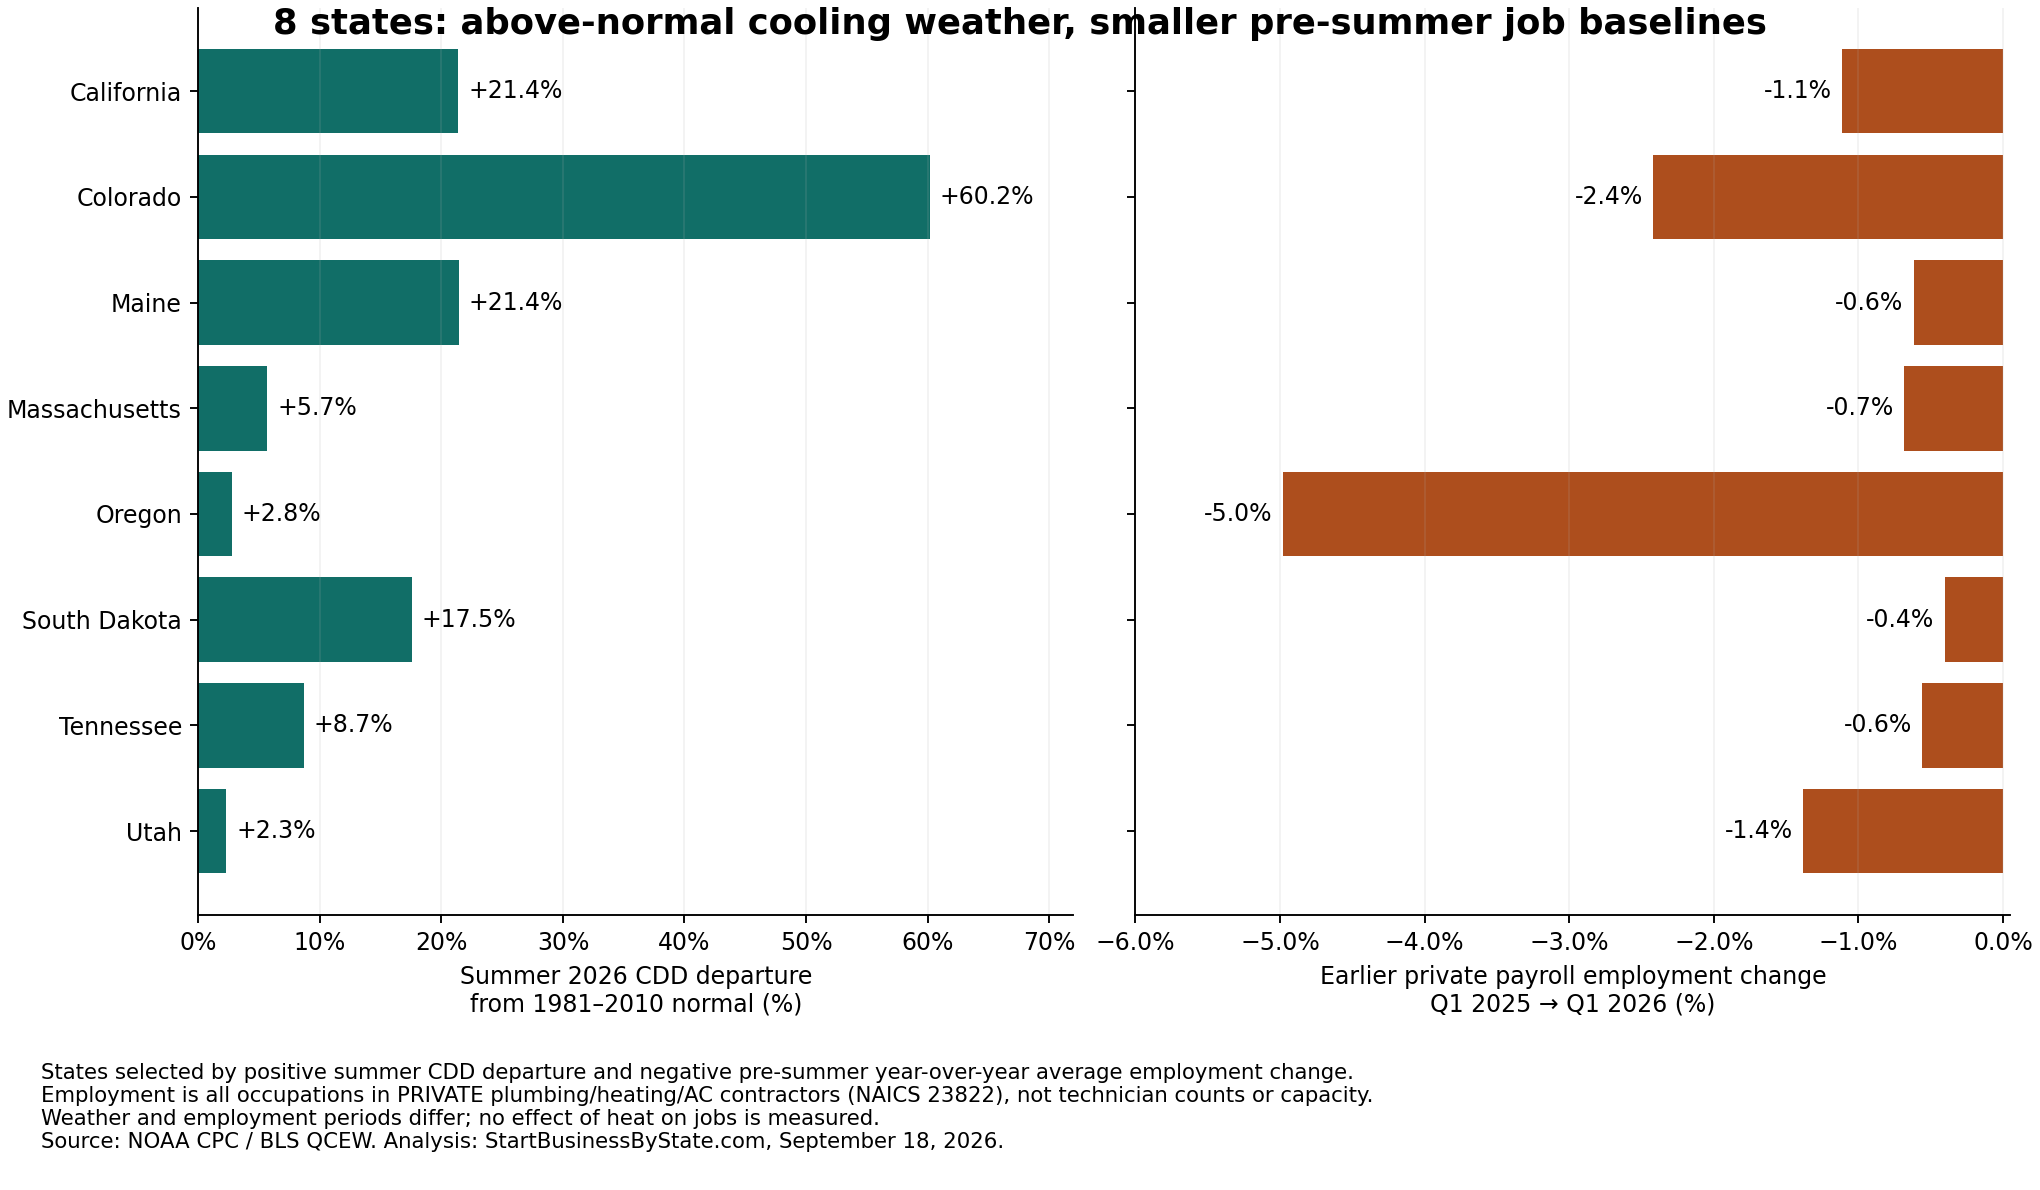
Eight states recorded above-normal summer 2026 cooling weather after entering the year with lower plumbing/HVAC contractor employment than a year earlier. Colorado had the largest relative cooling-degree-day departure in the 48-state comparison, at 60.2% above normal. Its earlier private contractor employment baseline was 2.4% lower year over year.
NOAA’s September 9 climate release identifies June–August 2026 as the contiguous United States’ warmest summer in its 132-year record. Our analysis pairs state cooling-degree-day departures with the latest available pre-summer BLS employment baseline. It shows different state starting points, not a count of technicians available to answer summer service calls.
Published September 18, 2026 · Weather: June 1–August 31, 2026 · Employment: January–March 2026 versus January–March 2025 · Geography: 48 contiguous states · Industry: PRIVATE plumbing, heating and air-conditioning contractors, NAICS 23822.
Three findings reporters can use
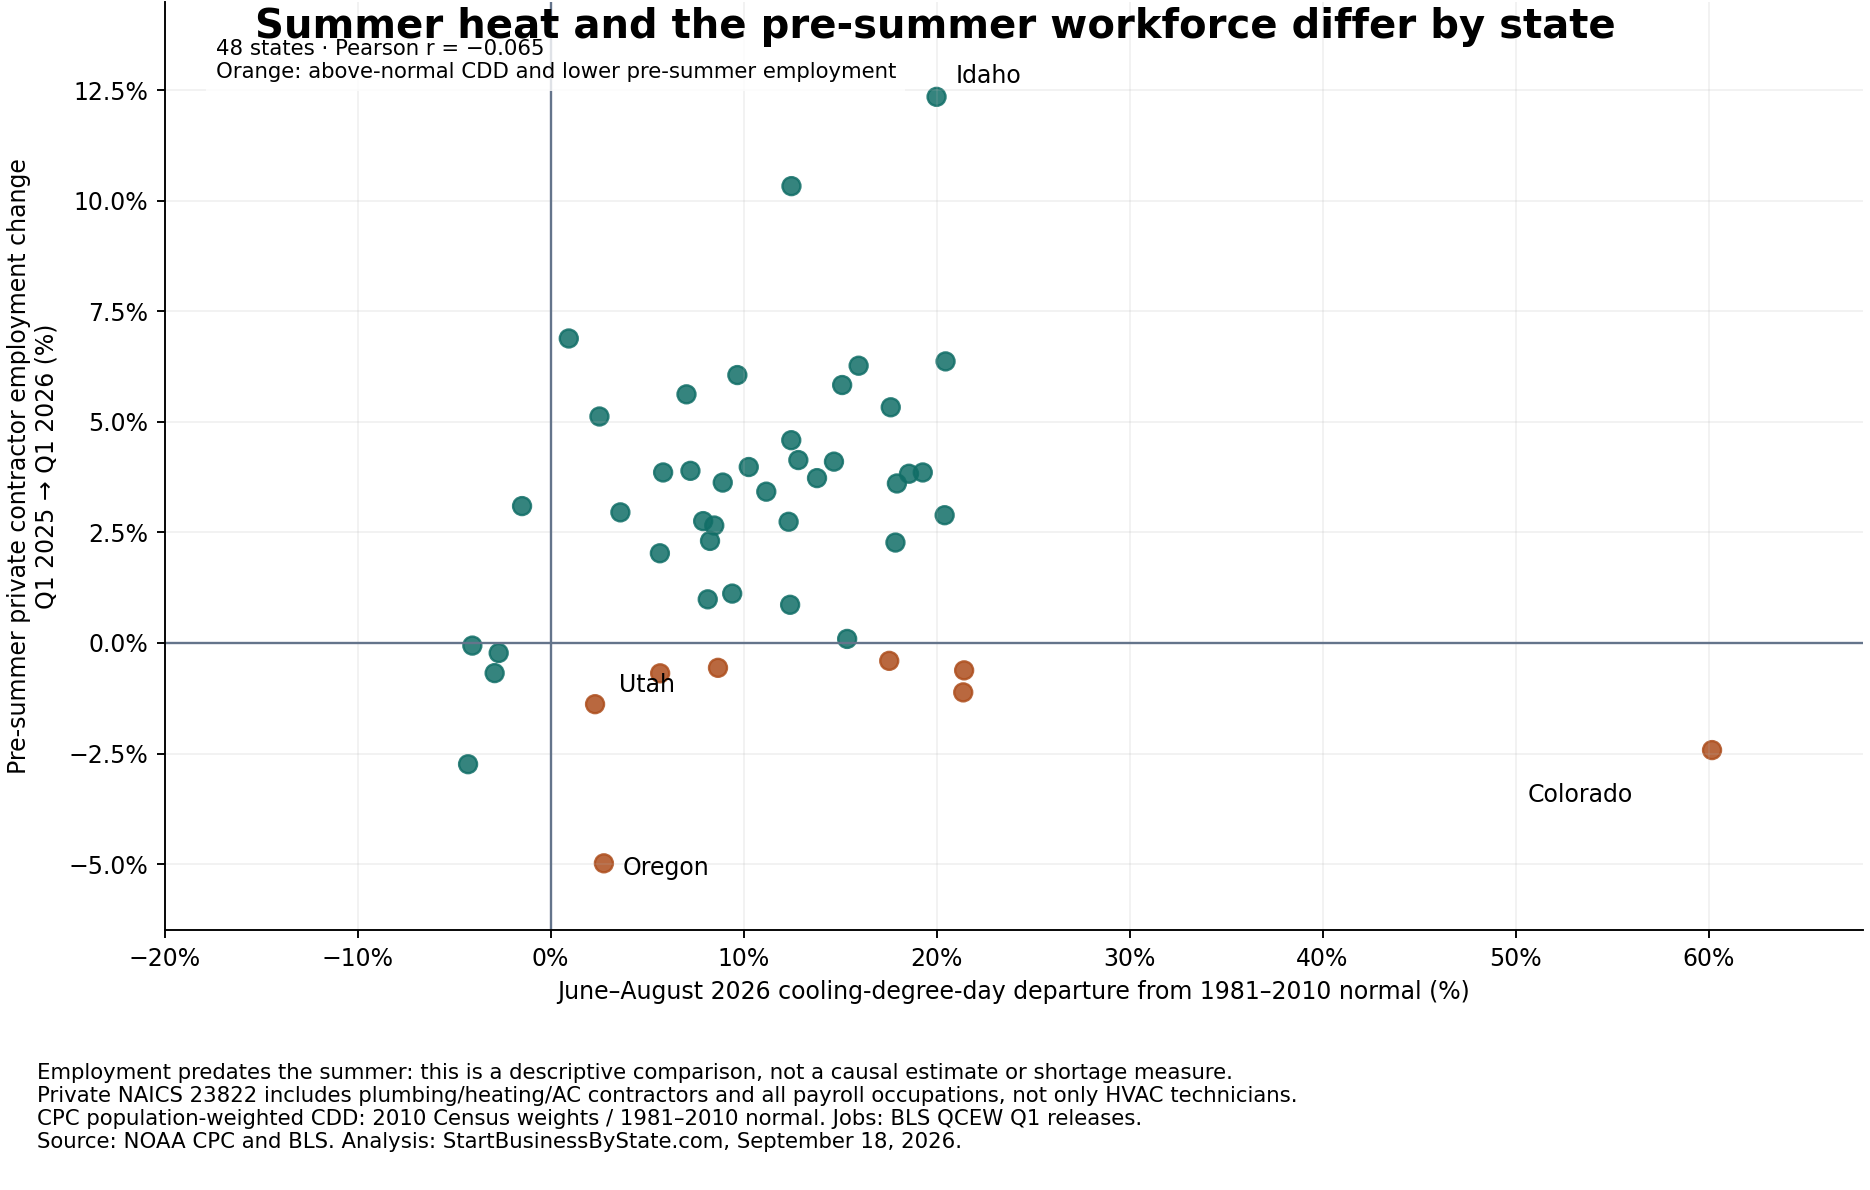
- Above-normal cooling conditions were widespread, but job baselines differed. Forty-two states had summer cooling-degree days above their normal. Eight of those states had lower average private plumbing/HVAC employment in Q1 2026 than Q1 2025. Twelve of the 48 states had lower pre-summer employment overall.
- Colorado provides a clear local comparison. It recorded 527 summer cooling-degree days against a 329 normal, a 60.2% departure. Earlier average contractor employment was about 27,655 in Q1 2026 versus 28,341 a year earlier, down 2.4%. Those payroll counts are rounded averages across January, February and March.
- There is little linear association in this particular cross-state comparison. Pearson r is −0.065 across 48 states between summer CDD departure and earlier year-over-year employment change. That describes the paired data; it cannot test whether employers responded to summer heat because the employment period came first. Idaho illustrates a different starting point: +20.0% summer CDD departure and +12.3% earlier employment growth.
What cooling-degree days measure
A cooling-degree day accumulates when daily mean temperature exceeds a 65°F base. We use NOAA CPC’s population-weighted state product, with 2010 Census population weights and 1981–2010 normals. Higher totals describe temperature-related cooling conditions. They do not measure actual electricity consumption, humidity, heat-index exposure, AC ownership or service calls.
National average-temperature records and these state CDD departures use different metrics, geographic weighting and reference periods. A record national summer does not imply that every state’s population-weighted cooling-degree days exceeded its own normal. We report absolute totals alongside percentage departures; a large percentage departure in a cooler state need not mean the highest absolute cooling total.
Eight states with above-normal cooling weather and smaller earlier job baselines
The group is defined by two separate observed comparisons: positive June–August CDD departure and negative Q1 year-over-year average employment change. This is a descriptive selection, not a shortage, risk or best-business-location ranking. State links open matching HVAC startup and licensing guides.
- California: summer CDD +21.4%; earlier contractor employment -1.1%.
- Colorado: summer CDD +60.2%; earlier contractor employment -2.4%.
- Maine: summer CDD +21.4%; earlier contractor employment -0.6%.
- Massachusetts: summer CDD +5.7%; earlier contractor employment -0.7%.
- Oregon: summer CDD +2.8%; earlier contractor employment -5.0%.
- South Dakota: summer CDD +17.5%; earlier contractor employment -0.4%.
- Tennessee: summer CDD +8.7%; earlier contractor employment -0.6%.
- Utah: summer CDD +2.3%; earlier contractor employment -1.4%.
Find your state’s starting point
Colorado
Colorado recorded 527 summer cooling-degree days against a 329 normal. Its earlier average private contractor employment was about 27,655 versus 28,341 a year earlier. These are different periods and do not measure heat-caused job changes.
48-state cooling-weather and contractor-employment data
Compare all states, the above-normal cooling group or the smaller-job-baseline group. Employment is the average of the three monthly payroll counts in each quarter, across all occupations in private plumbing/heating/AC contractor establishments. Counts shown are rounded to whole jobs; calculations use the full averages.
48 states shown. Employment: Q1 2026 versus Q1 2025; weather: June–August 2026.
| State | Summer 2026 CDD | 1981–2010 summer normal | CDD departure | Q1 2025 average jobs* | Q1 2026 average jobs* | Earlier job change |
|---|---|---|---|---|---|---|
| Alabama | 1,376 | 1,271 | +8.3% | 18,641 | 19,071 | +2.3% |
| Arizona | 1,791 | 1,871 | -4.3% | 36,791 | 35,783 | -2.7% |
| Arkansas | 1,494 | 1,295 | +15.4% | 11,243 | 11,254 | +0.1% |
| California | 738 | 608 | +21.4% | 124,817 | 123,423 | -1.1% |
| Colorado | 527 | 329 | +60.2% | 28,341 | 27,655 | -2.4% |
| Connecticut | 571 | 528 | +8.1% | 12,592 | 12,717 | +1.0% |
| Delaware | 972 | 948 | +2.5% | 5,064 | 5,323 | +5.1% |
| Florida | 1,484 | 1,525 | -2.7% | 105,406 | 105,168 | -0.2% |
| Georgia | 1,323 | 1,190 | +11.2% | 37,622 | 38,909 | +3.4% |
| Idaho | 504 | 420 | +20.0% | 9,895 | 11,117 | +12.3% |
| Illinois | 778 | 721 | +7.9% | 39,175 | 40,255 | +2.8% |
| Indiana | 749 | 742 | +0.9% | 30,087 | 32,158 | +6.9% |
| Iowa | 748 | 665 | +12.5% | 15,356 | 16,942 | +10.3% |
| Kansas | 1,275 | 1,135 | +12.3% | 12,893 | 13,246 | +2.7% |
| Kentucky | 974 | 940 | +3.6% | 17,424 | 17,939 | +3.0% |
| Louisiana | 1,466 | 1,488 | -1.5% | 15,128 | 15,597 | +3.1% |
| Maine | 255 | 210 | +21.4% | 5,548 | 5,514 | -0.6% |
| Maryland | 1,058 | 967 | +9.4% | 30,583 | 30,925 | +1.1% |
| Massachusetts | 484 | 458 | +5.7% | 31,501 | 31,285 | -0.7% |
| Michigan | 525 | 482 | +8.9% | 32,106 | 33,271 | +3.6% |
| Minnesota | 460 | 382 | +20.4% | 21,458 | 22,078 | +2.9% |
| Mississippi | 1,562 | 1,362 | +14.7% | 8,250 | 8,589 | +4.1% |
| Missouri | 1,120 | 973 | +15.1% | 22,938 | 24,276 | +5.8% |
| Montana | 247 | 213 | +16.0% | 5,152 | 5,475 | +6.3% |
| Nebraska | 853 | 806 | +5.8% | 10,658 | 11,069 | +3.9% |
| Nevada | 1,655 | 1,407 | +17.6% | 15,785 | 16,626 | +5.3% |
| New Hampshire | 334 | 280 | +19.3% | 5,844 | 6,069 | +3.9% |
| New Jersey | 797 | 709 | +12.4% | 30,103 | 30,363 | +0.9% |
| New Mexico | 930 | 772 | +20.5% | 6,947 | 7,389 | +6.4% |
| New York | 536 | 552 | -2.9% | 67,378 | 66,919 | -0.7% |
| North Carolina | 1,253 | 1,101 | +13.8% | 49,104 | 50,935 | +3.7% |
| North Dakota | 380 | 355 | +7.0% | 3,741 | 3,951 | +5.6% |
| Ohio | 666 | 621 | +7.2% | 44,782 | 46,525 | +3.9% |
| Oklahoma | 1,630 | 1,382 | +17.9% | 15,847 | 16,419 | +3.6% |
| Oregon | 186 | 181 | +2.8% | 16,412 | 15,594 | -5.0% |
| Pennsylvania | 653 | 618 | +5.7% | 45,298 | 46,217 | +2.0% |
| Rhode Island | 550 | 507 | +8.5% | 4,505 | 4,625 | +2.7% |
| South Carolina | 1,443 | 1,283 | +12.5% | 17,801 | 18,618 | +4.6% |
| South Dakota | 690 | 587 | +17.5% | 4,457 | 4,439 | -0.4% |
| Tennessee | 1,115 | 1,026 | +8.7% | 28,833 | 28,671 | -0.6% |
| Texas | 1,761 | 1,597 | +10.3% | 118,411 | 123,122 | +4.0% |
| Utah | 666 | 651 | +2.3% | 17,345 | 17,105 | -1.4% |
| Vermont | 224 | 320 | -30.0% | 2,454 | 2,657 | +8.3% |
| Virginia | 1,029 | 873 | +17.9% | 35,980 | 36,797 | +2.3% |
| Washington | 142 | 148 | -4.1% | 29,425 | 29,408 | -0.1% |
| West Virginia | 714 | 651 | +9.7% | 4,038 | 4,283 | +6.1% |
| Wisconsin | 501 | 444 | +12.8% | 24,602 | 25,620 | +4.1% |
| Wyoming | 332 | 280 | +18.6% | 2,421 | 2,514 | +3.8% |
*PRIVATE plumbing/heating/AC contractors, NAICS 23822, all payroll occupations. Not HVAC-only technicians, full-time equivalents or unique people. State names link to existing HVAC business guides. Alaska, Hawaii and DC are outside this contiguous-state comparison; exclusion is not evidence of no heat or contractors there.
What this means for an HVAC business plan
If you are planning a Colorado HVAC operation, the featured state example, use Colorado HVAC insurance to budget crew and customer coverage. For a service vehicle or equipment purchase, compare Colorado business financing options.
Weather can inform seasonal planning, but these data cannot establish a profitable market, the number of new customers or an available workforce. Contractors need local service-booking evidence, current wages, licensing requirements and a staffing plan. Industry-wide payroll counts also cover construction, plumbing and non-technician roles.
Use the HVAC licensing and startup guides for practical state requirements, plumbing/HVAC industry statistics for establishment and payroll context, and state unemployment versus service-industry employment for a separate historical hiring comparison. For operating coverage, review HVAC contractor insurance; this study does not estimate insurance premiums or weather-related claims. For the heating season, see our winter heating fuel tracker.
Download charts and state data
- 48-state cooling-degree-day and contractor-employment data — CSV
- Eight-state comparison chart — PNG
- 48-state scatterplot — PNG
Reporters and publishers may reuse our original charts and aggregate analysis with attribution and a link to this study. Suggested citation: “StartBusinessByState.com, Summer 2026 Heat and Plumbing/HVAC Jobs by State, September 18, 2026; analysis of NOAA CPC and BLS QCEW.” Credit the underlying agencies separately. Agency data use does not imply endorsement.
Sources, methods and limitations
Weather period and reference. We retrieved NOAA CPC files on September 18, 2026. Summer covers all 92 days from June 1 through August 31. From the updated August 31 summary we subtract the corresponding year-to-date values in the May 31 summary. Normal cumulative totals are recovered as actual total minus departure from normal. Summer departure = summer actual − summer normal; percentage departure = (actual ÷ normal − 1) × 100. Each state has a positive summer normal of at least 100 CDD, so no tiny-normal/sentinel ratio is substituted. We use published integer CDD values and retain their source precision.
Product choice and checks. CPC documentation links this updated population-weighted series to 2010 population weights and 1981–2010 normals. The “legacy_files” folder names its ASCII format; we do not use the separate older CDUS product with 2000 weights/1971–2000 normals. Independent sums of the 92 published daily observations and corresponding daily normals matched the cumulative subtraction for all 48 states. These are CPC monitoring data, which can be revised; no record-ranking claim is calculated from this short series.
Employment period and scope. We retrieved Q1 2026 and Q1 2025 QCEW industry files. Q1 2026 was released August 28. Select private ownership 5, statewide five-digit aggregation 57, size code 0, NAICS 23822 and blank disclosure codes. Average employment = (January + February + March) ÷ 3; year-over-year change = (2026 average ÷ 2025 average − 1) × 100. No selected state cell is suppressed. Comparing the same quarter limits simple seasonal mismatches; it does not control every labor-market difference.
Job definitions. The QCEW coverage description includes full- and part-time payroll jobs and excludes proprietors and unincorporated self-employed workers. The industry encompasses plumbing, heating and AC contractors, including administrative, management and other roles. It is not a census of HVAC technicians, licensed contractors, small businesses alone or workers currently available for residential repairs. Net employment changes are not gross hiring counts.
Join, association and interpretation. We join state names/abbreviations to official BLS state identifiers, restricting the dataset to the 48 contiguous states. Weather and employment periods are deliberately separate. Pearson r uses each state once, unweighted; r = −0.064608. A rank-based sensitivity gives Spearman r = +0.157403. No p-value, statistical-significance or causal claim is made. These simple descriptive associations do not adjust for construction demand, plumbing share, wages, population, ownership, equipment, migration or industry composition. They cannot measure an employment response to later heat, current shortages, AC installations, sales, service waits, injuries or financial losses.
Common questions
Did summer heat cause contractor employment to fall?
This study cannot answer that. The employment period is January–March 2026 and the weather period is June–August. We compare an earlier job baseline with later cooling conditions, not a measured response to those conditions.
Does the jobs table count HVAC technicians?
No. It counts payroll employment across all occupations in private plumbing, heating and AC contractor establishments. Proprietors and unincorporated self-employed workers are excluded.
Why can some states have below-normal CDD during a record national summer?
National temperature records and state population-weighted cooling-degree days measure different things, with different weights, geographic aggregation and baselines. Neither national records nor degree days imply identical conditions everywhere.
Can these data identify a technician shortage or the best state to open a business?
No. Those conclusions would require additional evidence about current local demand, worker availability, licensing, service capacity and operating costs. This page reports transparent weather and employment comparisons without a shortage score.