Original research · FRED state unemployment ({ST}UR) × BLS QCEW private employment · Primary window 2024→2025 · Panel 2022–2025 · Published September 16, 2026
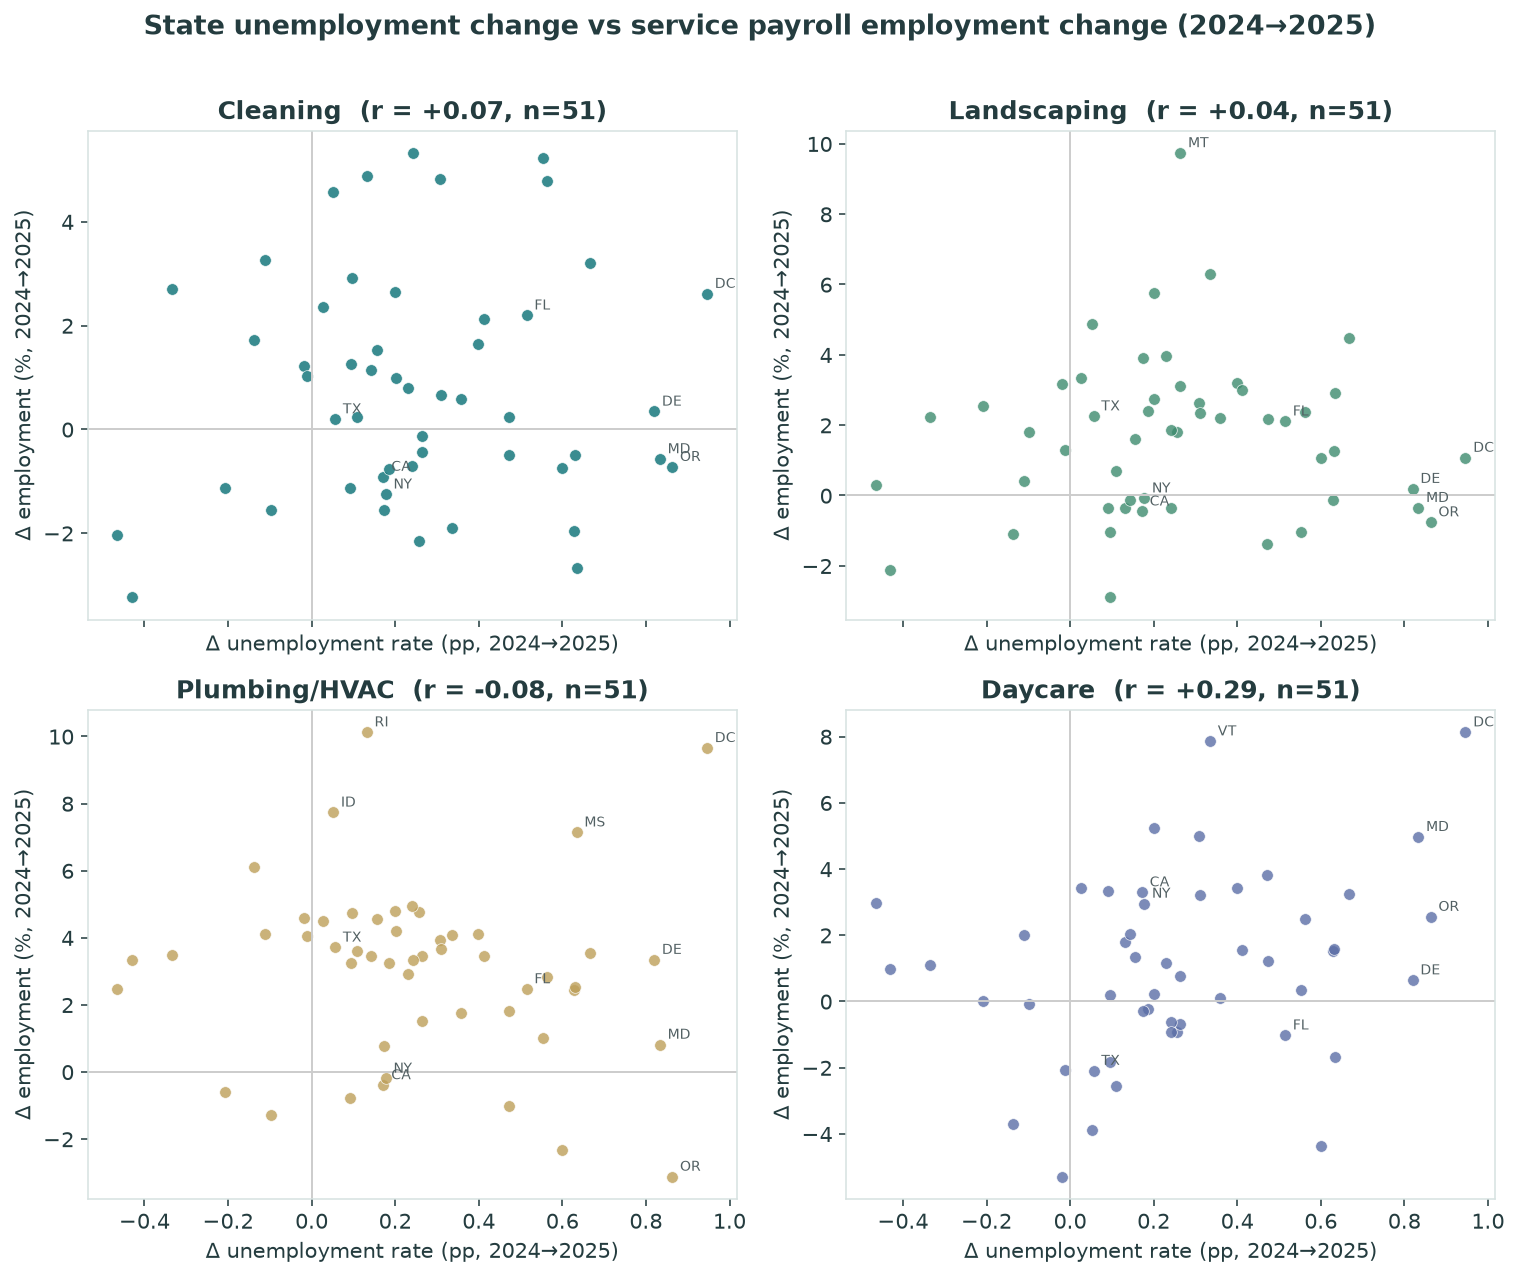
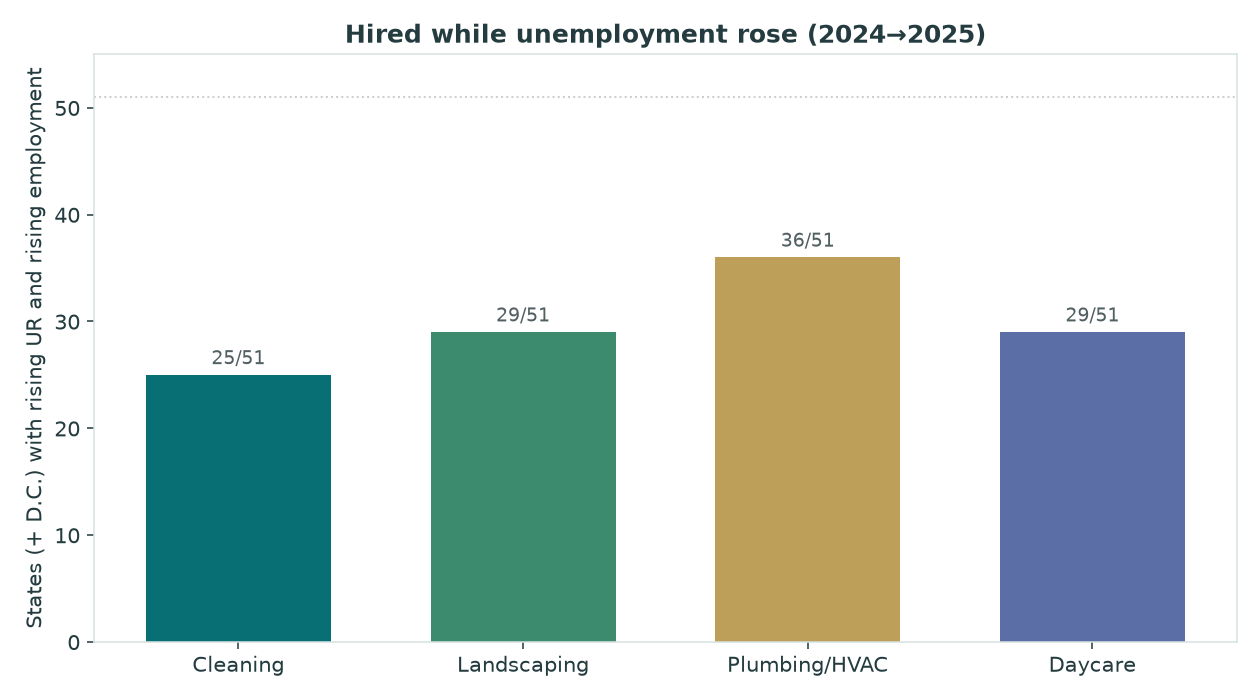
Service payroll hiring is not lockstep with state unemployment. Across cleaning, landscaping, plumbing/HVAC, and daycare, year-over-year changes in state unemployment rates barely track payroll employment changes (pooled Pearson |r| mostly under 0.10). In 2024→2025 alone, 36 of 51 jurisdictions added plumbing/HVAC jobs while unemployment rose — and cleaning, landscaping, and daycare each show dozens of the same “hired through a softer labor market” cases. This is a correlation check, not a claim that unemployment causes (or blocks) hiring, and not a best-state ranking.
Key findings
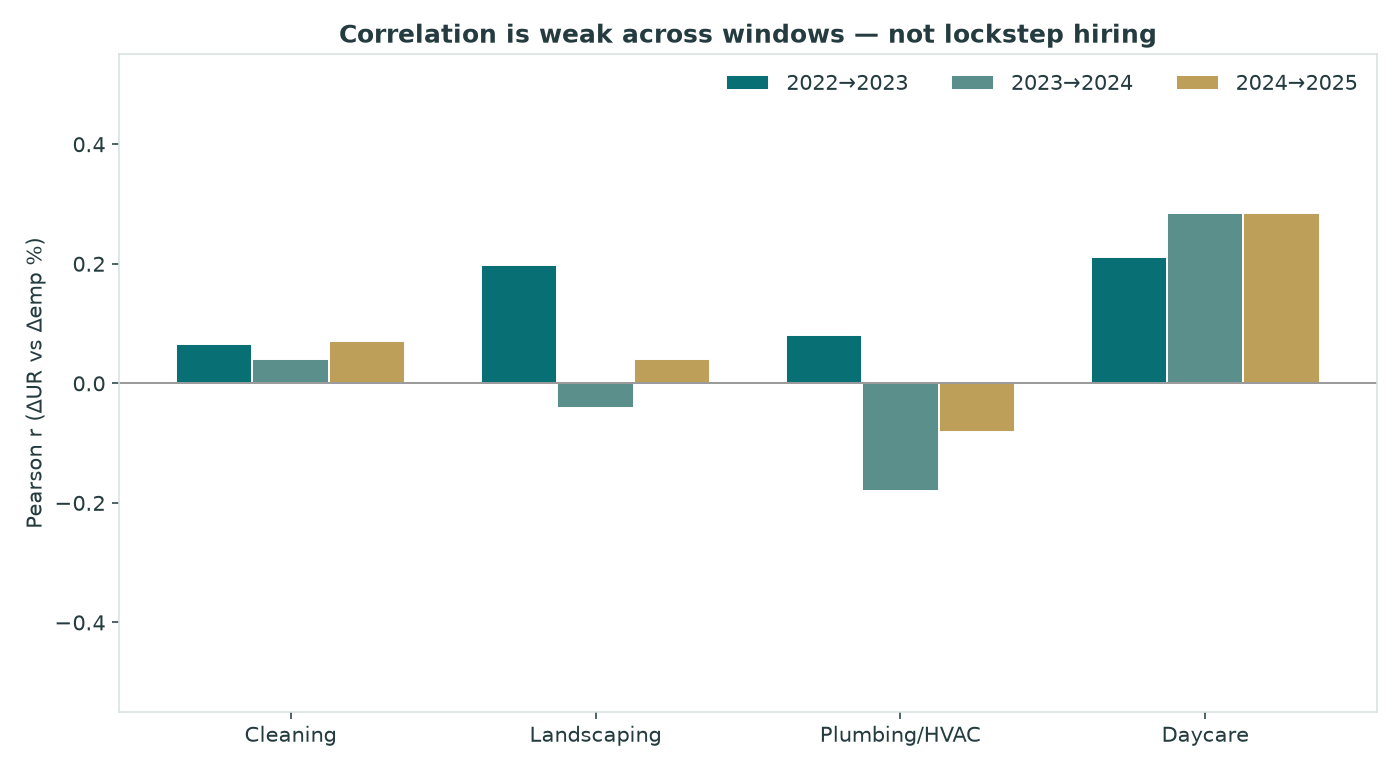
- Near-zero coupling in the 2022–2025 panel. Pooled correlations of Δ unemployment (pp) vs Δ employment (%): cleaning +0.03, landscaping -0.02, plumbing/HVAC -0.09, daycare -0.08 (n=153 state-years each). None look like tight inverse lockstep.
- 2024→2025 is the same story. Cleaning r=+0.07; landscaping r=+0.04; HVAC r=-0.08; daycare r=+0.29 (a mild positive association — not causation).
- Many states hired while unemployment rose: cleaning 25/51, landscaping 29/51, plumbing/HVAC 36/51, daycare 29/51.
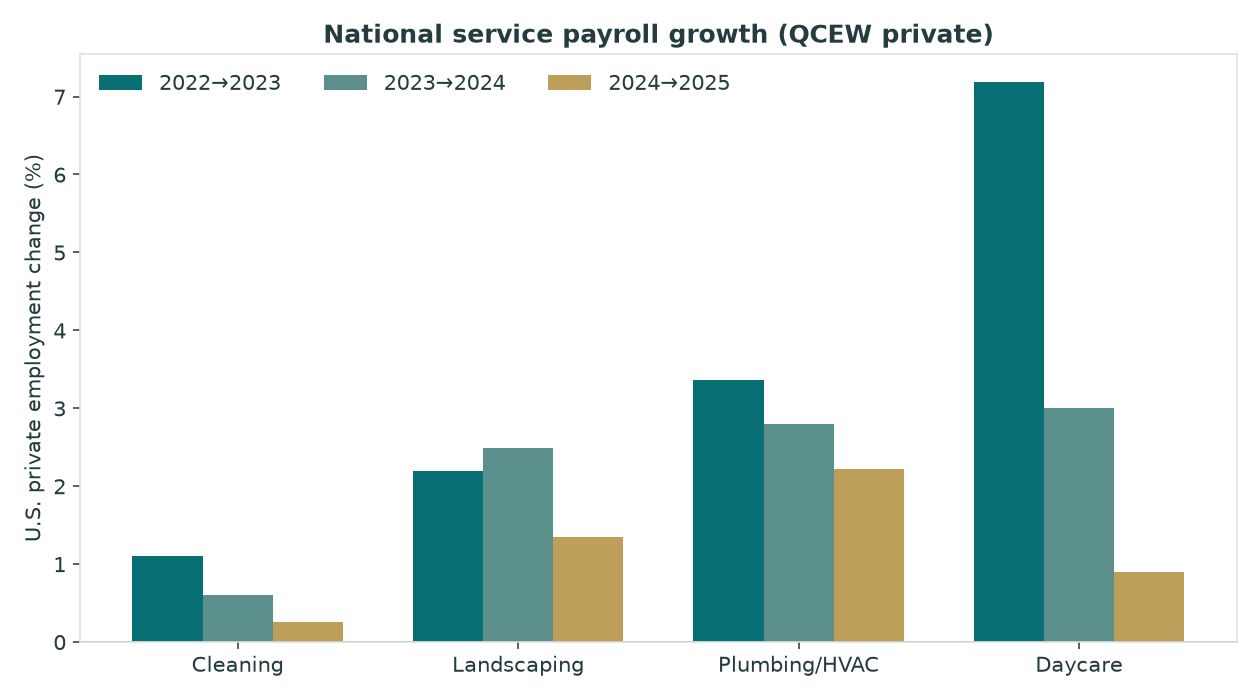
- National payroll still grew in 2024→2025: cleaning +0.3%, landscaping +1.3%, plumbing/HVAC +2.2%, daycare +0.9% (U.S. private QCEW).
- Hypothesis held. Soft labor markets and service hiring often coexist at the state level — distinct from pay levels and from within-year landscaping seasonality.
Correlations at a glance
| Industry | NAICS | r (2024→2025) | r (pooled) | Hired + rising UR | U.S. Δemp 2024→2025 |
|---|---|---|---|---|---|
| Cleaning | 561720 | +0.07 | +0.03 | 25/51 | +0.3% |
| Landscaping | 561730 | +0.04 | -0.02 | 29/51 | +1.3% |
| Plumbing/HVAC | 23822 | -0.08 | -0.09 | 36/51 | +2.2% |
| Daycare | 624410 | +0.29 | -0.08 | 29/51 | +0.9% |
How to read r: −1 would mean unemployment and payroll move as perfect opposites; 0 means no linear link. Values near zero mean state UR changes are a poor predictor of these industries’ hiring.
Charts
Hired despite rising unemployment
These are descriptive outliers — states where both unemployment and industry payroll employment rose in 2024→2025 — sorted by employment gain. Small bases can produce large percentages.
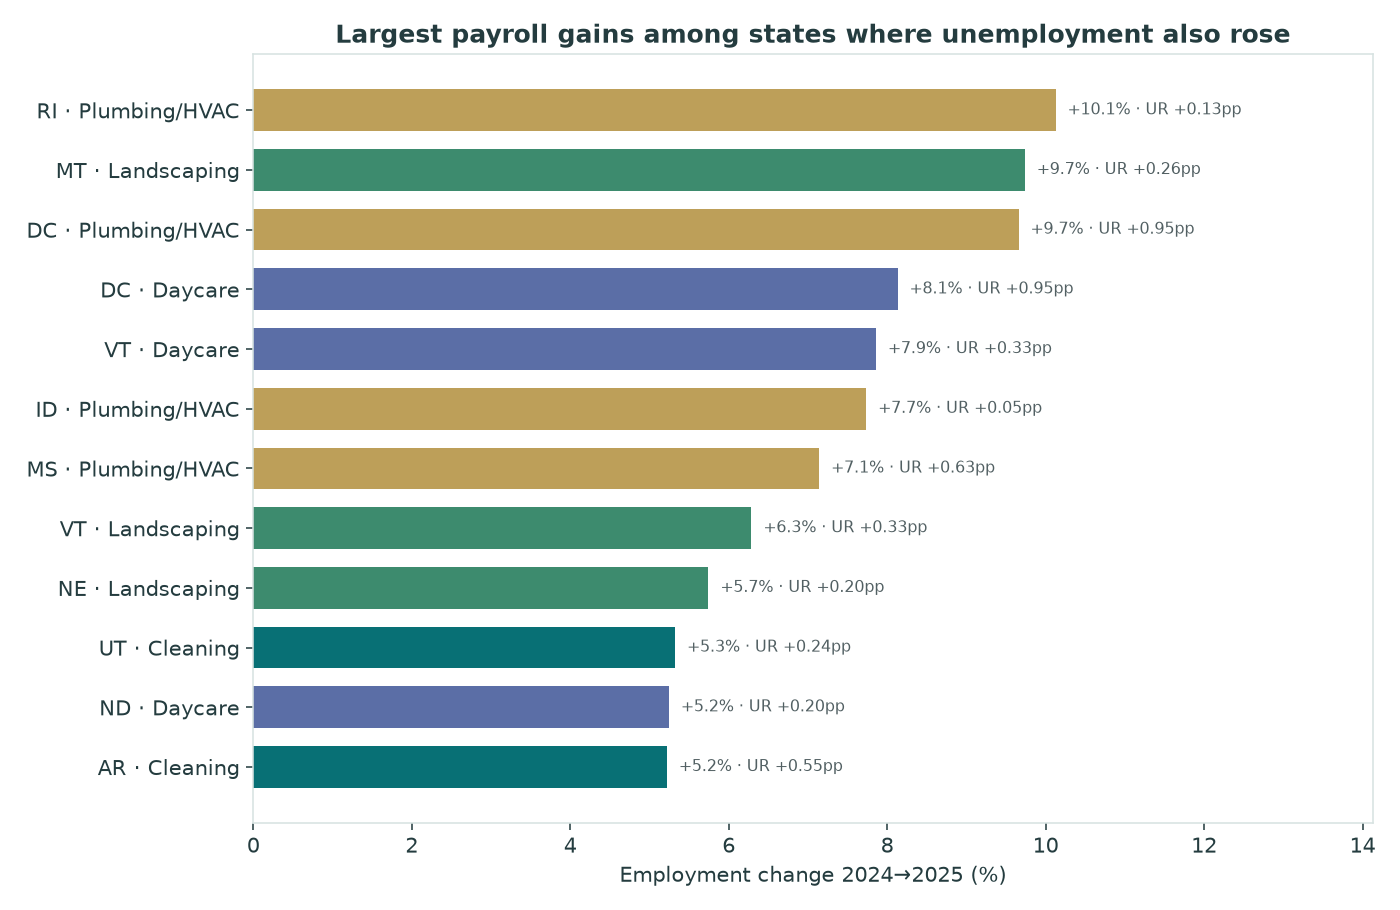
| State | Industry | Δ emp | Δ UR (pp) | Employment |
|---|---|---|---|---|
| Rhode Island | Plumbing/HVAC | +10.1% | +0.13 | 4,227 → 4,655 |
| Montana | Landscaping | +9.7% | +0.26 | 3,615 → 3,967 |
| District of Columbia | Plumbing/HVAC | +9.7% | +0.95 | 1,636 → 1,794 |
| District of Columbia | Daycare | +8.1% | +0.95 | 3,702 → 4,003 |
| Vermont | Daycare | +7.9% | +0.33 | 2,965 → 3,198 |
| Idaho | Plumbing/HVAC | +7.7% | +0.05 | 9,761 → 10,516 |
| Mississippi | Plumbing/HVAC | +7.1% | +0.63 | 8,038 → 8,612 |
| Vermont | Landscaping | +6.3% | +0.33 | 2,243 → 2,384 |
State table (2024→2025)
Unemployment rates are FRED calendar-year averages of monthly {ST}UR series (2025 uses published months only). Employment changes are QCEW private annual averages. State names link to state hubs.
| State | UR 2024 | UR 2025 | Δ UR (pp) | Δ cleaning % | Δ landscaping % | Δ HVAC % | Δ daycare % |
|---|---|---|---|---|---|---|---|
| District of Columbia | 5.31 | 6.25 | +0.95 | +2.6% | +1.1% | +9.7% | +8.1% |
| Oregon | 4.29 | 5.15 | +0.86 | -0.7% | -0.8% | -3.1% | +2.6% |
| Maryland | 3.17 | 4.00 | +0.83 | -0.6% | -0.4% | +0.8% | +5.0% |
| Delaware | 3.92 | 4.74 | +0.82 | +0.3% | +0.2% | +3.3% | +0.6% |
| Minnesota | 3.13 | 3.80 | +0.67 | +3.2% | +4.5% | +3.6% | +3.3% |
| Mississippi | 3.18 | 3.81 | +0.63 | -2.7% | +2.9% | +7.1% | -1.7% |
| New Jersey | 4.64 | 5.27 | +0.63 | -0.5% | +1.3% | +2.5% | +1.6% |
| Connecticut | 3.31 | 3.94 | +0.63 | -2.0% | -0.1% | +2.5% | +1.5% |
| Arizona | 3.70 | 4.30 | +0.60 | -0.7% | +1.1% | -2.3% | -4.4% |
| New Hampshire | 2.58 | 3.15 | +0.56 | +4.8% | +2.4% | +2.8% | +2.5% |
| Arkansas | 3.49 | 4.05 | +0.55 | +5.2% | -1.0% | +1.0% | +0.4% |
| Florida | 3.36 | 3.87 | +0.51 | +2.2% | +2.1% | +2.5% | -1.0% |
| Pennsylvania | 3.81 | 4.28 | +0.47 | +0.2% | +2.2% | +1.8% | +1.2% |
| Massachusetts | 3.98 | 4.45 | +0.47 | -0.5% | -1.4% | -1.0% | +3.8% |
| Virginia | 2.93 | 3.34 | +0.41 | +2.1% | +3.0% | +3.4% | +1.6% |
| Michigan | 4.68 | 5.08 | +0.40 | +1.6% | +3.2% | +4.1% | +3.4% |
| Iowa | 3.14 | 3.50 | +0.36 | +0.6% | +2.2% | +1.8% | +0.1% |
| Vermont | 2.28 | 2.62 | +0.33 | -1.9% | +6.3% | +4.1% | +7.9% |
| South Carolina | 4.11 | 4.42 | +0.31 | +0.7% | +2.4% | +3.7% | +3.2% |
| Maine | 2.99 | 3.30 | +0.31 | +4.8% | +2.6% | +3.9% | +5.0% |
| Missouri | 3.70 | 3.96 | +0.26 | -0.1% | +3.1% | +1.5% | -0.7% |
| Montana | 3.00 | 3.26 | +0.26 | -0.4% | +9.7% | +3.5% | +0.8% |
| Kansas | 3.52 | 3.77 | +0.26 | -2.2% | +1.8% | +4.8% | -0.9% |
| Utah | 3.27 | 3.51 | +0.24 | +5.3% | -0.4% | +3.3% | -0.9% |
| Ohio | 4.35 | 4.59 | +0.24 | -0.7% | +1.9% | +4.9% | -0.6% |
| South Dakota | 1.82 | 2.05 | +0.23 | +0.8% | +4.0% | +2.9% | +1.1% |
| Nebraska | 2.72 | 2.92 | +0.20 | +1.0% | +5.7% | +4.2% | +0.2% |
| North Dakota | 2.40 | 2.60 | +0.20 | +2.6% | +2.7% | +4.8% | +5.2% |
| North Carolina | 3.64 | 3.83 | +0.19 | -0.8% | +2.4% | +3.2% | -0.2% |
| New York | 4.15 | 4.33 | +0.18 | -1.3% | -0.1% | -0.2% | +3.0% |
| Wyoming | 3.12 | 3.29 | +0.17 | -1.6% | +3.9% | +0.8% | -0.3% |
| California | 5.29 | 5.46 | +0.17 | -0.9% | -0.5% | -0.4% | +3.3% |
| Wisconsin | 3.01 | 3.16 | +0.16 | +1.5% | +1.6% | +4.6% | +1.3% |
| Tennessee | 3.38 | 3.52 | +0.14 | +1.1% | -0.1% | +3.5% | +2.1% |
| Rhode Island | 4.25 | 4.38 | +0.13 | +4.9% | -0.4% | +10.1% | +1.8% |
| Oklahoma | 3.20 | 3.31 | +0.11 | +0.2% | +0.7% | +3.6% | -2.6% |
| West Virginia | 4.05 | 4.15 | +0.10 | +2.9% | -1.0% | +4.7% | +0.2% |
| Alaska | 4.54 | 4.64 | +0.09 | +1.3% | -2.9% | +3.3% | -1.8% |
| Washington | 4.50 | 4.59 | +0.09 | -1.1% | -0.4% | -0.8% | +3.3% |
| Texas | 4.12 | 4.17 | +0.06 | +0.2% | +2.3% | +3.7% | -2.1% |
| Idaho | 3.57 | 3.62 | +0.05 | +4.6% | +4.9% | +7.7% | -3.9% |
| New Mexico | 4.09 | 4.12 | +0.03 | +2.3% | +3.3% | +4.5% | +3.4% |
| Louisiana | 4.27 | 4.26 | -0.01 | +1.0% | +1.3% | +4.0% | -2.1% |
| Georgia | 3.40 | 3.38 | -0.02 | +1.2% | +3.2% | +4.6% | -5.3% |
| Colorado | 4.12 | 4.03 | -0.10 | -1.6% | +1.8% | -1.3% | -0.1% |
| Alabama | 2.98 | 2.87 | -0.11 | +3.3% | +0.4% | +4.1% | +2.0% |
| Nevada | 5.39 | 5.25 | -0.14 | +1.7% | -1.1% | +6.1% | -3.7% |
| Kentucky | 4.82 | 4.61 | -0.21 | -1.1% | +2.5% | -0.6% | +0.0% |
| Indiana | 4.02 | 3.69 | -0.33 | +2.7% | +2.2% | +3.5% | +1.1% |
| Hawaii | 2.77 | 2.34 | -0.43 | -3.2% | -2.1% | +3.3% | +1.0% |
| Illinois | 4.98 | 4.52 | -0.47 | -2.0% | +0.3% | +2.5% | +3.0% |
Related research on this site
Our summer 2026 heat versus earlier plumbing/HVAC employment comparison pairs NOAA cooling-degree days with a pre-summer BLS baseline across 48 states. Its descriptive correlations do not establish causation, hiring flows or technician shortages.
- Service employer pay by state — annual QCEW pay levels and employees per establishment (not YoY hiring vs unemployment).
- Partnership ordinary income by state — IRS SOI Form 1065 ordinary income by state × 3-digit industry (not payroll hiring).
- Wages by state — OEWS occupation wage levels.
- Landscaping seasonal employment by state — within-year quarterly swing for NAICS 561730.
- Home prices vs home-services employment — FRED/FHFA Δ house prices vs landscaping and plumbing/HVAC payroll (another correlation check, not unemployment).
- Industry stats hubs: cleaning, landscaping, HVAC, daycare.
- Business formation statistics and business survival rates by state — startup/exit context, not payroll hiring.
- Personal income vs business formation — BEA SAINC1 income growth vs Census BFS applications (correlation check, not causation).
- Guides: cleaning, landscaping, HVAC, daycare.
Methods and limitations
Data sources and period matching
Unemployment: FRED monthly series {ST}UR for all 50 states + D.C. (51 series). Calendar-year average of published monthly values. For 2025, most states have 11 published months (one month often missing as .); averages use available months only.
Employment: BLS QCEW annual open CSV slices, private ownership, NAICS 561720 (janitorial), 561730 (landscaping), 23822 (plumbing & HVAC contractors — 5-digit rollup after the 2022 split of former 238220), 624410 (child day care). Years 2022–2025 fetched 2026-09-16.
Matching: Same calendar years for UR and employment — no intentional lag. Primary window 2024→2025; robustness windows 2022→2023 and 2023→2024. Suppressions (N) are never treated as zero; this pull had zero state×industry suppressions for these cells.
Limitations
- Correlation ≠ causation. Demographics, migration, weather, housing, and industry mix all affect hiring.
- QCEW is UI-covered payroll only — most nonemployers sit outside this frame.
- Plumbing/HVAC cannot be split to HVAC-only at state grain in current QCEW.
- 2025 FRED averages are slightly incomplete vs a full 12-month year; QCEW annual vintages can revise.
- Not a best-state score, wage study, or seasonal-amplitude study.
Hypothesis
We hypothesized that service hiring is not lockstep with state unemployment. The weak correlations and large “hired while UR rose” counts support that framing.
Download
Download CSV — unemployment vs service hiring by state (2024→2025). Columns include UR levels, ΔUR (pp), and employment levels/% changes for cleaning, landscaping, plumbing/HVAC, and daycare.
Primary sources: FRED; BLS QCEW.