Original research · BLS Job Openings and Labor Turnover Survey (JOLTS) · State total nonfarm rates · Vintage December 2025 (seasonally adjusted) · U.S. national series also available through 2026-07 · Published September 22, 2026
Labor markets are not equally tight. In December 2025, U.S. total nonfarm employers faced 1.1 unemployed persons per job opening, with a 4.0% openings rate, 3.3% hires rate, and 2.0% quits rate. Across states and D.C., unemployed-per-opening ranged from South Dakota 0.5 (tightest) to Washington 1.8 (loosest). This page ranks statewide labor-market tightness for service employers hiring staff — not landscaping- or cleaning-specific JOLTS (BLS does not publish state×industry JOLTS).
Using hiring software that ranks or screens applicants? A few states now have rules for that. See AI in hiring laws by state.
Key stats (December 2025, total nonfarm)
- U.S. tightness: 1.1 unemployed per opening · openings rate 4.0% · hires 3.3% · quits 2.0% · openings÷hires 1.21.
- State median unemployed-per-opening: 1.00; median openings rate 4.0%.
- Tightest (lowest UOR): South Dakota (0.5), North Dakota (0.6), Alabama (0.7), Georgia (0.7), Oklahoma (0.7).
- Loosest (highest UOR): New Jersey (1.5), California (1.6), Oregon (1.6), Nevada (1.7), Washington (1.8).
- Highest openings rates: West Virginia 5.5%, Georgia 5.3%, Oklahoma 5.3%.
- Highest quits rates: South Dakota 3.4%, Indiana 3.2%, Alaska 3.0% — worker-side churn signal, not the same as establishment openings/closings.
Distinct from companion pages on this site:
- Unemployment × service hiring ≠ JOLTS tightness. Unemployment vs service hiring by state correlates FRED unemployment with QCEW service-industry employment change. This page uses JOLTS openings, hires, and quits rates plus unemployed-per-opening.
- Occupation wages ≠ vacancy pressure. Wages by state (OEWS) prices occupations. Tightness here is about openings and turnover rates, not dollars per hour.
- Establishment churn ≠ labor turnover. Service business openings, closings, and churn is BED establishment flows. JOLTS quits/hires are worker flows inside operating employers.
- Industry pay ≠ openings. Service employer pay by state is QCEW average pay / location size — not vacancy or quit rates.
Critical data limit: BLS JOLTS state estimates are total nonfarm only. There is no official state×industry JOLTS table for landscaping, cleaning, daycare, HVAC, or salons. Treat these ranks as statewide labor-market context; pair with QCEW and OEWS for industry and occupation detail.
Map & charts


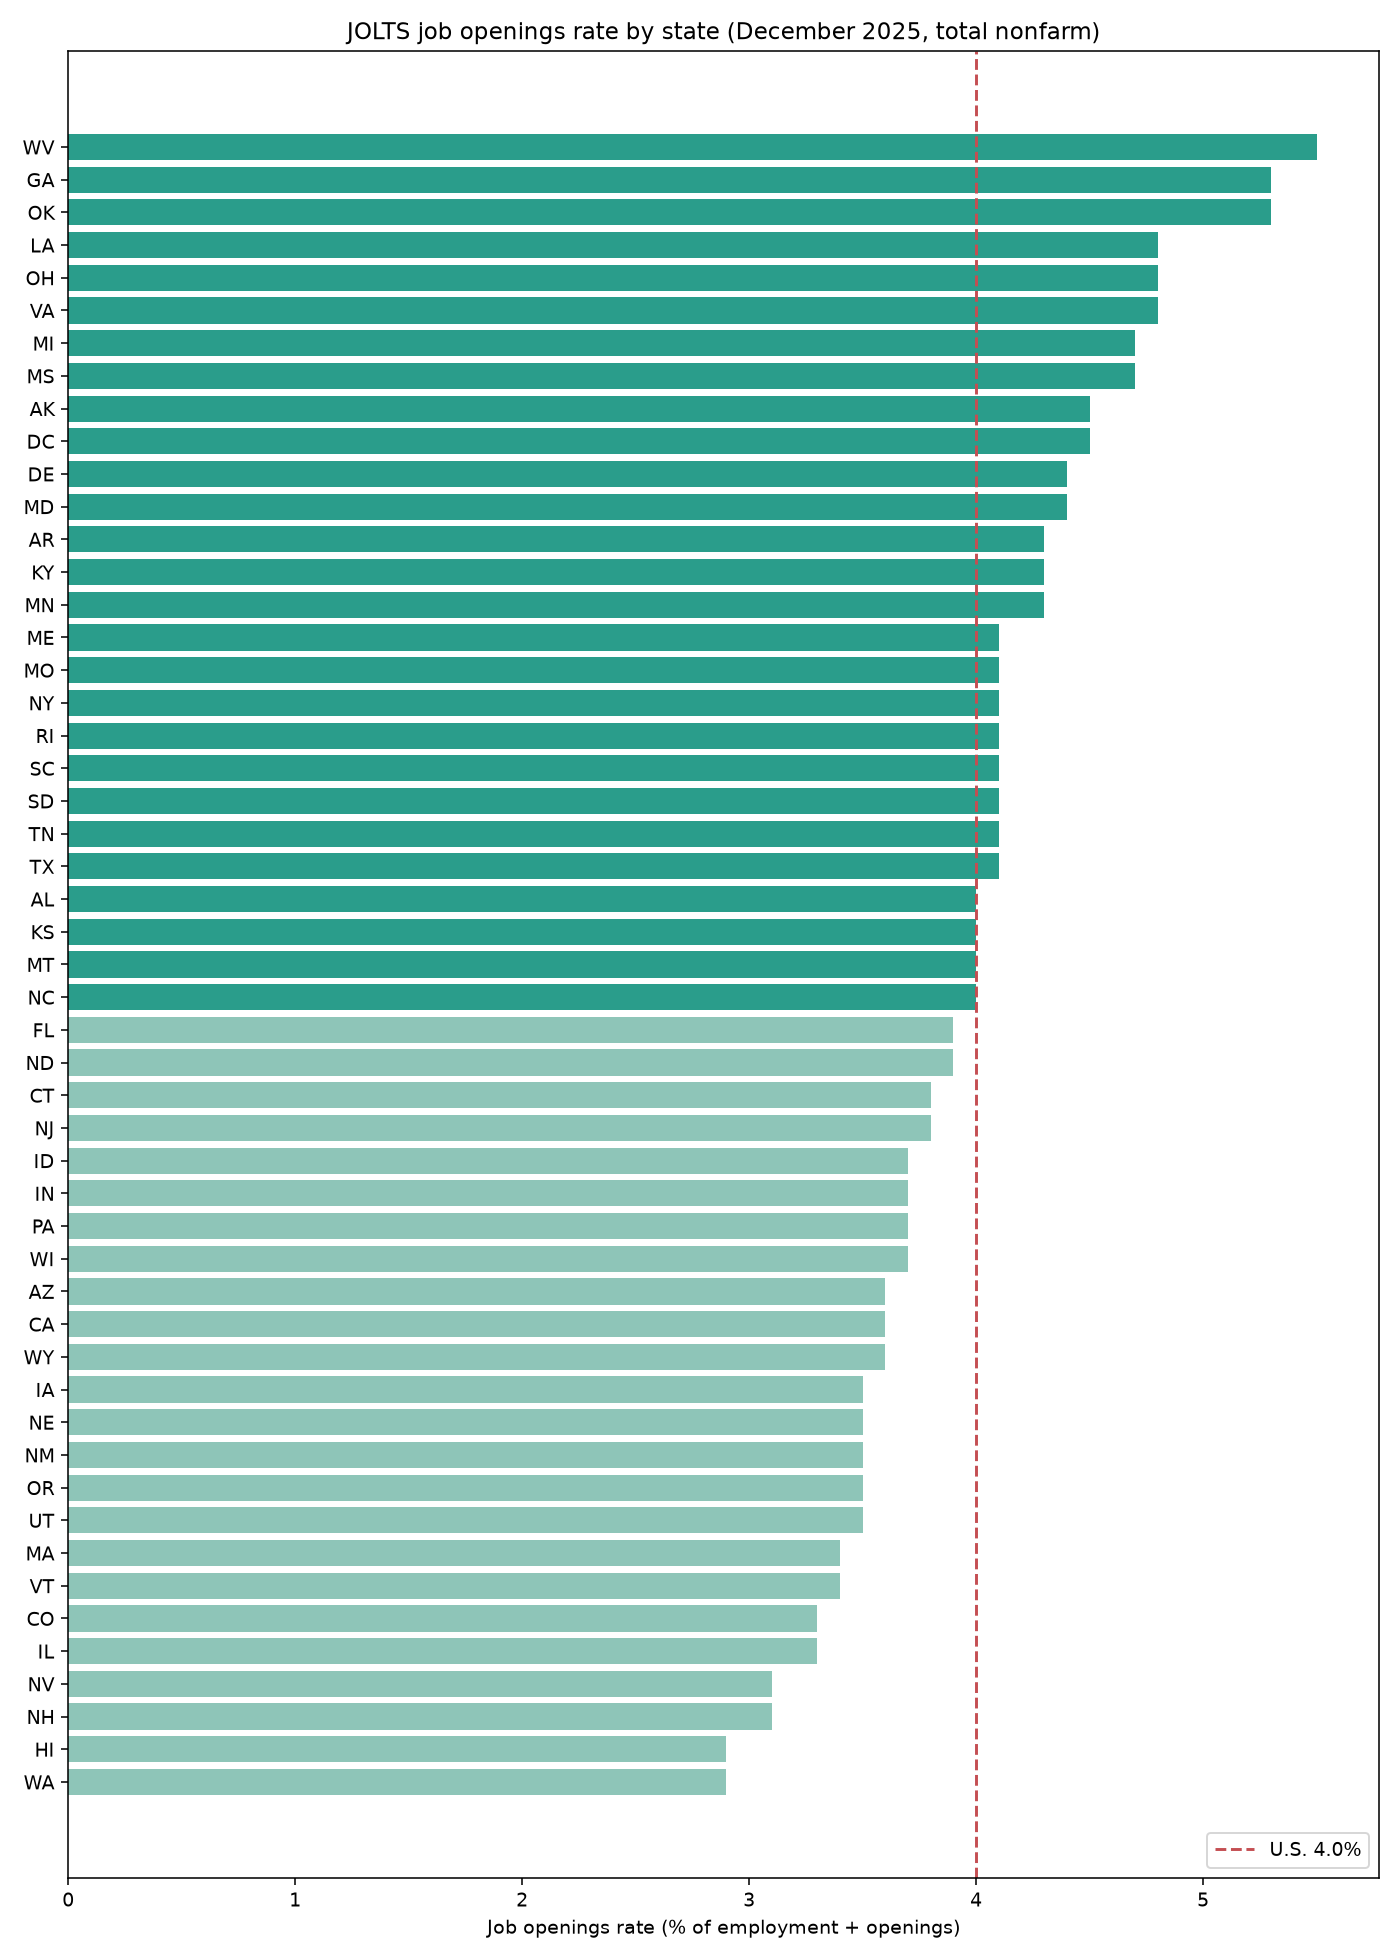
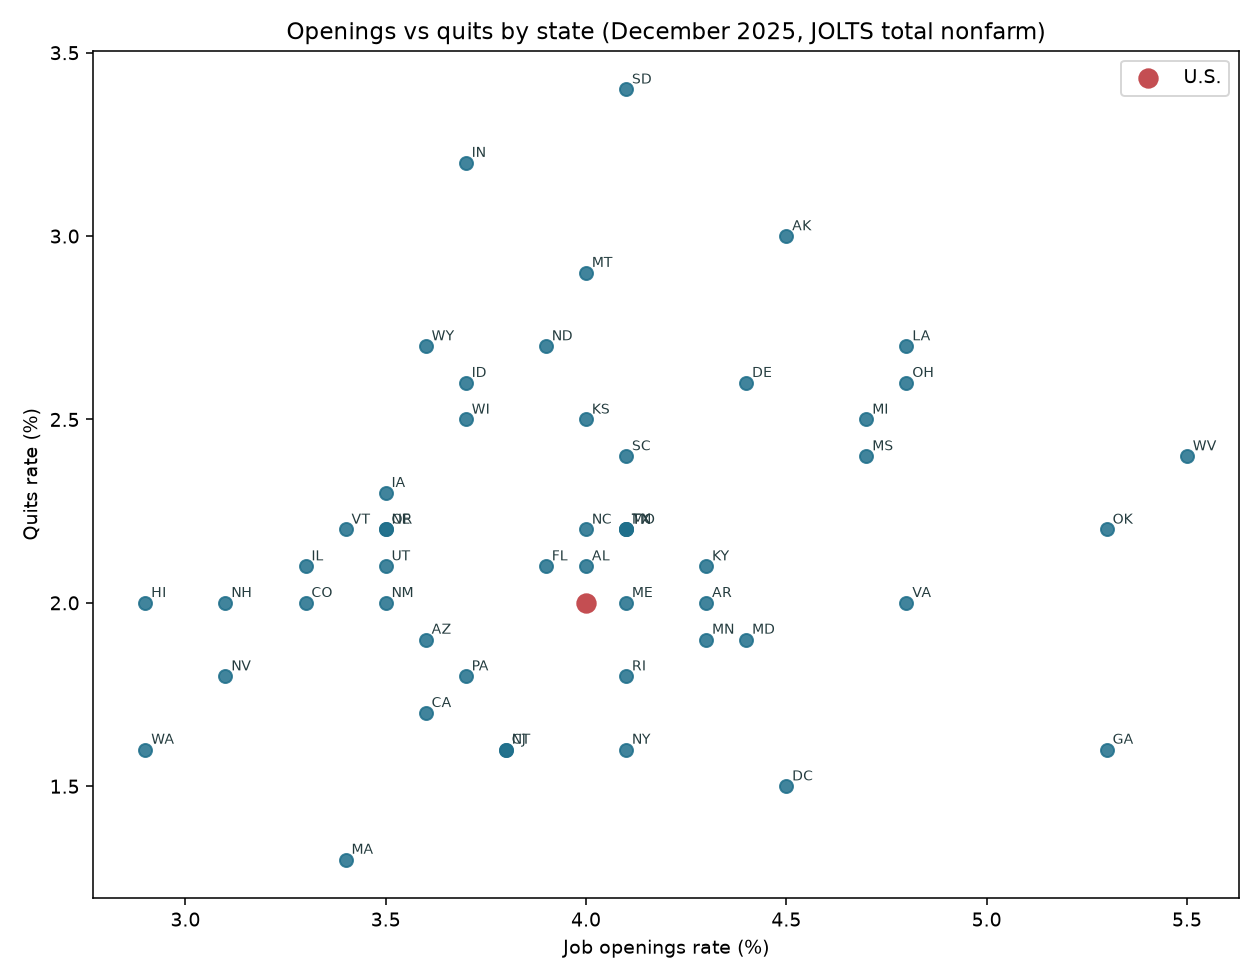

Ranked state table
Primary sort: unemployed per job opening (rank 1 = tightest). Rates are seasonally adjusted total nonfarm. State names link to state startup hubs.
| Tightness rank | State | Unemployed / opening | Openings rate % | Hires rate % | Quits rate % | Openings/hires | Openings rank |
|---|---|---|---|---|---|---|---|
| — | United States | 1.10 | 4.0 | 3.3 | 2.0 | 1.21 | — |
| 1 | South Dakota | 0.50 | 4.1 | 3.6 | 3.4 | 1.14 | 21 |
| 2 | North Dakota | 0.60 | 3.9 | 4.0 | 2.7 | 0.97 | 29 |
| 3 | Alabama | 0.70 | 4.0 | 3.3 | 2.1 | 1.21 | 24 |
| 4 | Georgia | 0.70 | 5.3 | 2.8 | 1.6 | 1.89 | 2 |
| 5 | Oklahoma | 0.70 | 5.3 | 3.9 | 2.2 | 1.36 | 3 |
| 6 | District of Columbia | 0.80 | 4.5 | 2.6 | 1.5 | 1.73 | 10 |
| 7 | Hawaii | 0.80 | 2.9 | 2.8 | 2.0 | 1.04 | 50 |
| 8 | Maine | 0.80 | 4.1 | 3.0 | 2.0 | 1.37 | 16 |
| 9 | Mississippi | 0.80 | 4.7 | 3.9 | 2.4 | 1.21 | 8 |
| 10 | Vermont | 0.80 | 3.4 | 2.9 | 2.2 | 1.17 | 45 |
| 11 | Virginia | 0.80 | 4.8 | 3.1 | 2.0 | 1.55 | 6 |
| 12 | Louisiana | 0.90 | 4.8 | 3.9 | 2.7 | 1.23 | 4 |
| 13 | Montana | 0.90 | 4.0 | 4.0 | 2.9 | 1.00 | 26 |
| 14 | Nebraska | 0.90 | 3.5 | 3.0 | 2.2 | 1.17 | 40 |
| 15 | Ohio | 0.90 | 4.8 | 3.2 | 2.6 | 1.50 | 5 |
| 16 | Tennessee | 0.90 | 4.1 | 3.6 | 2.2 | 1.14 | 22 |
| 17 | West Virginia | 0.90 | 5.5 | 4.0 | 2.4 | 1.38 | 1 |
| 18 | Wisconsin | 0.90 | 3.7 | 3.4 | 2.5 | 1.09 | 35 |
| 19 | Wyoming | 0.90 | 3.6 | 3.7 | 2.7 | 0.97 | 38 |
| 20 | Arkansas | 1.00 | 4.3 | 3.4 | 2.0 | 1.26 | 13 |
| 21 | Indiana | 1.00 | 3.7 | 3.5 | 3.2 | 1.06 | 33 |
| 22 | Kansas | 1.00 | 4.0 | 3.3 | 2.5 | 1.21 | 25 |
| 23 | Kentucky | 1.00 | 4.3 | 3.4 | 2.1 | 1.26 | 14 |
| 24 | Minnesota | 1.00 | 4.3 | 2.9 | 1.9 | 1.48 | 15 |
| 25 | Missouri | 1.00 | 4.1 | 3.2 | 2.2 | 1.28 | 17 |
| 26 | North Carolina | 1.00 | 4.0 | 3.2 | 2.2 | 1.25 | 27 |
| 27 | Alaska | 1.10 | 4.5 | 4.2 | 3.0 | 1.07 | 9 |
| 28 | Idaho | 1.10 | 3.7 | 3.9 | 2.6 | 0.95 | 32 |
| 29 | Iowa | 1.10 | 3.5 | 3.2 | 2.3 | 1.09 | 39 |
| 30 | Maryland | 1.10 | 4.4 | 3.2 | 1.9 | 1.38 | 12 |
| 31 | Michigan | 1.10 | 4.7 | 3.8 | 2.5 | 1.24 | 7 |
| 32 | New Hampshire | 1.10 | 3.1 | 2.4 | 2.0 | 1.29 | 49 |
| 33 | New York | 1.10 | 4.1 | 3.3 | 1.6 | 1.24 | 18 |
| 34 | Texas | 1.10 | 4.1 | 3.5 | 2.2 | 1.17 | 23 |
| 35 | Utah | 1.10 | 3.5 | 3.5 | 2.1 | 1.00 | 43 |
| 36 | Connecticut | 1.20 | 3.8 | 3.6 | 1.6 | 1.06 | 30 |
| 37 | Delaware | 1.20 | 4.4 | 3.6 | 2.6 | 1.22 | 11 |
| 38 | Florida | 1.20 | 3.9 | 3.1 | 2.1 | 1.26 | 28 |
| 39 | Pennsylvania | 1.20 | 3.7 | 3.0 | 1.8 | 1.23 | 34 |
| 40 | Rhode Island | 1.20 | 4.1 | 3.9 | 1.8 | 1.05 | 19 |
| 41 | South Carolina | 1.20 | 4.1 | 4.4 | 2.4 | 0.93 | 20 |
| 42 | Colorado | 1.30 | 3.3 | 2.9 | 2.0 | 1.14 | 46 |
| 43 | New Mexico | 1.30 | 3.5 | 3.3 | 2.0 | 1.06 | 41 |
| 44 | Arizona | 1.40 | 3.6 | 3.9 | 1.9 | 0.92 | 36 |
| 45 | Massachusetts | 1.40 | 3.4 | 2.7 | 1.3 | 1.26 | 44 |
| 46 | Illinois | 1.50 | 3.3 | 3.7 | 2.1 | 0.89 | 47 |
| 47 | New Jersey | 1.50 | 3.8 | 3.4 | 1.6 | 1.12 | 31 |
| 48 | California | 1.60 | 3.6 | 3.2 | 1.7 | 1.12 | 37 |
| 49 | Oregon | 1.60 | 3.5 | 3.5 | 2.2 | 1.00 | 42 |
| 50 | Nevada | 1.70 | 3.1 | 4.0 | 1.8 | 0.78 | 48 |
| 51 | Washington | 1.80 | 2.9 | 3.1 | 1.6 | 0.94 | 51 |
Not a best-state score. A tight labor market can mean harder hiring and higher wage pressure; a looser market can mean easier recruiting but weaker local demand. Pair with wages, pay, formation, and survival research — not this table alone.
Hiring pressure does not change how you register an entity. If you want help with paperwork, ZenBusiness can file an LLC for $0 plus the state fee, in any state. Affiliate link — we may earn a commission at no extra cost to you.
Related research
- Unemployment vs service hiring by state — FRED UR × QCEW service employment change.
- Service occupation wages by state — OEWS medians.
- Service employer pay by state — QCEW average pay / location size.
- Service business openings, closings, and churn — BED establishment flows.
- Best states to start a business · Business formation statistics.
- Trade jobs vs. tech jobs since ChatGPT — which job types employers are posting most (Indeed), from construction and engineering to software.
- Industry hubs: cleaning, landscaping, HVAC, daycare, salon.
Methodology & caveats
Source: BLS Job Openings and Labor Turnover Survey (JOLTS) via the BLS Public Data API. Series pattern JTS000000{state_fips}0000000{JO|HI|QU|UO}R — seasonally adjusted rates for total nonfarm. Geography: United States + 50 states + District of Columbia.
Primary tightness metric: unemployed persons per job opening (element UO, rate). Lower = tighter. Secondary proxy: openings_over_hires = job openings rate / hires rate. Higher = openings outpace hiring flow. We also publish openings, hires, and quits rates for context.
Vintage: latest month with complete state data across all four rate series is December 2025. National JOLTS often publishes a newer month (2026-07); state estimates lag. Figures here use the common state month so ranks are comparable.
Limits: State JOLTS is total nonfarm only — not state×industry. Rates, not levels, are used for ranking. Seasonally adjusted. Preliminary footnotes may appear on the newest months. Not legal, tax, HR, or investment advice. Not a best-state ranking.
Frequently asked questions
What does unemployed per job opening mean?
BLS divides the number of unemployed persons by the number of job openings. A value of 1.0 means roughly one unemployed person per opening. Values below 1.0 indicate fewer seekers than openings (tighter).
Why can I not see landscaping or cleaning JOLTS by state?
BLS does not publish JOLTS as state×industry. State tables are total nonfarm. For industry employment and pay, use QCEW; for occupation wages, use OEWS.
Is a high openings rate always good for a new employer?
No. High openings can signal unmet demand for workers (harder hiring, wage pressure). Soft demand can show up as lower openings and quits. Read openings with hires, quits, and local industry data.
How is openings/hires different from unemployed-per-opening?
Unemployed-per-opening compares seekers to vacancies. Openings/hires compares the stock of vacancies to the flow of hires — useful when unemployment is similar but hiring is slow relative to openings.
Why December 2025 when national news cites a later month?
State JOLTS estimates often lag the national release. We use the latest month where all 51 jurisdictions have complete openings, hires, quits, and UOR rates.
Does this tell me where to start a cleaning or HVAC company?
No. It frames statewide hiring conditions. Combine with industry pay, wages, formation, survival, and local licensing — and treat this as context, not a site-selection score.
Sources & how to cite
| Source | What we used | Link |
|---|---|---|
| BLS JOLTS | Seasonally adjusted state + U.S. total nonfarm rates: job openings (JOR), hires (HIR), quits (QUR), unemployed per opening (UOR); December 2025 | JOLTS · state news release |
| BLS Public API | Series pull JTS000000{fips}0000000{elem}R; registration key redacted in fetch-meta |
Developers |
| This page | Derived ranks, openings/hires, map, charts, CSV | Canonical URL |
Suggested citation: StartBusinessByState.com, “Labor-Market Tightness by State — JOLTS Job Openings, Hires, and Quits (December 2025),” published September 22, 2026, https://startbusinessbystate.com/jolts-labor-tightness-by-state/.
Download
Download the state CSV (openings, hires, quits, UOR, openings/hires, ranks, series IDs). Cite with a link to this page.
Dataset license and reuse
Reuse terms, version September 27, 2026. You may quote our original findings and summary statistics with credit to StartBusinessByState.com and a link to this page. Keep the source names, data years, units and relevant limitations with quoted figures.
This permission covers our original contributions to this dataset. It does not relicense underlying source data or grant blanket permission to redistribute third-party datasets. Source data retains its provider’s terms, and public-domain material remains public domain. Any additional reuse permissions stated elsewhere on this page still apply. For other reuse of our original material, contact us.