Census American Community Survey 2020-2024 · ICE arrest records via the Deportation Data Project (through Aug. 5, 2026) · NFIB September 2026 · Last updated October 2, 2026
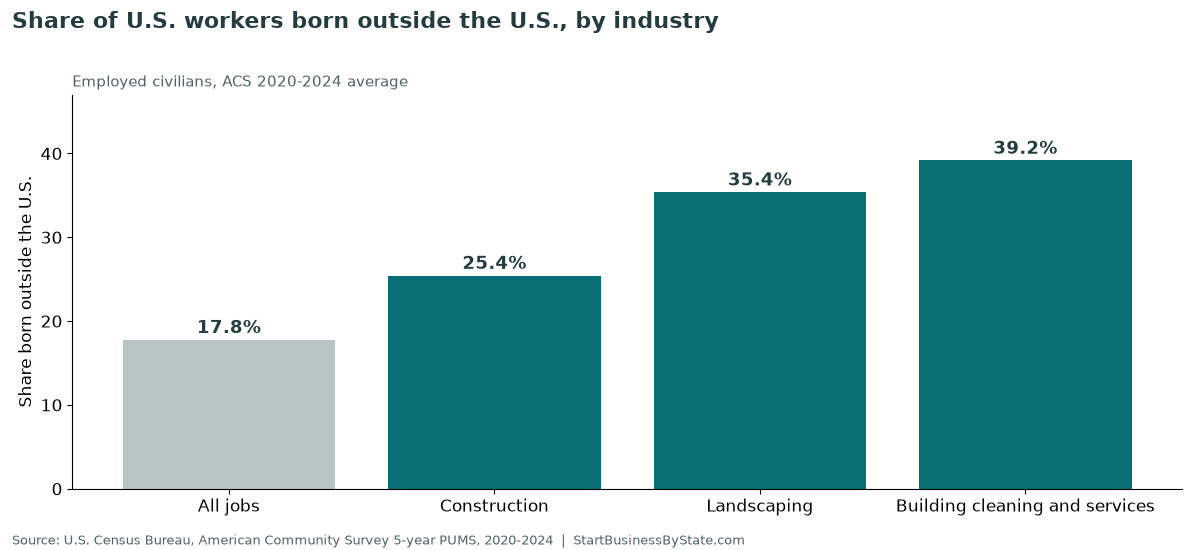
About 25% of U.S. construction workers, 35% of landscaping workers and 39% of building cleaning and services workers were born outside the U.S. For all jobs the share is 18%. The shares vary a lot by state, from over 60% in some trades in California to under 5% in states like Vermont, Montana and West Virginia.
Key findings
- 2,845,679 of 11,187,560 construction workers (25.4%) were born outside the U.S., based on the 2020-2024 survey average.
- Building cleaning and services has the highest share of the three: 39.2%. Landscaping is 35.4%. All jobs together: 17.8%.
- In construction, the highest shares are in California (41%), Texas (39%), Florida (38%), New Jersey (38%), New York (36%). The lowest are Maine (3.1%), West Virginia (2.6%), Montana (2.4%), Vermont (2.4%).
- In building cleaning, Massachusetts (64%), Rhode Island (62%), California (60%), New Jersey (59%) are highest among states with enough survey records.
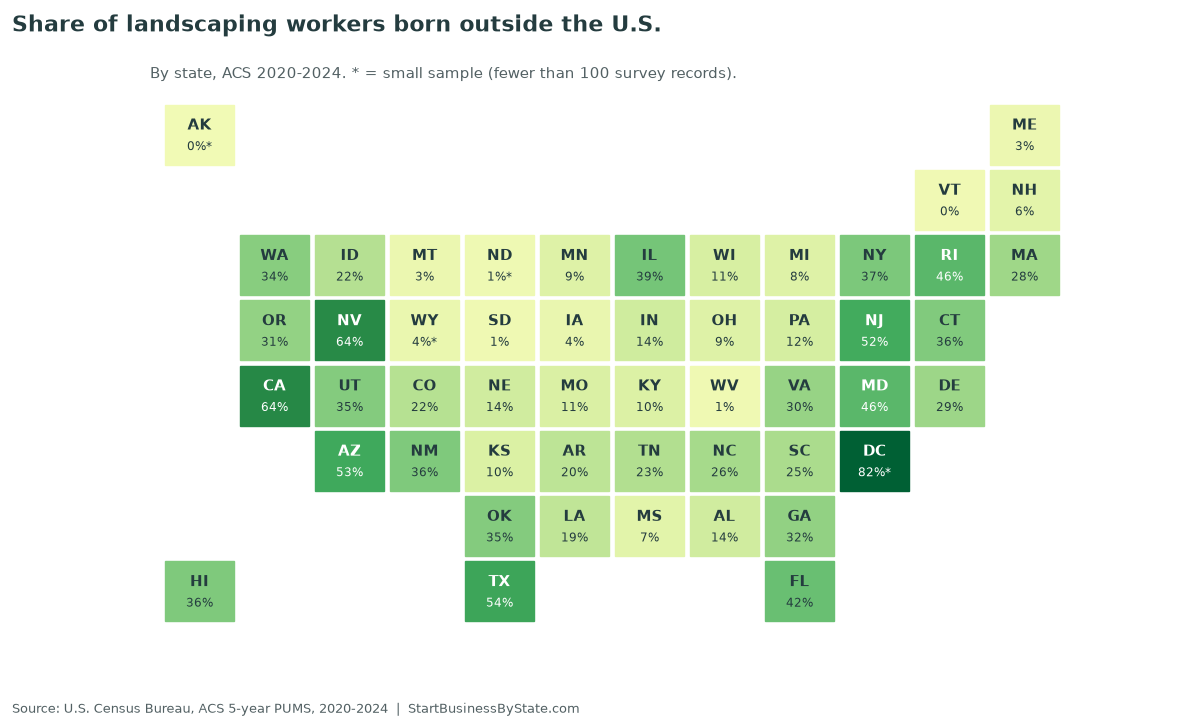
- In landscaping, California (64%), Nevada (64%), Texas (54%), Arizona (53%) are highest among states with enough survey records.
- ICE recorded 375,544 administrative arrests from October 1, 2025 to August 5, 2026, compared with 177,394 in the same dates a year earlier. Texas (94,123), Florida (40,002) and California (32,706) had the most.
- Small businesses report labor trouble. In NFIB’s September 2026 survey, 26% of owners named labor quality or availability as their single most important problem, 14 points above the survey’s historical average. The survey does not ask about immigration.
By industry, nationwide
Construction, state by state

Landscaping, state by state
All 50 states and D.C.
Click a column heading to sort. Worker counts are survey estimates averaged over 2020 to 2024. A star (*) means fewer than 100 survey records, so the share is rough.
| State | All jobs: born outside U.S. | Construction workers | Construction: born outside U.S. | Building cleaning and services workers | Building cleaning: born outside U.S. | Landscaping workers | Landscaping: born outside U.S. | ICE arrests, Oct. 1, 2025 to Aug. 5, 2026 | ICE arrests, same dates a year earlier |
|---|---|---|---|---|---|---|---|---|---|
| United States | 17.8% | 11,187,560 | 25.4% | 1,609,798 | 39.2% | 1,288,599 | 35.4% | 375,544 | 177,394 |
| Alabama | 5.3% | 154,366 | 13.2% | 21,030 | 12.4% | 16,566 | 13.7% | 7,700 | 3,129 |
| Alaska | 11.6% | 22,799 | 4.1% | 2,940 | 24.0% * | 1,285 | 0.0% * | 132 | 47 |
| Arizona | 16.4% | 266,690 | 25.6% | 42,626 | 36.5% | 34,186 | 52.7% | 13,628 | 4,492 |
| Arkansas | 7.8% | 98,460 | 19.1% | 12,161 | 21.7% | 9,138 | 19.8% | 3,454 | 2,355 |
| California | 33.2% | 1,246,593 | 40.9% | 208,695 | 60.3% | 180,056 | 64.3% | 32,706 | 12,291 |
| Colorado | 11.9% | 247,119 | 20.3% | 25,572 | 38.8% | 21,632 | 21.7% | 3,745 | 2,568 |
| Connecticut | 19.4% | 112,807 | 27.4% | 18,584 | 55.6% | 19,483 | 35.8% | 824 | 473 |
| Delaware | 14.0% | 33,528 | 18.5% | 5,759 | 37.0% | 5,226 | 28.8% | 681 | 423 |
| District of Columbia | 17.6% | 8,135 | 34.2% | 3,981 | 71.0% * | 1,141 | 82.2% * | 906 | 97 |
| Florida | 27.5% | 861,390 | 38.1% | 162,175 | 47.7% | 124,737 | 41.8% | 40,002 | 15,950 |
| Georgia | 15.1% | 363,417 | 28.4% | 58,740 | 27.5% | 48,126 | 31.6% | 14,259 | 5,972 |
| Hawaii | 22.5% | 48,957 | 15.6% | 6,121 | 31.7% | 5,980 | 36.3% | 240 | 161 |
| Idaho | 8.1% | 84,563 | 10.4% | 9,178 | 18.8% | 9,260 | 22.3% | 1,589 | 496 |
| Illinois | 18.5% | 337,155 | 25.4% | 56,721 | 47.2% | 40,786 | 38.9% | 5,425 | 1,841 |
| Indiana | 8.4% | 219,009 | 10.6% | 24,584 | 13.8% | 23,074 | 14.2% | 5,543 | 2,333 |
| Iowa | 7.6% | 113,956 | 8.4% | 10,079 | 14.8% | 9,443 | 4.1% | 1,685 | 817 |
| Kansas | 9.7% | 92,763 | 17.8% | 11,156 | 33.5% | 8,889 | 10.5% | 2,332 | 1,278 |
| Kentucky | 6.0% | 131,672 | 8.2% | 15,536 | 9.5% | 13,019 | 10.0% | 3,136 | 1,810 |
| Louisiana | 6.3% | 169,031 | 17.0% | 18,548 | 13.1% | 14,196 | 18.9% | 5,917 | 3,340 |
| Maine | 4.8% | 54,311 | 3.1% | 4,982 | 5.9% | 6,231 | 2.7% | 596 | 183 |
| Maryland | 21.5% | 232,679 | 35.0% | 36,820 | 52.8% | 22,345 | 45.7% | 6,151 | 2,640 |
| Massachusetts | 21.7% | 228,257 | 26.5% | 37,409 | 64.2% | 26,535 | 28.4% | 4,903 | 3,215 |
| Michigan | 9.0% | 282,925 | 8.3% | 43,174 | 10.5% | 39,788 | 8.4% | 4,248 | 1,802 |
| Minnesota | 11.0% | 193,527 | 7.2% | 18,998 | 28.2% | 17,260 | 8.7% | 5,349 | 1,394 |
| Mississippi | 3.2% | 86,775 | 8.5% | 11,593 | 5.3% | 8,790 | 7.0% | 3,230 | 1,770 |
| Missouri | 5.8% | 202,683 | 6.1% | 26,649 | 10.6% | 20,633 | 10.7% | 3,592 | 1,480 |
| Montana | 2.9% | 50,577 | 2.4% | 4,137 | 4.1% | 3,864 | 3.0% | 253 | 51 |
| Nebraska | 9.8% | 73,549 | 16.5% | 8,519 | 27.7% | 6,228 | 13.6% | 1,916 | 990 |
| Nevada | 24.5% | 116,441 | 35.8% | 15,552 | 52.4% | 12,164 | 63.5% | 2,813 | 1,637 |
| New Hampshire | 7.3% | 55,988 | 6.6% | 5,903 | 15.7% | 7,861 | 6.5% | 485 | 200 |
| New Jersey | 29.8% | 286,644 | 38.1% | 47,738 | 59.4% | 29,363 | 51.7% | 12,238 | 4,330 |
| New Mexico | 12.2% | 68,761 | 22.4% | 7,806 | 33.5% | 6,342 | 36.5% | 4,679 | 712 |
| New York | 27.6% | 540,811 | 36.5% | 93,697 | 57.1% | 46,643 | 37.2% | 12,566 | 5,707 |
| North Carolina | 12.0% | 375,442 | 26.7% | 54,541 | 27.5% | 52,148 | 26.5% | 6,948 | 2,785 |
| North Dakota | 5.8% | 30,164 | 3.7% | 3,255 | 10.0% | 2,596 | 1.3% * | 361 | 120 |
| Ohio | 6.4% | 342,478 | 6.2% | 47,453 | 10.6% | 38,581 | 8.6% | 4,785 | 1,816 |
| Oklahoma | 9.0% | 136,434 | 20.6% | 14,563 | 24.9% | 14,313 | 35.2% | 6,449 | 2,595 |
| Oregon | 13.0% | 140,370 | 14.9% | 16,984 | 30.2% | 17,311 | 31.3% | 1,961 | 385 |
| Pennsylvania | 9.6% | 380,657 | 8.6% | 50,952 | 17.5% | 42,440 | 12.5% | 8,306 | 3,615 |
| Rhode Island | 17.7% | 35,415 | 20.0% | 5,273 | 62.1% | 4,983 | 45.7% | 425 | 420 |
| South Carolina | 7.8% | 174,698 | 18.2% | 27,567 | 19.5% | 25,560 | 25.2% | 5,075 | 2,521 |
| South Dakota | 5.1% | 35,330 | 3.8% | 3,019 | 5.0% | 2,093 | 0.8% | 663 | 182 |
| Tennessee | 7.8% | 236,409 | 18.3% | 32,583 | 19.3% | 26,806 | 23.1% | 9,709 | 4,402 |
| Texas | 22.3% | 1,231,428 | 38.9% | 156,190 | 50.1% | 120,542 | 54.0% | 94,123 | 36,742 |
| Utah | 11.9% | 137,729 | 20.1% | 14,924 | 28.3% | 11,200 | 35.2% | 4,858 | 2,408 |
| Vermont | 5.3% | 26,293 | 2.4% | 2,229 | 3.5% | 2,983 | 0.5% | 134 | 21 |
| Virginia | 16.9% | 275,997 | 26.3% | 40,727 | 39.1% | 33,566 | 30.5% | 9,429 | 4,924 |
| Washington | 20.1% | 274,736 | 18.3% | 31,291 | 38.5% | 25,271 | 34.3% | 4,681 | 1,256 |
| West Virginia | 2.5% | 50,561 | 2.6% | 5,940 | 1.7% | 4,669 | 1.0% | 2,366 | 433 |
| Wisconsin | 6.5% | 193,383 | 5.6% | 22,897 | 17.5% | 21,695 | 11.4% | 1,723 | 799 |
| Wyoming | 4.6% | 23,698 | 8.9% | 2,247 | 23.1% * | 1,572 | 3.5% * | 1,385 | 303 |
About the ICE arrest data
- These are ICE Enforcement and Removal Operations administrative arrests, as released by ICE to the Deportation Data Project. The latest release runs through early August 2026.
- The arrests are counted by the state field in ICE’s records. 4,142 recent arrests and 24,850 arrests in the earlier period had no state, so state totals can run low, more so for the earlier period.
- ICE changed how it labels arrest types between the two years, so we show totals only.
- The records do not show a person’s job or industry. Nothing here links arrests to any trade.
Cite or share this data
Source: StartBusinessByState.com, Immigrant workers by trade and state (updated October 2, 2026). https://startbusinessbystate.com/immigrant-workers-by-trade-by-state/
Sources and methods
- Workers. U.S. Census Bureau, American Community Survey 5-year Public Use Microdata Sample, 2020-2024, through the Census microdata API, fetched October 2, 2026. Employed civilians (ESR 1 or 2), weighted with PWGTP. Industries: construction (INDP 0770), services to buildings and dwellings (7690) and landscaping services (7770). “Born outside the U.S.” is ACS NATIVITY = foreign born. These are survey estimates with sampling error; we flag cells with fewer than 100 records.
- Arrests. “Government data provided by ICE in response to a FOIA request to the Deportation Data Project and analyzed by StartBusinessByState.com.” Files: ERO Administrative Arrests FY2025 and FY2026 year to date (October 1, 2025 to August 5, 2026), from the Deportation Data Project ICE data page, release of August 24, 2026. We counted records by the State field.
- Labor survey. NFIB, Jobs Report, September 2026 (411 respondents, surveyed through September 28, 2026).
- What this page does not do. It does not estimate legal status, predict hiring effects or link arrests to industries. The two data sets cover different people and different years.
FAQ
Where do these worker numbers come from?
From the Census Bureau’s American Community Survey. We used the 5-year sample covering 2020 to 2024 and counted employed people by the industry they work in and whether they were born in the U.S. “Born outside the U.S.” includes naturalized citizens, green card holders and others. The survey does not say whether someone has legal status.
What counts as building cleaning and services?
The Census industry “services to buildings and dwellings.” It covers janitorial and cleaning companies, carpet and upholstery cleaning, pest control and similar services. Landscaping is counted separately.
What do the ICE arrest numbers count?
Administrative arrests by ICE Enforcement and Removal Operations, by the state ICE recorded. The data came from ICE through a Freedom of Information Act request by the Deportation Data Project. The arrests are of all people, not only workers, and the data does not show anyone’s job.
Why are some numbers marked with a star?
A star means fewer than 100 survey records sit behind that number. Small samples can swing a lot, so treat those values as rough.
Can I use this data?
Yes. Please credit StartBusinessByState.com and link to this page. The full table is free to download as a CSV.