Original research · Indeed Hiring Lab job postings (through Sep 18, 2026) · BLS Employment Projections 2025–35 and wage data (May 2025) · Updated September 28, 2026
Trade and engineering jobs have held up far better than tech jobs. On Indeed, construction job postings are 25% above where they were in February 2020. Mechanical engineering postings are 63% above. Software development postings are 23% below, and data & analytics postings are 38% below. The gap opened up around the time ChatGPT came out in late 2022. That timing is suggestive, but it does not prove AI caused it.
Key findings
- Engineering and trade postings are still above early-2020 levels. Tech postings are far below. Indeed’s index (Feb 1, 2020 = 100) on Sep 18, 2026: mechanical engineering 163.4, civil engineering 157.9, electrical engineering 146.7, construction 125.1, installation & maintenance 114.3. Software development is at 77.3 and data & analytics is at 62.1, last of all 47 job types. All jobs combined: 103.5.
- Since ChatGPT launched, tech postings fell much further than the job market as a whole. From Nov 30, 2022 to Sep 18, 2026, all postings fell 29.5%. Software development fell 45.7% and data & analytics fell 54.8%. Construction (-26.6%) and installation & maintenance (-26.8%) fell about as much as the overall market. Mechanical engineering fell only 8.0%.
- In the past year, engineering postings jumped. Mechanical engineering is up 37.3%, industrial engineering 32.1% and electrical engineering 24.3%. That lines up with a surge in data center building: private data center construction spending hit a $75.2 billion annual rate in July 2026, up 57.2% in a year and 7.8 times the February 2020 level.
- The government expects the trades to keep growing faster than average. BLS projects HVAC jobs to grow +10.9%, electricians +9.2% and plumbers +6.8% from 2025 to 2035, versus +3.5% for all jobs. BLS rates these trades “Moderate” for AI exposure. The office jobs BLS expects to shrink are routine ones: data entry keyers (-25.5%), secretaries (-6.0%) and customer service reps (-5.3%).
- Trades don’t pay more than software, but pay varies a lot by state. The typical (median) electrician earned $63,190 in May 2025, compared with $135,980 for software developers. But electricians’ median pay tops $90,000 in Oregon ($101,310), Illinois, Hawaii and Washington. Wyoming has the most electricians for its size: 10.5 per 1,000 jobs.
The trend since 2020
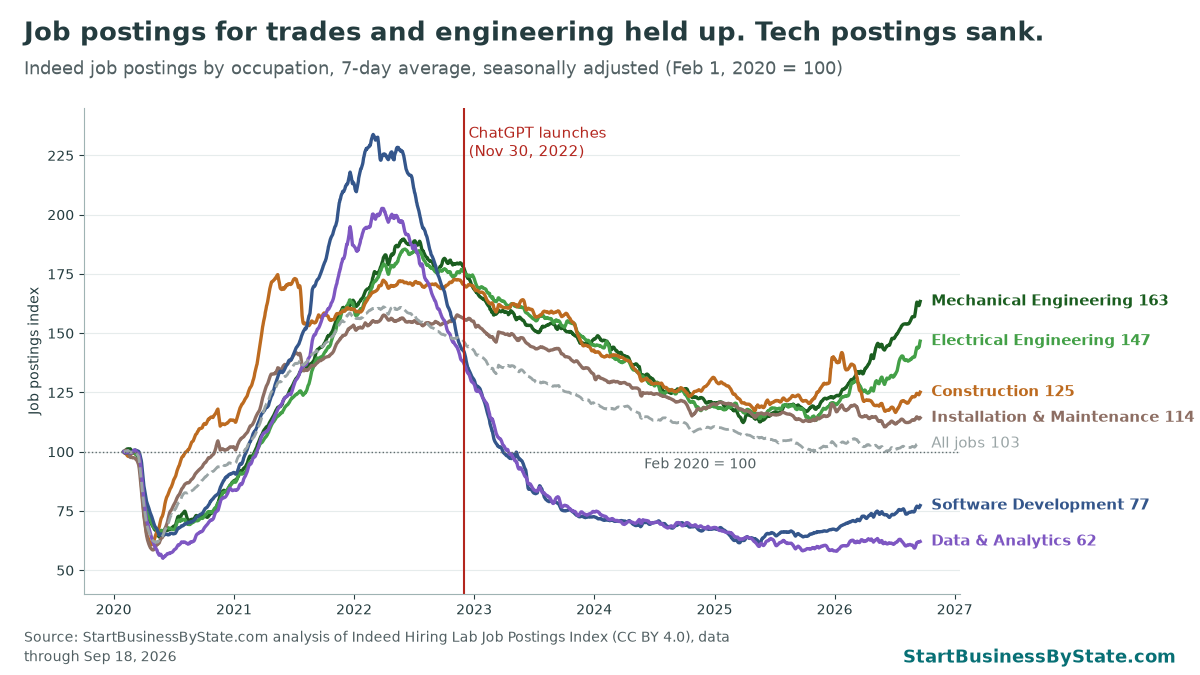
Everyone hired like crazy in 2021 and early 2022. Tech hired hardest. Software postings peaked in February 2022 at more than twice their early-2020 level.
Then everything cooled. Here is the part that matters for the AI question: software postings were already falling before ChatGPT came out. By Nov 30, 2022, they were 39.1% below their peak. Data & analytics postings were 32.1% below theirs. Interest rates were rising fast in 2022, and many tech companies were cutting back after over-hiring.
What’s different is what happened next. Trade and engineering postings slid slowly and have turned up again this year. Software postings kept sliding until May 2025, and data & analytics until early 2026. Both are still well below early-2020 levels. AI tools that write code and analyze data may be part of that. But this data can’t separate AI from interest rates, tech layoffs and companies trimming after a hiring spree.
All 47 job types, ranked
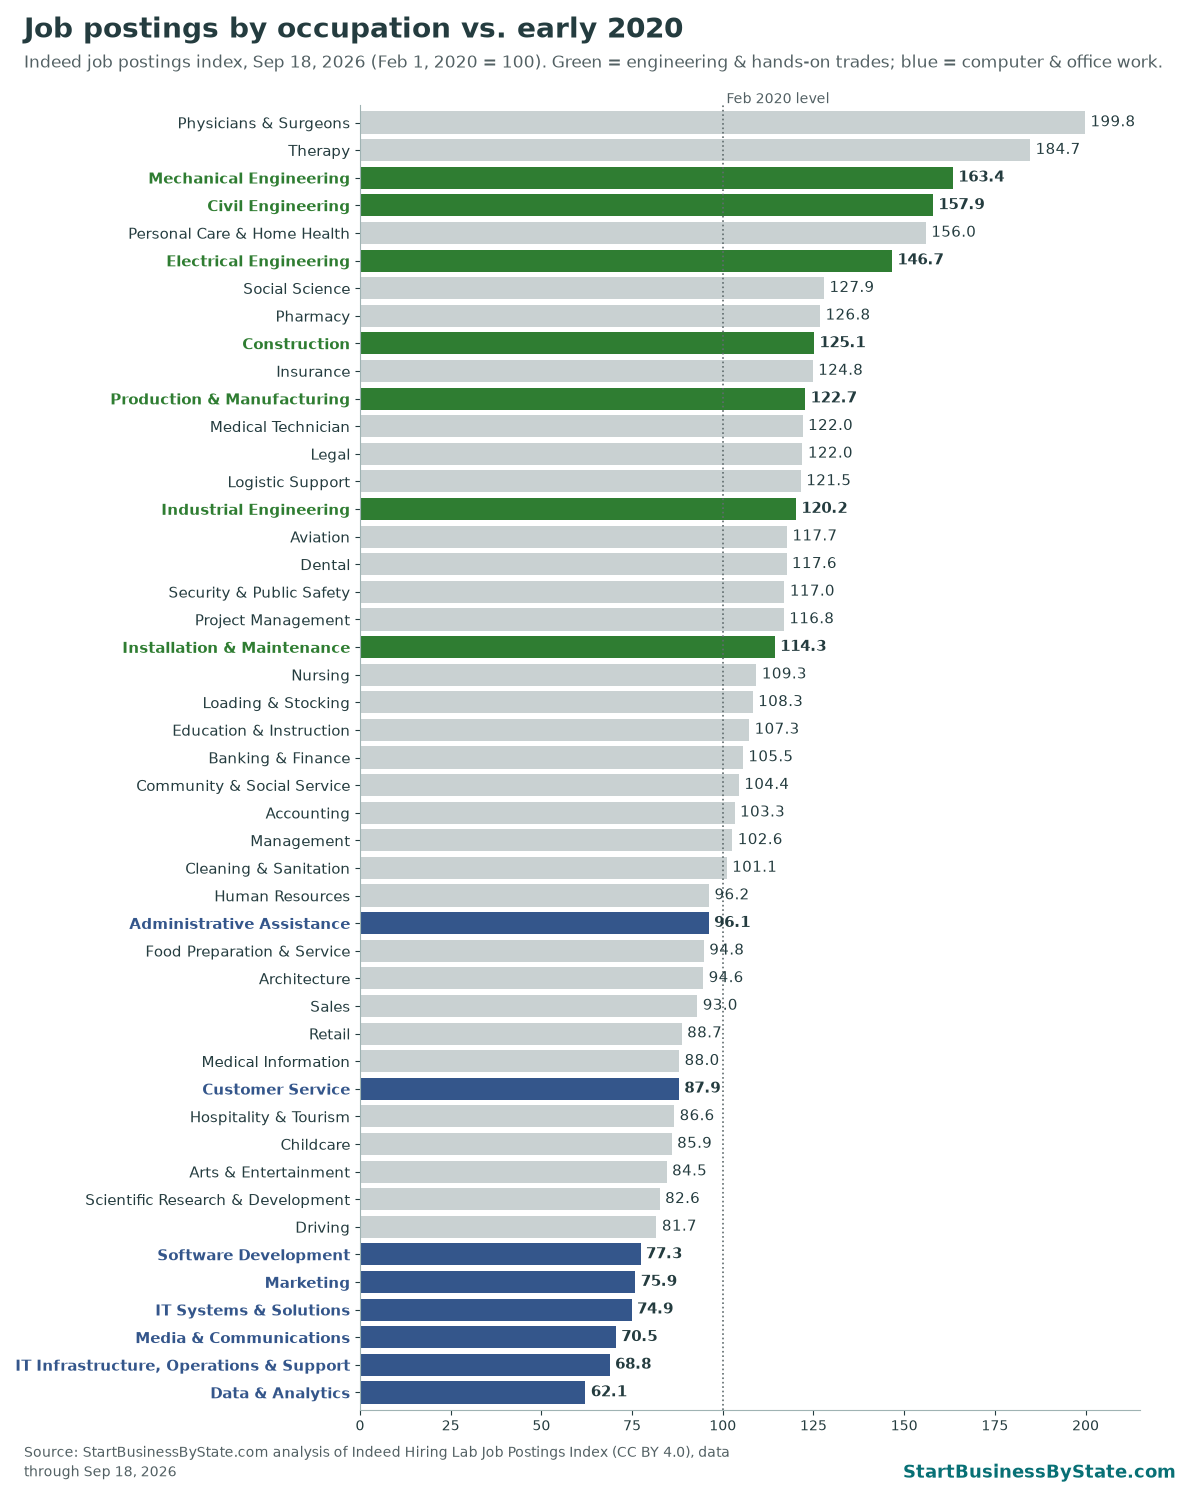
Health care jobs top the list, but engineering and trade jobs are close behind. Mechanical engineering ranks #3 of 47, electrical engineering #6 and construction #9. At the bottom, six of the last seven spots are computer and office jobs: software development (#42), marketing, IT systems, media, IT infrastructure and data & analytics (#47).
A note on names: Indeed doesn’t publish separate numbers for electricians, plumbers or HVAC techs. The closest groups are Construction (example job titles: laborer, equipment operator) and Installation & Maintenance (example titles: technician, maintenance technician). The engineering groups are engineers, not tradespeople.
| Rank | Job type | Index, Sep 18, 2026 | Index, Nov 30, 2022 (ChatGPT launch) | Change since ChatGPT | Change, past year |
|---|---|---|---|---|---|
| All jobs | 103.5 | 146.7 | -29.5% | — | |
| 1 | Physicians & Surgeons | 199.8 | 186.3 | +7.3% | +8.6% |
| 2 | Therapy | 184.7 | 183.5 | +0.6% | +1.6% |
| 3 | Mechanical Engineering | 163.4 | 177.7 | -8.0% | +37.3% |
| 4 | Civil Engineering | 157.9 | 202.6 | -22.0% | +2.7% |
| 5 | Personal Care & Home Health | 156.0 | 182.8 | -14.7% | +4.6% |
| 6 | Electrical Engineering | 146.7 | 175.9 | -16.6% | +24.3% |
| 7 | Social Science | 127.9 | 185.4 | -31.0% | -4.1% |
| 8 | Pharmacy | 126.8 | 174.2 | -27.2% | +1.9% |
| 9 | Construction | 125.1 | 170.5 | -26.6% | +1.8% |
| 10 | Insurance | 124.8 | 153.5 | -18.7% | +4.2% |
| 11 | Production & Manufacturing | 122.7 | 178.4 | -31.2% | +10.4% |
| 12 | Medical Technician | 122.0 | 182.4 | -33.1% | -5.6% |
| 13 | Legal | 122.0 | 154.8 | -21.2% | +1.6% |
| 14 | Logistic Support | 121.5 | 160.9 | -24.5% | +3.9% |
| 15 | Industrial Engineering | 120.2 | 161.5 | -25.6% | +32.1% |
| 16 | Aviation | 117.7 | 163.7 | -28.1% | +9.2% |
| 17 | Dental | 117.6 | 167.0 | -29.6% | -13.8% |
| 18 | Security & Public Safety | 117.0 | 153.5 | -23.8% | +1.9% |
| 19 | Project Management | 116.8 | 155.3 | -24.8% | +17.4% |
| 20 | Installation & Maintenance | 114.3 | 156.2 | -26.8% | +0.6% |
| 21 | Nursing | 109.3 | 169.8 | -35.7% | -4.2% |
| 22 | Loading & Stocking | 108.3 | 157.9 | -31.4% | +10.6% |
| 23 | Education & Instruction | 107.3 | 162.5 | -34.0% | -10.3% |
| 24 | Banking & Finance | 105.5 | 143.5 | -26.5% | +9.7% |
| 25 | Community & Social Service | 104.4 | 162.2 | -35.6% | -6.7% |
| 26 | Accounting | 103.3 | 191.1 | -46.0% | -5.7% |
| 27 | Management | 102.6 | 136.0 | -24.5% | +4.5% |
| 28 | Cleaning & Sanitation | 101.1 | 157.0 | -35.6% | +1.4% |
| 29 | Human Resources | 96.2 | 155.6 | -38.1% | +13.3% |
| 30 | Administrative Assistance | 96.1 | 163.8 | -41.3% | +0.9% |
| 31 | Food Preparation & Service | 94.8 | 134.0 | -29.3% | -6.2% |
| 32 | Architecture | 94.6 | 151.5 | -37.6% | +7.3% |
| 33 | Sales | 93.0 | 117.9 | -21.1% | +1.1% |
| 34 | Retail | 88.7 | 131.2 | -32.4% | +0.8% |
| 35 | Medical Information | 88.0 | 170.0 | -48.2% | -6.6% |
| 36 | Customer Service | 87.9 | 124.0 | -29.1% | -1.3% |
| 37 | Hospitality & Tourism | 86.6 | 130.2 | -33.5% | -2.8% |
| 38 | Childcare | 85.9 | 163.8 | -47.5% | -12.2% |
| 39 | Arts & Entertainment | 84.5 | 124.0 | -31.8% | +9.5% |
| 40 | Scientific Research & Development | 82.6 | 150.1 | -45.0% | +18.5% |
| 41 | Driving | 81.7 | 127.1 | -35.7% | -9.6% |
| 42 | Software Development | 77.3 | 142.5 | -45.7% | +19.2% |
| 43 | Marketing | 75.9 | 122.2 | -37.9% | -2.6% |
| 44 | IT Systems & Solutions | 74.9 | 133.7 | -44.0% | +6.7% |
| 45 | Media & Communications | 70.5 | 124.4 | -43.3% | +10.7% |
| 46 | IT Infrastructure, Operations & Support | 68.8 | 131.4 | -47.6% | +4.9% |
| 47 | Data & Analytics | 62.1 | 137.6 | -54.8% | +4.5% |
The last year: engineers in demand, trades steady
Over the past year (Sep 18, 2025 to Sep 18, 2026), the biggest jumps were in engineering: mechanical +37.3%, industrial +32.1% and electrical +24.3%. Hands-on trade postings were roughly flat: construction +1.8%, installation & maintenance +0.6%. Software postings recovered a bit (+19.2%), but from a very low starting point.
One likely reason is the building boom behind AI itself. Data centers need power, cooling and a lot of electrical and mechanical work. To see which states are getting the most of it, read our data center boom by state study. States are also rewriting the tax breaks that drew many of these projects; our data center tax break tracker lists every 2025-26 bill. The six fastest-growing data center states got 50.0% of their power from natural gas over the past year; see electricity sources by state.

Census counts $75.2 billion a year of private data center construction as of July 2026. That’s up from $47.8 billion a year earlier and $13.9 billion in November 2022. For what that means for heating and cooling contractors, see how to get commercial HVAC maintenance contracts and commercial electricity costs.
Power prices are part of the same story. Business electricity prices rose about 20% in the past year in Ohio and Virginia, two of the biggest data center states, but across all states the link between data center growth and higher prices is not clear (see are data centers raising power bills?).
Builders are saying it in their annual reports: 44.8% of construction companies that filed a 10-K this year mention data centers, up from 14.5% in 2023 (AI in 10-K filings).
The 10-year outlook from BLS
Job postings show what employers want right now. For the longer view, the Bureau of Labor Statistics (BLS) projects jobs out to 2035. In August 2026, BLS also started rating every occupation for “AI exposure”: how much of the work AI could help with or do. Exposure isn’t the same as job loss. BLS says plainly that it doesn’t mean job cuts or lower pay. To see how many jobs in your state fall in each exposure group, and which hands-on jobs are least exposed, see our AI-proof jobs by state study.

The trades we cover are expected to grow faster than the +3.5% average for all jobs: HVAC +10.9%, electricians +9.2%, plumbers +6.8%. Industrial machinery mechanics, who keep factory and data center equipment running, lead at +17.8%.
It isn’t a simple “trades good, tech bad” story, though. BLS still expects software developer jobs to grow +10.2% and data scientist jobs +34.6%. The shrinking jobs are routine office work, the kind of tasks AI tools already handle well.
| AI exposure | Occupations | Jobs in 2025 | Projected change, 2025–35 |
|---|---|---|---|
| Low | 213 | 30.3 million | +2.5% |
| Moderate | 206 | 44.7 million | +6.2% |
| High | 206 | 42.1 million | +3.1% |
| Very high | 206 | 53.2 million | +2.0% |
Grouped this way, the “Moderate” exposure jobs, where most of the skilled trades sit, are expected to grow fastest (+6.2%). The “Very high” group grows slowest (+2.0%). Low-exposure jobs grow +2.5%; that group includes many lower-paid service jobs as well as trades like carpenters and welders.
| Occupation | BLS AI exposure | Jobs, 2025 | Projected change, 2025–35 | Openings per year | Median pay, 2025 | Self-employed |
|---|---|---|---|---|---|---|
| Hands-on trades | ||||||
| Industrial machinery mechanics | Moderate | 446,900 | +17.8% | 44,400 | $64,520 | 1.3% |
| HVAC mechanics & installers | Moderate | 440,900 | +10.9% | 40,600 | $61,010 | 6.3% |
| Power-line installers | Low | 131,900 | +10.3% | 10,900 | $95,320 | 0.3% |
| Electricians | Moderate | 821,000 | +9.2% | 72,700 | $63,190 | 7.1% |
| Construction laborers | Low | 1,489,300 | +7.3% | 120,000 | $47,120 | 26.9% |
| Plumbers & pipefitters | Moderate | 510,600 | +6.8% | 42,000 | $63,800 | 8.0% |
| Carpenters | Low | 889,700 | +3.9% | 62,800 | $60,580 | 25.1% |
| Welders | Low | 437,700 | +2.4% | 40,300 | $53,750 | 4.3% |
| Engineers | ||||||
| Mechanical engineers | Very high | 298,500 | +11.2% | 17,800 | $104,110 | 0.5% |
| Electrical engineers | High | 199,700 | +9.9% | 11,400 | $120,630 | 0.5% |
| Computer & office jobs | ||||||
| Data scientists | Very high | 275,600 | +34.6% | 24,800 | $120,230 | 1.9% |
| Software developers | Very high | 1,717,800 | +10.2% | 95,300 | $135,980 | 1.5% |
| Web developers | Very high | 87,400 | +3.8% | 5,300 | $92,650 | 17.5% |
| Paralegals & legal assistants | High | 404,900 | -0.3% | 40,800 | $62,890 | 2.1% |
| Graphic designers | Very high | 253,100 | -1.7% | 16,000 | $62,960 | 20.5% |
| Customer service reps | Very high | 2,666,000 | -5.3% | 289,500 | $44,770 | 0.5% |
| Bookkeeping clerks | Very high | 1,532,400 | -5.6% | 144,100 | $50,670 | 5.6% |
| Secretaries & admin assistants | Very high | 1,889,800 | -6.0% | 163,900 | $47,540 | 1.5% |
| Computer programmers | Very high | 110,800 | -7.3% | 4,400 | $100,390 | 14.6% |
| Data entry keyers | Very high | 131,800 | -25.5% | 7,700 | $41,340 | 1.6% |
Jobs and openings are BLS estimates rounded to the nearest hundred. Openings include replacing workers who retire or change careers. Median pay excludes self-employed workers.
Pay: what trades earn vs. office jobs
Let’s be straight about pay. Nationally, trades pay less than software and engineering jobs. In May 2025, median pay was $63,190 for electricians, $63,800 for plumbers and $61,010 for HVAC techs, versus $135,980 for software developers.
But trades beat many of the office jobs that BLS expects to shrink. Customer service reps earned $44,770, bookkeeping clerks $50,670 and data entry keyers $41,340. Electricians, plumbers and carpenters usually learn through paid apprenticeships, and HVAC techs through a certificate program plus on-the-job training. None of them needs a four-year degree. And trades are far more likely to be self-employed: 25.1% of carpenters, 8.0% of plumbers and 7.1% of electricians, versus 1.5% of software developers.
Are trade businesses using AI too?
Yes, more of them every month. In the Census Bureau’s business survey, 14.3% of specialty trade contractors (electrical, plumbing, HVAC, roofing and similar firms) said they used AI in the last two weeks (Aug 24–Sep 6, 2026). At the start of 2026 it was 6.1%. That’s still well below the 23.8% of all businesses. See every state in our small-business AI use by state study.
See how trade contractors compare with every other industry in our AI use by industry breakdown.
Electricians by state
Indeed’s state numbers cover all jobs combined, not individual job types. So for the state view we use the government’s own count of electricians from BLS (May 2025). Click a heading to sort. State names link to our guides for starting a business in each state.
Wyoming (10.5 per 1,000 jobs), North Dakota (8.3) and Idaho (6.6) have the most electricians for the size of their workforce. Pay is highest in Oregon ($101,310), Illinois ($99,560) and Hawaii ($96,460). It’s lowest in Arkansas ($49,070). Living costs differ a lot between these states, too.
| Rank | State | Electricians | Electricians per 1,000 jobs | Electrician median pay | HVAC median pay | Plumber median pay | Software developer median pay | Electrician pay as % of software pay |
|---|---|---|---|---|---|---|---|---|
| United States | 757,220 | — | $63,190 | $61,010 | $63,800 | $135,980 | 46% | |
| 1 | Wyoming | 2,960 | 10.5 | $76,120 | $54,700 | $62,410 | $115,170 | 66% |
| 2 | North Dakota North Dakota electrical startup guide |
3,570 | 8.3 | $65,710 | $74,490 | $63,560 | $105,600 | 62% |
| 3 | Idaho Idaho electrical startup guide |
5,690 | 6.6 | $63,000 | $56,240 | $52,380 | $131,590 | 48% |
| 4 | Iowa | 10,310 | 6.6 | $60,860 | $60,680 | $63,890 | $114,890 | 53% |
| 5 | Utah Utah electrical startup guide |
11,450 | 6.6 | $62,000 | $58,730 | $61,900 | $128,810 | 48% |
| 6 | Arizona | 21,140 | 6.5 | $61,060 | $59,400 | $62,070 | $129,690 | 47% |
| 7 | South Dakota South Dakota electrical startup guide |
2,980 | 6.5 | $61,390 | $61,390 | $51,620 | $96,310 | 64% |
| 8 | Nebraska | 6,440 | 6.3 | $60,820 | $59,850 | $60,970 | $110,900 | 55% |
| 9 | West Virginia West Virginia electrical startup guide |
4,290 | 6.1 | $64,810 | $48,850 | $56,980 | $121,000 | 54% |
| 10 | Indiana | 19,020 | 5.9 | $68,490 | $60,430 | $76,320 | $105,920 | 65% |
| 11 | Colorado Colorado electrical startup guide |
17,010 | 5.9 | $62,230 | $65,200 | $63,240 | $138,390 | 45% |
| 12 | Maine Maine electrical startup guide |
3,780 | 5.9 | $75,380 | $63,170 | $64,000 | $123,120 | 61% |
| 13 | New Mexico New Mexico electrical startup guide |
5,020 | 5.8 | $58,390 | $50,270 | $61,440 | $124,520 | 47% |
| 14 | Arkansas Arkansas electrical startup guide |
7,500 | 5.8 | $49,070 | $48,110 | $48,660 | $104,490 | 47% |
| 15 | Virginia | 23,630 | 5.8 | $62,900 | $59,730 | $60,470 | $136,460 | 46% |
| 16 | Alaska Alaska electrical startup guide |
1,870 | 5.7 | $89,440 | $77,430 | $93,920 | — | — |
| 17 | Mississippi Mississippi electrical startup guide |
6,610 | 5.7 | $60,860 | $48,680 | $55,480 | $95,330 | 64% |
| 18 | Kentucky Kentucky electrical startup guide |
11,030 | 5.5 | $59,720 | $58,620 | $64,160 | $109,010 | 55% |
| 19 | Washington Washington electrical startup guide |
19,380 | 5.5 | $95,220 | $75,660 | $81,030 | $166,540 | 57% |
| 20 | Texas | 76,770 | 5.5 | $58,570 | $57,760 | $59,840 | $132,150 | 44% |
| 21 | Louisiana | 10,550 | 5.5 | $61,540 | $58,650 | $63,680 | $102,800 | 60% |
| 22 | Oregon | 10,590 | 5.4 | $101,310 | $62,940 | $97,050 | $142,720 | 71% |
| 23 | Nevada | 8,350 | 5.4 | $73,570 | $60,510 | $61,610 | $128,810 | 57% |
| 24 | Montana Montana electrical startup guide |
2,750 | 5.4 | $76,760 | $60,850 | $79,960 | $121,990 | 63% |
| 25 | Michigan Michigan electrical startup guide |
23,530 | 5.3 | $76,270 | $60,850 | $80,190 | $125,570 | 61% |
| 26 | Ohio | 28,950 | 5.2 | $64,700 | $62,510 | $63,330 | $114,090 | 57% |
| 27 | Tennessee Tennessee electrical startup guide |
17,070 | 5.2 | $61,090 | $55,490 | $58,600 | $122,430 | 50% |
| 28 | Alabama Alabama electrical startup guide |
10,900 | 5.2 | $55,690 | $48,370 | $58,670 | $122,540 | 45% |
| 29 | Florida Florida electrical startup guide |
49,700 | 5.0 | $57,250 | $56,670 | $52,910 | $130,980 | 44% |
| 30 | Oklahoma Oklahoma electrical startup guide |
8,500 | 5.0 | $61,010 | $57,560 | $57,970 | $118,100 | 52% |
| 31 | Maryland Maryland electrical startup guide |
13,690 | 5.0 | $73,490 | $70,020 | $65,400 | $138,680 | 53% |
| 32 | Hawaii Hawaii electrical startup guide |
3,070 | 4.9 | $96,460 | $65,450 | $78,060 | $124,040 | 78% |
| 33 | Massachusetts Massachusetts electrical startup guide |
17,810 | 4.9 | $79,420 | $77,300 | $93,880 | $165,210 | 48% |
| 34 | New Hampshire New Hampshire electrical startup guide |
3,330 | 4.9 | $62,840 | $73,850 | $66,810 | $139,720 | 45% |
| 35 | Wisconsin Wisconsin electrical startup guide |
14,310 | 4.9 | $76,540 | $61,710 | $81,210 | $122,660 | 62% |
| 36 | Minnesota Minnesota electrical startup guide |
14,350 | 4.9 | $78,160 | $76,350 | $94,410 | $130,050 | 60% |
| 37 | Rhode Island Rhode Island electrical startup guide |
2,420 | 4.8 | $74,090 | $67,370 | $76,470 | $130,590 | 57% |
| 38 | Delaware Delaware electrical startup guide |
2,260 | 4.7 | $63,700 | $62,320 | $64,720 | $133,020 | 48% |
| 39 | Connecticut Connecticut electrical startup guide |
7,710 | 4.5 | $77,540 | $76,610 | $77,280 | $134,120 | 58% |
| 40 | Georgia | 21,650 | 4.4 | $58,320 | $56,390 | $57,200 | $131,010 | 45% |
| 41 | Kansas Kansas electrical startup guide |
6,350 | 4.4 | $65,860 | $60,460 | $65,220 | $113,420 | 58% |
| 42 | North Carolina | 21,640 | 4.4 | $56,800 | $57,260 | $57,080 | $134,710 | 42% |
| 43 | Missouri Missouri electrical startup guide |
12,780 | 4.4 | $65,410 | $59,950 | $66,790 | $126,120 | 52% |
| 44 | Vermont Vermont electrical startup guide |
1,270 | 4.2 | $63,430 | $62,150 | $62,170 | $125,280 | 51% |
| 45 | New York New York electrical startup guide |
40,130 | 4.1 | $78,750 | $74,430 | $77,490 | $166,180 | 47% |
| 46 | California California electrical startup guide |
73,310 | 4.0 | $76,160 | $72,560 | $72,830 | $174,410 | 44% |
| 47 | Illinois | 23,120 | 3.8 | $99,560 | $77,410 | $99,950 | $132,110 | 75% |
| 48 | Pennsylvania Pennsylvania electrical startup guide |
22,730 | 3.7 | $67,600 | $62,400 | $68,080 | $126,550 | 53% |
| 49 | District of Columbia | 2,440 | 3.5 | $78,970 | $84,390 | $101,020 | $136,880 | 58% |
| 50 | South Carolina | 8,010 | 3.5 | $58,740 | $56,610 | $53,940 | $129,450 | 45% |
| 51 | New Jersey New Jersey electrical startup guide |
13,520 | 3.2 | $77,250 | $74,450 | $78,240 | $135,940 | 57% |
Rank is by electricians per 1,000 jobs. Employment counts wage-and-salary workers only, not self-employed electricians. “—” means BLS did not publish that figure (Alaska software developer pay). Download the state table (CSV). For HVAC, janitors, landscapers and more, see trade labor density by state.
What this means if you’re starting a trade business
Opening a North Carolina electrical business? A growing trade market still requires the right contracting license and a workable launch budget. Our guide to starting an electrical business in North Carolina connects license classes and qualified individuals with insurance, permits, pricing and hiring.
For electricians preparing to work for themselves, our guide to starting an electrical business covers contractor qualifications, insurance, startup costs, pricing and finding customers.
For a Texas operation, our guide to starting an electrical business in Texas explains the contractor license, master of record, required insurance and practical steps before taking jobs.
- Demand for hands-on work is steady. Construction and maintenance postings are above early-2020 levels and have held flat this past year. The engineering jump may point to more big building projects, which often hire trade subcontractors.
- You’ll be competing for workers. BLS expects openings for electricians (72,700 a year), plumbers (42,000) and HVAC techs (40,600) every year through 2035. Check how tight the job market is in your state before you plan to hire.
- Your competitors are starting to use AI for quotes, scheduling and marketing. About 1 in 7 trade contractors already do.
- Start with the basics. Our HVAC business guide, HVAC industry statistics and best states to start a business are good next reads.
- Postings aren’t hires. A job posting shows what employers are looking for. It doesn’t count people hired, and one posting can be for several jobs, or none.
- Timing isn’t proof. The trade/tech gap grew after ChatGPT came out, but interest rates, tech layoffs and the end of the 2021–22 hiring spree all happened around the same time. We can’t pull those apart.
- Indeed isn’t every job. Many trade jobs are filled by word of mouth, unions or small-shop hiring that never reaches a job site.
- Projections are estimates. BLS projections assume AI spreads at a normal, gradual pace. BLS says AI exposure doesn’t mean job loss.
Cite or share this data
Reporters, bloggers and teachers are welcome to use the charts and numbers. Please credit and link to this page.
Source: StartBusinessByState.com analysis of Indeed Hiring Lab job postings data (CC BY 4.0), BLS Employment Projections and BLS wage data. https://startbusinessbystate.com/blue-collar-ai-boom/
Embed the trend chart:
<a href=”https://startbusinessbystate.com/blue-collar-ai-boom/”><img src=”https://startbusinessbystate.com/wp-content/uploads/2026/09/trade-vs-tech-postings-trend.png” alt=”Trade vs. tech job postings since 2020″ width=”1200″></a><br>Source: StartBusinessByState.com analysis of Indeed Hiring Lab data
Methodology
- Job postings. Indeed Hiring Lab Job Postings Index, U.S. by occupational category (GitHub data), downloaded September 28, 2026, with data through September 18, 2026. Each value is the seven-day trailing average of seasonally adjusted postings, indexed to February 1, 2020 = 100. We use “total postings.” Indeed groups jobs into categories by normalized job title. Used under the Creative Commons Attribution 4.0 license.
- Changes. “Since ChatGPT” compares Nov 30, 2022 (ChatGPT’s public launch) with Sep 18, 2026. “Past year” compares Sep 18, 2025 with Sep 18, 2026. Percent changes are calculated from the index values, not index points.
- Our groups. “Engineering & hands-on trades” = Mechanical, Electrical, Civil and Industrial Engineering, Construction, Installation & Maintenance, and Production & Manufacturing. “Computer & office work” = Software Development, Data & Analytics, IT Systems & Solutions, IT Infrastructure, Operations & Support, Media & Communications, Marketing, Administrative Assistance and Customer Service. These groupings are ours, not Indeed’s.
- Job outlook and AI exposure. BLS Employment Projections 2025–35 and the supplemental AI exposure categories table (released August 27, 2026). BLS combines several outside measures of theoretical and observed AI use into four categories: Low, Moderate, High and Very high. The grouped growth rates add up employment for every occupation in each category.
- Pay and state data. BLS Occupational Employment and Wage Statistics (OEWS), May 2025, pulled from the BLS Public Data API. National median pay matches the projections table. State employment excludes the self-employed.
- Data centers. U.S. Census Bureau Construction Spending (C30), private “data center” category, seasonally adjusted annual rate, released September 1, 2026. July 2026 is preliminary and may be revised.
- AI use by trade businesses. Census Business Trends and Outlook Survey, specialty trade contractors (NAICS 238): the first 2026 survey (Dec 15–28, 2025) vs. the latest (Aug 24–Sep 6, 2026).
- Sources. Indeed Hiring Lab job postings data; BLS Employment Projections 2025–35; BLS AI exposure categories; BLS Occupational Employment and Wage Statistics; Census Construction Spending; Census Business Trends and Outlook Survey.
- Updates. Indeed updates weekly and Census construction spending monthly. We plan to refresh this page periodically.
FAQ
Is AI taking tech jobs?
This data can’t say for sure. Tech job postings fell much more than others after ChatGPT came out, but they had already started falling before it, as interest rates rose and tech companies cut back. BLS still expects software developer jobs to grow +10.2% over the next ten years.
Are trade jobs safe from AI?
Safer than most, by BLS’s measure. Electricians, plumbers and HVAC techs are rated “Moderate” AI exposure, and carpenters, welders and construction laborers “Low.” Hands-on work in homes and buildings is harder for AI to do. AI may still change how trade businesses quote, schedule and market.
Why are engineering postings rising so fast?
Mechanical, electrical and industrial engineering postings are up 24–37% in a year. That lines up with the jump in data center and other big construction projects. We can’t prove the link from this data alone.
Why isn’t there an “electrician” line in the Indeed chart?
Indeed only publishes broad categories. Electricians and HVAC techs mostly fall under Construction or Installation & Maintenance. For electricians specifically, see the state table, which uses BLS data.
Do trade jobs pay more than tech jobs?
Not on average. Software developers’ median pay ($135,980) is about twice electricians’ ($63,190). But trades pay more than many routine office jobs, you can learn them through paid apprenticeships, and many tradespeople go on to run their own businesses.
How often is this updated?
Indeed’s data updates weekly. We plan to refresh the page periodically. Check the date at the top.
Can I use your charts?
Yes. Please credit “StartBusinessByState.com analysis of Indeed Hiring Lab and BLS data” and link to this page.