Original research · BLS Occupational Employment and Wage Statistics (OEWS) · Location quotient & jobs per 1,000 employed · Vintage May 2025 · Cross-industry statewide estimates · Published September 22, 2026
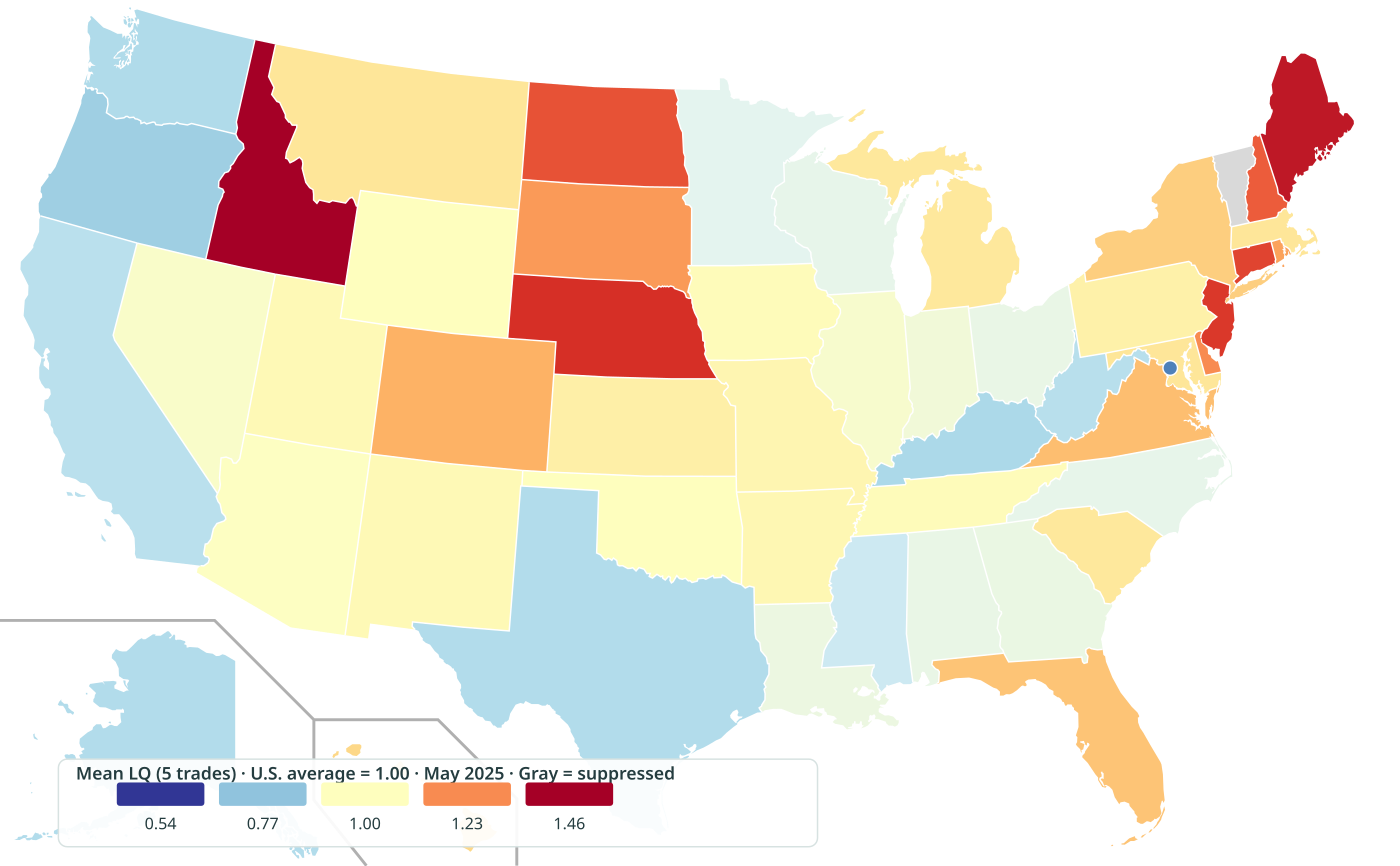
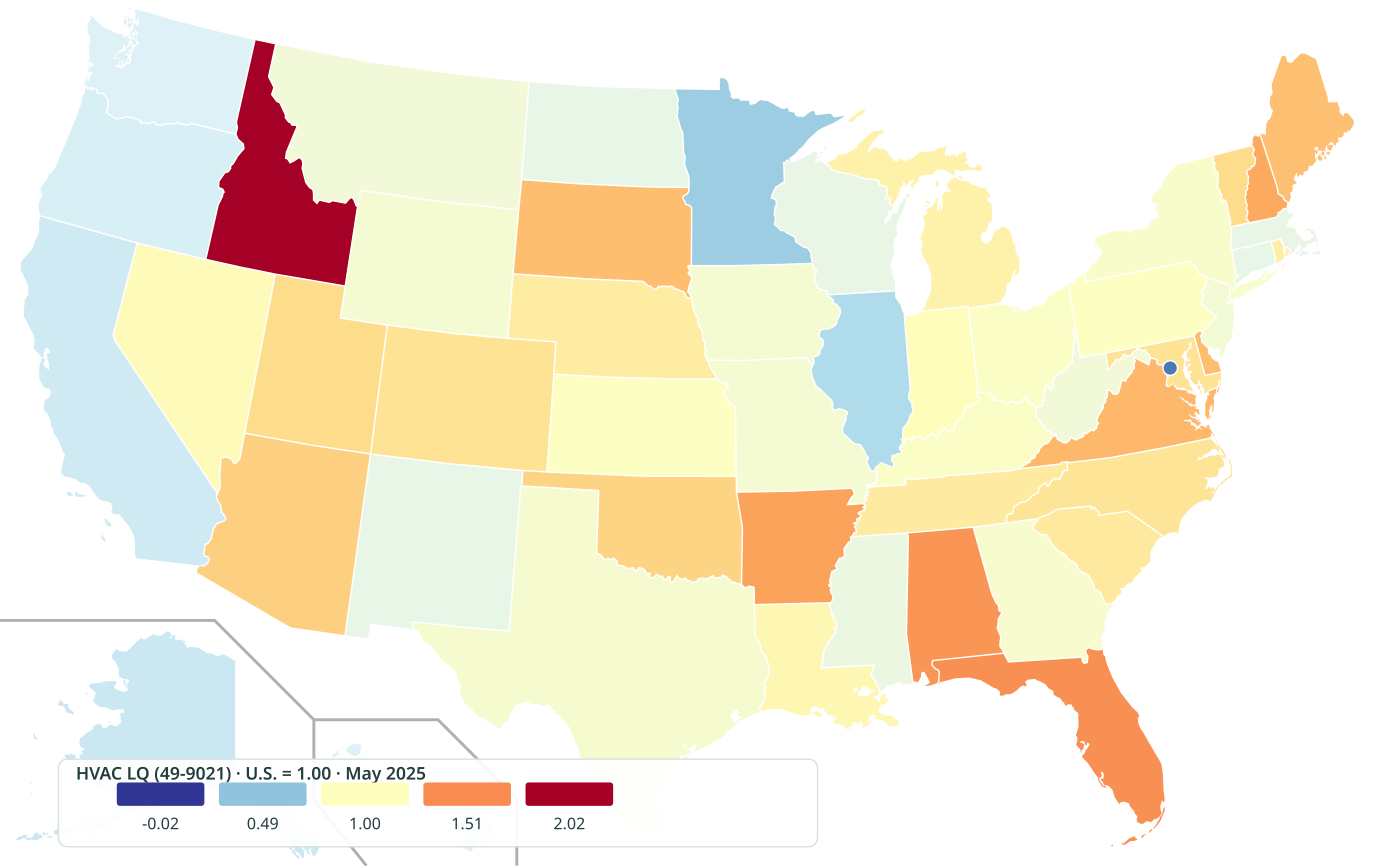
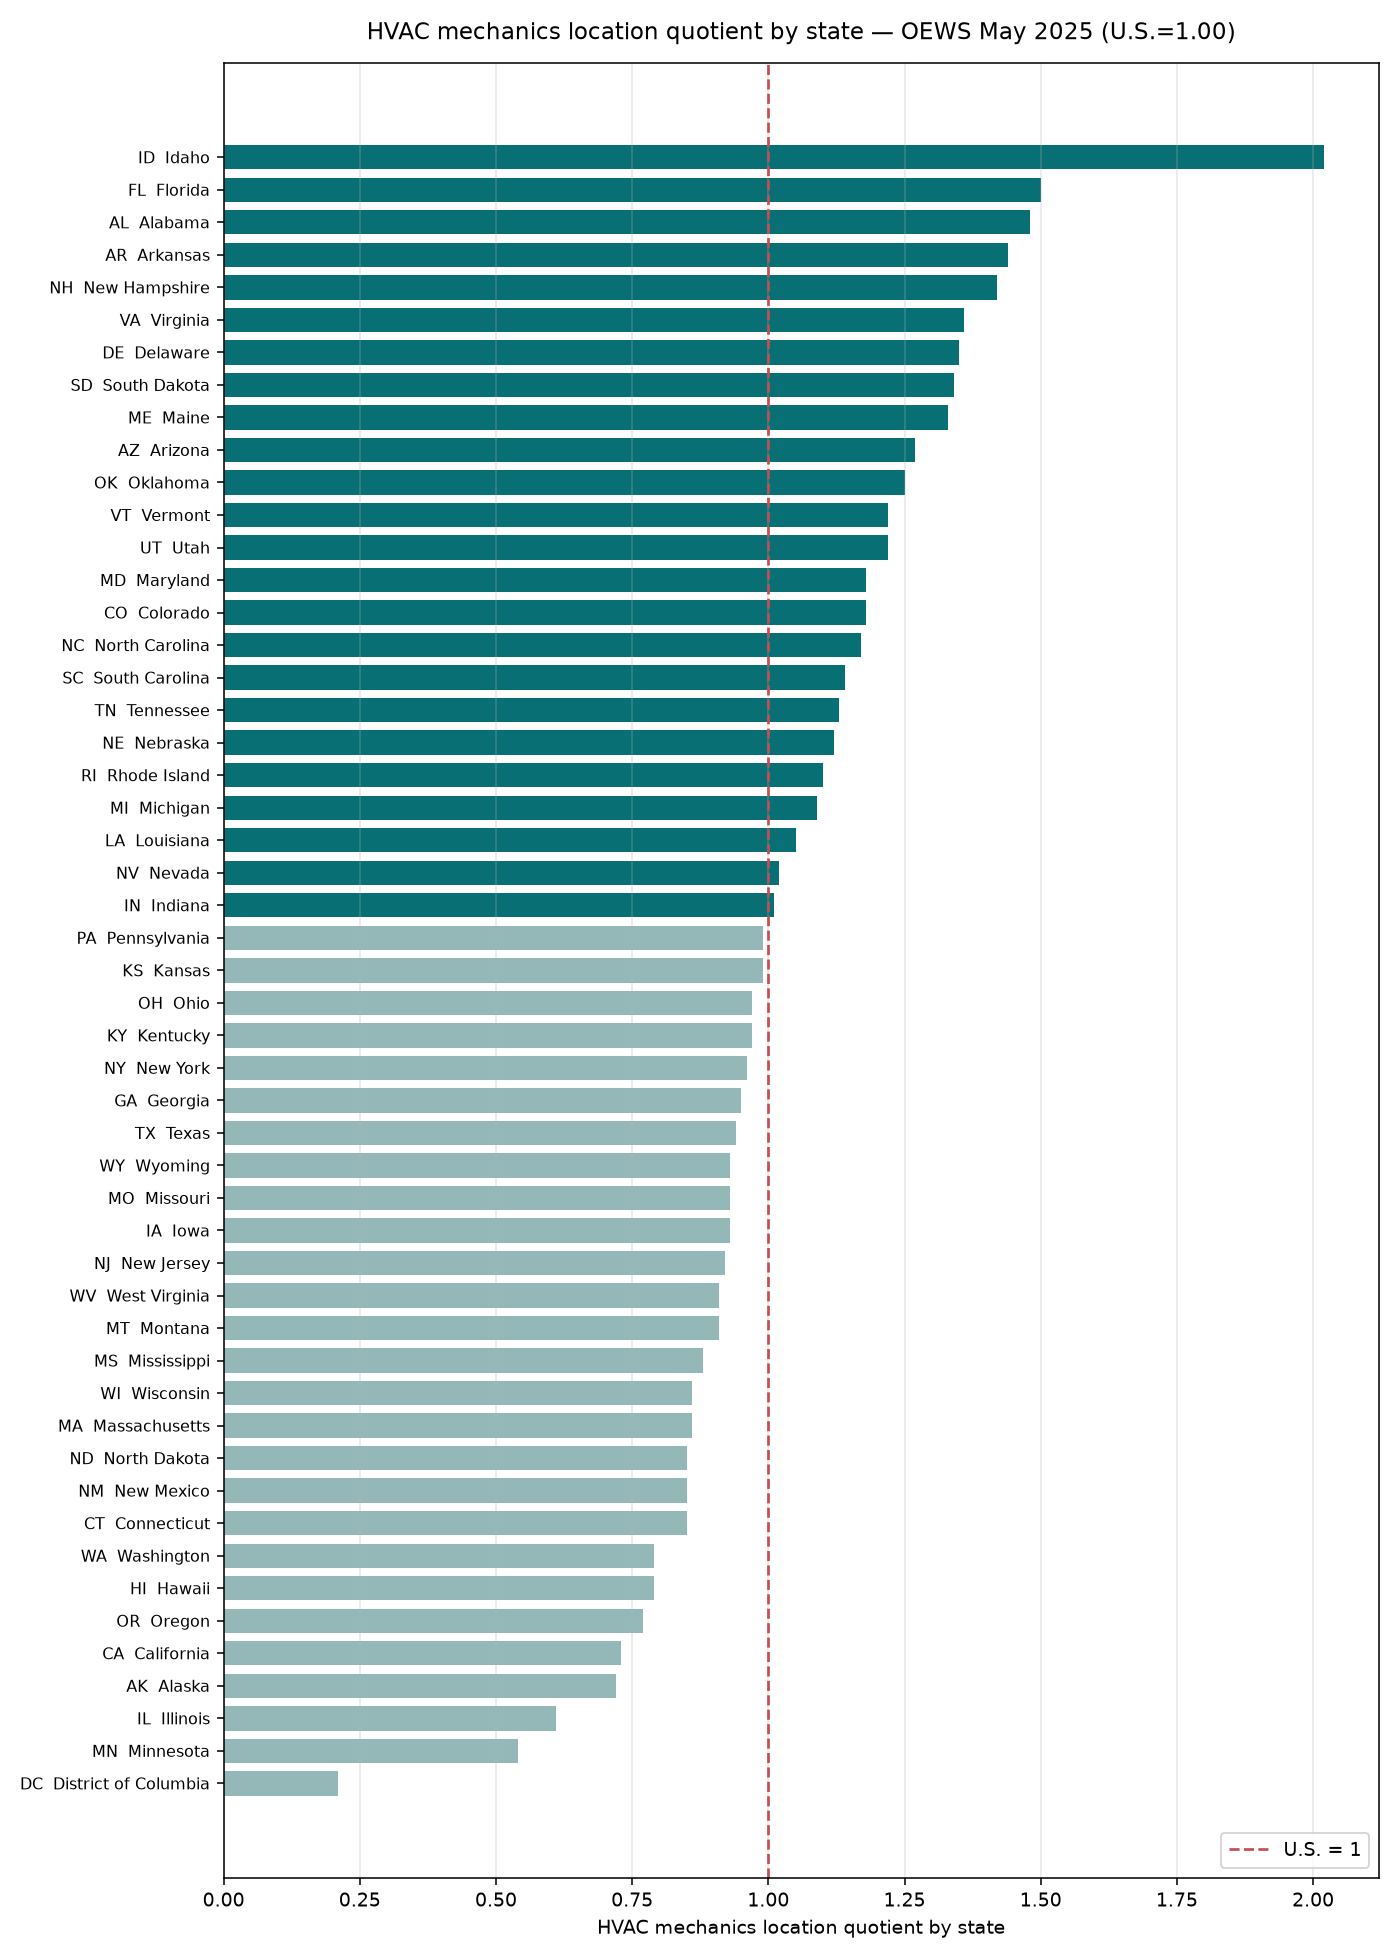
Occupational density is not the same as pay. BLS OEWS May 2025 location quotients show where site-niche trades are most concentrated versus the U.S. average (LQ = 1.00). HVAC mechanics peak in Idaho (LQ 2.02, 5.31/1k); janitors in District of Columbia (LQ 1.64, 23.36/1k); landscaping in Hawaii (LQ 1.83, 11.22/1k); childcare in North Dakota (LQ 2.81, 9.37/1k) (VT suppressed); cosmetologists in New Jersey (LQ 1.84, 3.62/1k). Across all five trades, mean LQ is highest in Idaho (1.46) and lowest in District of Columbia (0.65). Denominator: jobs per 1,000 employed in the area (OEWS), not per 1,000 population.
Key stats (OEWS May 2025)
- U.S. jobs per 1,000 employed (OEWS May 2025): janitors 14.22; landscaping 6.13; childcare 3.33; HVAC 2.63; cosmetologists 1.97.
- HVAC (49-9021): highest LQ Idaho 2.02 (5.31 jobs/1k, emp 4,550); lowest District of Columbia 0.21 · 51 jurisdictions ranked.
- Janitors (37-2011): highest LQ District of Columbia 1.64 (23.36 jobs/1k, emp 16,400); lowest North Carolina 0.76 · 51 jurisdictions ranked.
- Landscaping (37-3011): highest LQ Hawaii 1.83 (11.22 jobs/1k, emp 7,040); lowest District of Columbia 0.19 · 51 jurisdictions ranked.
- Childcare (39-9011): highest LQ North Dakota 2.81 (9.37 jobs/1k, emp 4,030); lowest Washington 0.37 · 50 jurisdictions ranked.
- Cosmetologists (39-5012): highest LQ New Jersey 1.84 (3.62 jobs/1k, emp 15,500); lowest Mississippi 0.45 · 51 jurisdictions ranked.
- Mean LQ across five trades: top Idaho 1.46, Maine 1.41, Nebraska 1.37; bottom District of Columbia 0.65, Oregon 0.79, Kentucky 0.82 · 50 states/DC with all five published.
- Suppressed: Vermont childcare worker estimates are blank (never zero-filled). Tree trimmers and barbers have wider suppression — see CSV optional columns.
Distinct from companion pages on this site:
- Density ≠ wages. Occupation wages by state reports OEWS median $/hour for similar SOCs. This page ranks concentration (LQ and jobs per 1,000 employed) — a high-LQ state can still have modest pay, and vice versa.
- Occupation ≠ industry payroll. Employer pay and typical location size by state uses QCEW industry average pay and mean employees per establishment. OEWS counts jobs in an occupation across industries.
- Jobs ≠ establishments. Industry statistics hubs (cleaning, landscaping, HVAC, salon) lead with CBP/NES establishment and receipt counts — not occupational location quotients.
- Not a hiring-tightness score. This is not openings/unemployment or a “best state to hire” index. High LQ means the occupation is more common in the local employment mix — not that workers are easy or cheap to hire.
Map & charts



Ranked state table
Primary sort: mean location quotient across the five primary occupations (equal weight). Em dashes mark suppressed cells. Jobs/1k shown for HVAC as a density companion; full employment and optional SOCs (tree trimmers, preschool teachers, barbers) are in the CSV.
| Rank | State | Mean LQ | HVAC LQ | HVAC /1k | Janitors LQ | Landscaping LQ | Childcare LQ | Cosmetologists LQ |
|---|---|---|---|---|---|---|---|---|
| 1 | Idaho | 1.46 | 2.02 | 5.31 | 0.89 | 1.52 | 1.55 | 1.34 |
| 2 | Maine | 1.41 | 1.33 | 3.51 | 1.01 | 1.63 | 2.33 | 0.77 |
| 3 | Nebraska | 1.37 | 1.12 | 2.95 | 0.88 | 1.16 | 2.75 | 0.94 |
| 4 | New Jersey | 1.36 | 0.92 | 2.41 | 1.11 | 1.16 | 1.75 | 1.84 |
| 5 | Connecticut | 1.34 | 0.85 | 2.24 | 1.19 | 1.30 | 2.12 | 1.23 |
| 6 | North Dakota | 1.32 | 0.85 | 2.25 | 1.10 | 0.80 | 2.81 | 1.03 |
| 7 | New Hampshire | 1.30 | 1.42 | 3.75 | 0.97 | 1.44 | 1.24 | 1.45 |
| 8 | Delaware | 1.23 | 1.35 | 3.57 | 1.34 | 1.39 | 0.76 | 1.33 |
| 9 | South Dakota | 1.21 | 1.34 | 3.52 | 1.33 | 1.06 | 1.56 | 0.77 |
| 10 | Rhode Island | 1.20 | 1.10 | 2.89 | 1.02 | 1.32 | 1.08 | 1.49 |
| 11 | Colorado | 1.17 | 1.18 | 3.11 | 0.84 | 1.25 | 1.39 | 1.21 |
| 12 | Virginia | 1.15 | 1.36 | 3.57 | 1.13 | 1.00 | 1.02 | 1.26 |
| 13 | Florida | 1.14 | 1.50 | 3.94 | 0.93 | 1.41 | 0.66 | 1.21 |
| 14 | New York | 1.13 | 0.96 | 2.52 | 1.42 | 0.80 | 1.36 | 1.09 |
| 15 | Hawaii | 1.11 | 0.79 | 2.07 | 1.26 | 1.83 | 0.89 | 0.76 |
| 16 | Maryland | 1.08 | 1.18 | 3.10 | 1.03 | 1.03 | 1.06 | 1.08 |
| 17 | Massachusetts | 1.08 | 0.86 | 2.25 | 1.07 | 1.03 | 1.08 | 1.34 |
| 18 | Montana | 1.08 | 0.91 | 2.41 | 1.14 | 1.36 | 1.29 | 0.68 |
| 19 | South Carolina | 1.07 | 1.14 | 3.00 | 0.92 | 1.10 | 1.39 | 0.79 |
| 20 | Michigan | 1.07 | 1.09 | 2.86 | 1.05 | 1.20 | 0.95 | 1.04 |
| 21 | Kansas | 1.05 | 0.99 | 2.62 | 0.84 | 1.08 | 1.55 | 0.77 |
| 22 | Pennsylvania | 1.04 | 0.99 | 2.62 | 1.01 | 0.94 | 0.64 | 1.62 |
| 23 | Missouri | 1.03 | 0.93 | 2.46 | 0.98 | 1.02 | 1.27 | 0.94 |
| 24 | Arkansas | 1.02 | 1.44 | 3.80 | 1.05 | 0.83 | 1.24 | 0.55 |
| 25 | New Mexico | 1.02 | 0.85 | 2.23 | 1.16 | 0.94 | 1.42 | 0.72 |
| 26 | Utah | 1.02 | 1.22 | 3.21 | 1.00 | 1.21 | 0.83 | 0.82 |
| 27 | Iowa | 1.01 | 0.93 | 2.46 | 1.08 | 0.92 | 1.16 | 0.96 |
| 28 | Tennessee | 1.01 | 1.13 | 2.97 | 0.82 | 0.91 | 1.25 | 0.94 |
| 29 | Oklahoma | 1.00 | 1.25 | 3.31 | 0.97 | 0.89 | 1.33 | 0.57 |
| 30 | Wyoming | 1.00 | 0.93 | 2.46 | 1.19 | 1.04 | 1.19 | 0.65 |
| 31 | Arizona | 0.99 | 1.27 | 3.35 | 0.83 | 1.13 | 0.51 | 1.23 |
| 32 | Nevada | 0.98 | 1.02 | 2.69 | 1.49 | 1.05 | 0.72 | 0.64 |
| 33 | Illinois | 0.98 | 0.61 | 1.60 | 1.08 | 0.93 | 1.17 | 1.10 |
| 34 | Indiana | 0.96 | 1.01 | 2.67 | 1.08 | 0.98 | 0.78 | 0.94 |
| 35 | Louisiana | 0.94 | 1.05 | 2.78 | 1.00 | 0.72 | 1.24 | 0.71 |
| 36 | Georgia | 0.94 | 0.95 | 2.51 | 0.80 | 0.85 | 1.29 | 0.82 |
| 37 | Alabama | 0.94 | 1.48 | 3.91 | 0.84 | 0.93 | 0.65 | 0.79 |
| 38 | Ohio | 0.94 | 0.97 | 2.55 | 0.92 | 1.01 | 0.61 | 1.18 |
| 39 | Wisconsin | 0.93 | 0.86 | 2.25 | 1.09 | 1.05 | 0.57 | 1.08 |
| 40 | North Carolina | 0.93 | 1.17 | 3.08 | 0.76 | 1.08 | 0.76 | 0.87 |
| 41 | Minnesota | 0.92 | 0.54 | 1.42 | 1.01 | 0.97 | 1.17 | 0.92 |
| 42 | Mississippi | 0.88 | 0.88 | 2.33 | 0.96 | 0.69 | 1.40 | 0.45 |
| 43 | California | 0.84 | 0.73 | 1.93 | 0.90 | 0.95 | 0.87 | 0.76 |
| 44 | West Virginia | 0.84 | 0.91 | 2.40 | 0.94 | 0.78 | 0.83 | 0.74 |
| 45 | Alaska | 0.83 | 0.72 | 1.89 | 1.12 | 0.54 | 1.24 | 0.52 |
| 46 | Texas | 0.83 | 0.94 | 2.47 | 0.92 | 0.74 | 0.73 | 0.81 |
| 47 | Washington | 0.83 | 0.79 | 2.07 | 0.94 | 1.04 | 0.37 | 0.99 |
| 48 | Kentucky | 0.82 | 0.97 | 2.55 | 0.91 | 0.73 | 0.87 | 0.60 |
| 49 | Oregon | 0.79 | 0.77 | 2.03 | 0.93 | 0.99 | 0.80 | 0.48 |
| 50 | District of Columbia | 0.65 | 0.21 | 0.57 | 1.64 | 0.19 | 0.58 | 0.63 |
| — | Vermont | — | 1.22 | 3.20 | 1.19 | 1.45 | — | 0.73 |
Leaders by occupation
HVAC (SOC 49-9021) — top 5 by location quotient
| Rank | State | LQ | Jobs / 1,000 | Employment |
|---|---|---|---|---|
| 1 | Idaho | 2.02 | 5.31 | 4,550 |
| 2 | Florida | 1.50 | 3.94 | 39,160 |
| 3 | Alabama | 1.48 | 3.91 | 8,260 |
| 4 | Arkansas | 1.44 | 3.80 | 4,960 |
| 5 | New Hampshire | 1.42 | 3.75 | 2,560 |
Janitors (SOC 37-2011) — top 5 by location quotient
| Rank | State | LQ | Jobs / 1,000 | Employment |
|---|---|---|---|---|
| 1 | District of Columbia | 1.64 | 23.36 | 16,400 |
| 2 | Nevada | 1.49 | 21.16 | 32,830 |
| 3 | New York | 1.42 | 20.15 | 195,250 |
| 4 | Delaware | 1.34 | 19.02 | 9,220 |
| 5 | South Dakota | 1.33 | 18.87 | 8,630 |
Landscaping (SOC 37-3011) — top 5 by location quotient
| Rank | State | LQ | Jobs / 1,000 | Employment |
|---|---|---|---|---|
| 1 | Hawaii | 1.83 | 11.22 | 7,040 |
| 2 | Maine | 1.63 | 10.01 | 6,410 |
| 3 | Idaho | 1.52 | 9.31 | 7,980 |
| 4 | Vermont | 1.45 | 8.88 | 2,700 |
| 5 | New Hampshire | 1.44 | 8.85 | 6,050 |
Childcare (SOC 39-9011) — top 5 by location quotient
| Rank | State | LQ | Jobs / 1,000 | Employment |
|---|---|---|---|---|
| 1 | North Dakota | 2.81 | 9.37 | 4,030 |
| 2 | Nebraska | 2.75 | 9.17 | 9,390 |
| 3 | Maine | 2.33 | 7.79 | 4,990 |
| 4 | Connecticut | 2.12 | 7.09 | 12,020 |
| 5 | New Jersey | 1.75 | 5.85 | 25,070 |
Cosmetologists (SOC 39-5012) — top 5 by location quotient
| Rank | State | LQ | Jobs / 1,000 | Employment |
|---|---|---|---|---|
| 1 | New Jersey | 1.84 | 3.62 | 15,500 |
| 2 | Pennsylvania | 1.62 | 3.19 | 19,350 |
| 3 | Rhode Island | 1.49 | 2.93 | 1,470 |
| 4 | New Hampshire | 1.45 | 2.86 | 1,950 |
| 5 | Idaho | 1.34 | 2.63 | 2,250 |
How to read an LQ: 1.00 = same share of local employment as the U.S. average. 1.50 ≈ 50% more concentrated than average. 0.50 ≈ half the U.S. share. LQ uses OEWS employment shares — not population, not establishment counts, and not wage levels.
Related research
- Occupation wages by state (OEWS) — median hourly pay for overlapping SOCs.
- Data center boom by state — where large AI data centers and new power plants are going up, plus new state laws.
- Are data centers raising power bills? — home and business electricity prices in the top data center states compared with every other state, 2019 to 2026.
- AI-proof jobs by state — the share of each state’s jobs in work BLS rates as most and least exposed to AI, including electricians, plumbers and HVAC techs.
- Employer pay & typical location size — QCEW industry pay and mean emp/establishment.
- Cleaning, landscaping, HVAC, salon industry statistics — establishment-side CBP/NES.
- Unemployment vs service hiring — labor-market tightness companion (not occupation density).
- AI use among construction and trade businesses — how many businesses say they used AI in the last two weeks, by state and by industry (Census survey).
- Trade jobs vs. tech jobs since ChatGPT — how job postings for construction, maintenance and engineering compare with software and data jobs since 2020, plus electricians by state.
Forming an LLC while you size a local labor market? Compare formation options with ZenBusiness — then come back to density and wage tables before you price jobs.
Methodology
- Source: BLS Occupational Employment and Wage Statistics (OEWS), May 2025 statewide cross-industry estimates via the public OEWS Maps API (
data.bls.gov/oesmap/getMapData,sourceTbl=oe_data_pub, release2025A01). - Primary SOC codes: 37-2011 Janitors and Cleaners (except maids); 37-3011 Landscaping and Groundskeeping Workers; 49-9021 HVAC Mechanics and Installers; 39-9011 Childcare Workers; 39-5012 Hairdressers, Hairstylists, and Cosmetologists.
- Optional CSV SOCs: 37-3013 Tree Trimmers and Pruners; 25-2011 Preschool Teachers (except special education); 39-5011 Barbers — published where not suppressed.
- Metrics: BLS published Employment (datatype 01), Employment per 1,000 jobs (16), and Location Quotient (17). We do not invent LQs; missing cells stay blank.
- Denominator: Jobs per 1,000 employed in the OEWS area employment total (not per 1,000 residents). LQ = (area occ share) / (U.S. occ share).
- Composite: Equal-weight mean of the five primary LQs when all five are published. Vermont lacks childcare → no composite rank.
- Geography: 50 states + D.C. Territories (PR, GU, VI) excluded from ranks; raw API responses retained in sources.
- Not advice: Not legal, tax, hiring, or investment advice. High concentration ≠ easy hiring or high margins.
FAQ
Is this the same as the wages-by-state page?
No. Wages-by-state shows OEWS median hourly (and annual) pay. This page shows how common each occupation is in the local job mix (LQ and jobs per 1,000 employed) using the same May 2025 OEWS vintage family.
Why jobs per 1,000 employed instead of per 1,000 people?
That is BLS’s published OEWS density measure: occupational employment divided by total OEWS employment in the area, times 1,000. It answers “share of jobs,” not “workers per resident.”
Does a high LQ mean wages are high?
Not necessarily. Concentration and pay are different OEWS fields. Cross-check wages by state for dollar levels.
Why is Vermont missing for childcare?
BLS suppressed the May 2025 childcare worker estimate for Vermont. We leave LQ, jobs/1k, and employment blank rather than inventing values — so Vermont also has no five-trade mean LQ.
Are maids included with janitors?
No. Primary janitor series is SOC 37-2011 (except maids and housekeeping cleaners). Maids/housekeeping cleaners are 37-2012 and are not in the five-trade composite.
Can I download the data?
Yes — CSV below includes employment, jobs per 1,000, LQ, ranks, and RSEs for primary and optional occupations.
Sources
| Source | What we used |
|---|---|
| BLS OEWS / OEWS Maps | May 2025 state employment, jobs per 1,000, location quotients (datatypes 01/16/17) |
| OEWS tables | Confirmed May 2025 as current published vintage at build |
| SOC 2018 codes | 37-2011, 37-3011, 49-9021, 39-9011, 39-5012 (+ optional 37-3013, 25-2011, 39-5011) |
Download
Download CSV — trade labor density by state (OEWS May 2025)