Original research · U.S. Energy Information Administration retail electricity data · Updated September 28, 2026
Data through: July 2026 (EIA release of Sep 24, 2026). Next EIA release: Oct 23, 2026. Prices for 2025 and 2026 are preliminary.
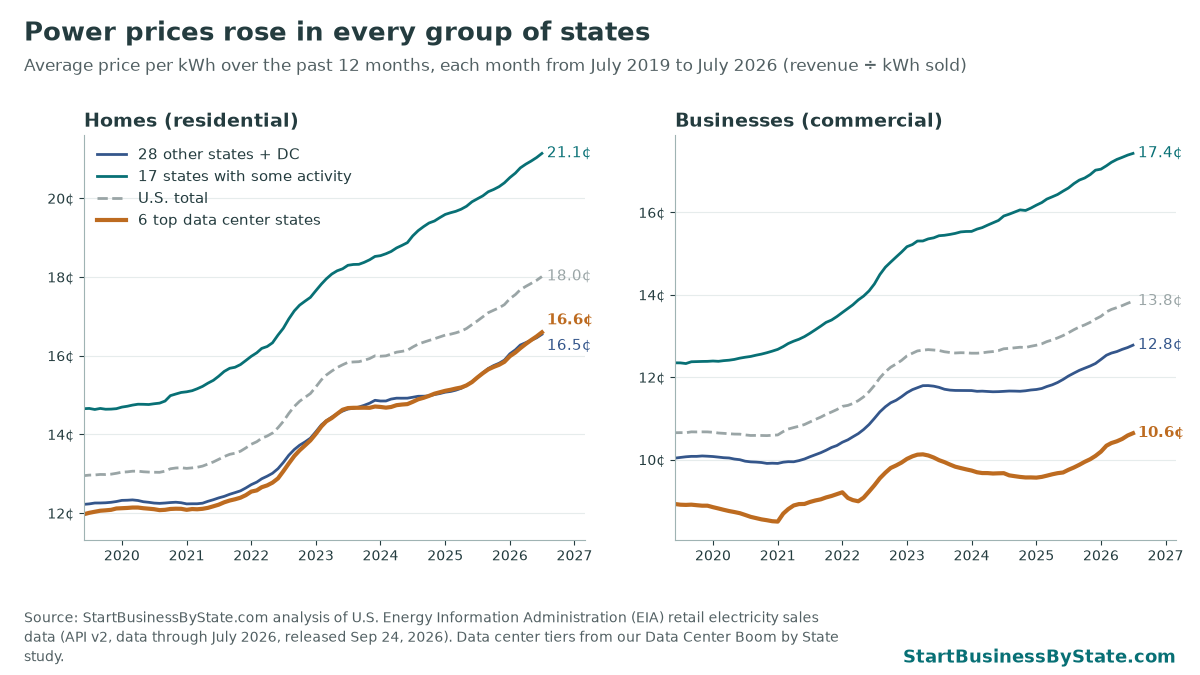
Short answer: the state numbers don’t show a clear link. Power prices went up almost everywhere. In the 6 states with the most data center activity, home electricity prices rose 27.0% since 2022. In the other 45 states and DC they rose 25.3%. That’s a small gap, and since 2019 the top data center states actually rose a little less. The past year is different for businesses. Commercial prices in Ohio and Virginia jumped about 20%, two of the three biggest increases in the country. Higher prices showing up in the same places as data centers does not prove the data centers caused them.
Key findings
- Power got more expensive almost everywhere. The average U.S. home paid 18.01¢ per kWh over the 12 months ending July 2026. That’s up 6.7% from a year earlier and 25.7% since 2022. Home prices rose in 49 of 51 states (counting DC) in the past year. The average home bill went from $128 to $157 a month.
- Home prices in the top data center states rose a bit more since 2022, but not since 2019. In Indiana, Mississippi, Ohio, Texas, Virginia and Wisconsin, home prices rose 27.0% since 2022, compared with 25.3% everywhere else. Since 2019 it was 38.2% vs. 39.1%. Homes in these 6 states still pay less than average: 16.60¢ per kWh vs. 18.43¢.
- Business prices in two data center states jumped this year. Commercial prices rose 20.3% in Ohio and 20.0% in Virginia in the past year. Only DC (20.8%) rose more. Across the 6 top data center states, business prices rose 9.1%, vs. 5.6% elsewhere. But Texas, the state with the most big AI sites on our list, was nearly flat (+0.4%).
- Business power use grew much faster where data centers are. Commercial electricity use in the 6 top data center states rose 30.9% from 2019 to 2026. In the other states it rose 5.8%. Virginia’s rose 62.8%. EIA counts most data centers as commercial customers.
- The biggest home price increases were mostly somewhere else. Since 2022, home prices rose most in District of Columbia (77.4%), Maryland (59.2%), New Jersey (43.5%), Maine (42.1%) and Pennsylvania (40.7%). Ohio (38.2%) is the only top data center state in the top 10. Several of these places share a regional grid with Virginia and Ohio, and data center demand there can raise costs across the whole region (more below).
- More power use did not line up with bigger price increases. Across all 51, states where business power use grew the most tended to have smaller price increases, not bigger ones. The correlation was -0.34 for home prices and -0.62 for business prices since 2019. That doesn’t prove data centers lower prices either. It just means the simple story doesn’t show up in state averages.
Which states count as data center states
We didn’t pick them for this story. We used the groups from our data center map by state, which we built from three sources: big AI data center sites tracked by Epoch AI, new power plants planned for 2026 to 2028 (EIA-860M), and jobs at data processing and hosting firms (BLS). A state that hit 2 or 3 of those marks is one of the 6 top data center states:
- Top data center states (6): Indiana, Mississippi, Ohio, Texas, Virginia, Wisconsin.
- Some activity (17): states that hit one mark, such as Arizona, California, Illinois, Iowa, Nebraska and Tennessee.
- Little or none (28 including DC): the rest.
We also checked a second way: the 10 states with the most planned power at big AI sites on Epoch AI’s list. The results were about the same (see Methods).
Top data center states vs. the rest
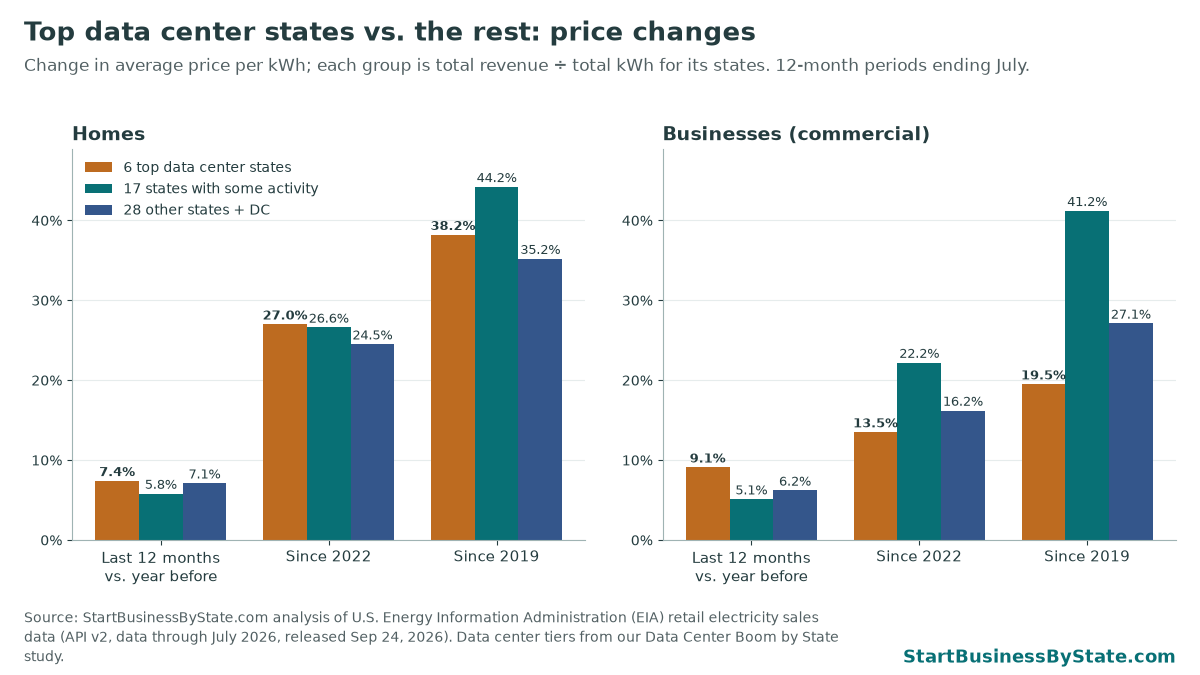
Here are the price changes for each group. Each group price is total revenue ÷ total kWh for all its states, so big states like Texas count more. The median state tells a similar story: in the top data center states, the middle state’s home price rose 24.0% since 2022, vs. 20.8% for the others.
| Group | Home price (12 mo. to Jul 2026) | Home: past year | Home: since 2022 | Home: since 2019 | Business price | Business: past year | Business: since 2022 | Business power use since 2019 |
|---|---|---|---|---|---|---|---|---|
| Top data center states (6) | 16.60¢ | +7.4% | +27.0% | +38.2% | 10.64¢ | +9.1% | +13.5% | +30.9% |
| All other states + DC (45) | 18.43¢ | +6.5% | +25.3% | +39.1% | 14.97¢ | +5.6% | +19.2% | +5.8% |
| Some activity (17) | 21.14¢ | +5.8% | +26.6% | +44.2% | 17.43¢ | +5.1% | +22.2% | +4.0% |
| Little or none (28) | 16.54¢ | +7.1% | +24.5% | +35.2% | 12.78¢ | +6.2% | +16.2% | +7.5% |
Two things stand out. First, homes in the top data center states started out cheaper and are still cheaper. Second, the business price gap over the long run points the other way: since 2019, business prices in the top data center states rose 19.5%, vs. 34.2% elsewhere. Texas pulls that number down. It has a lot of weight, and its business prices barely moved (+7.8% since 2019).
State by state
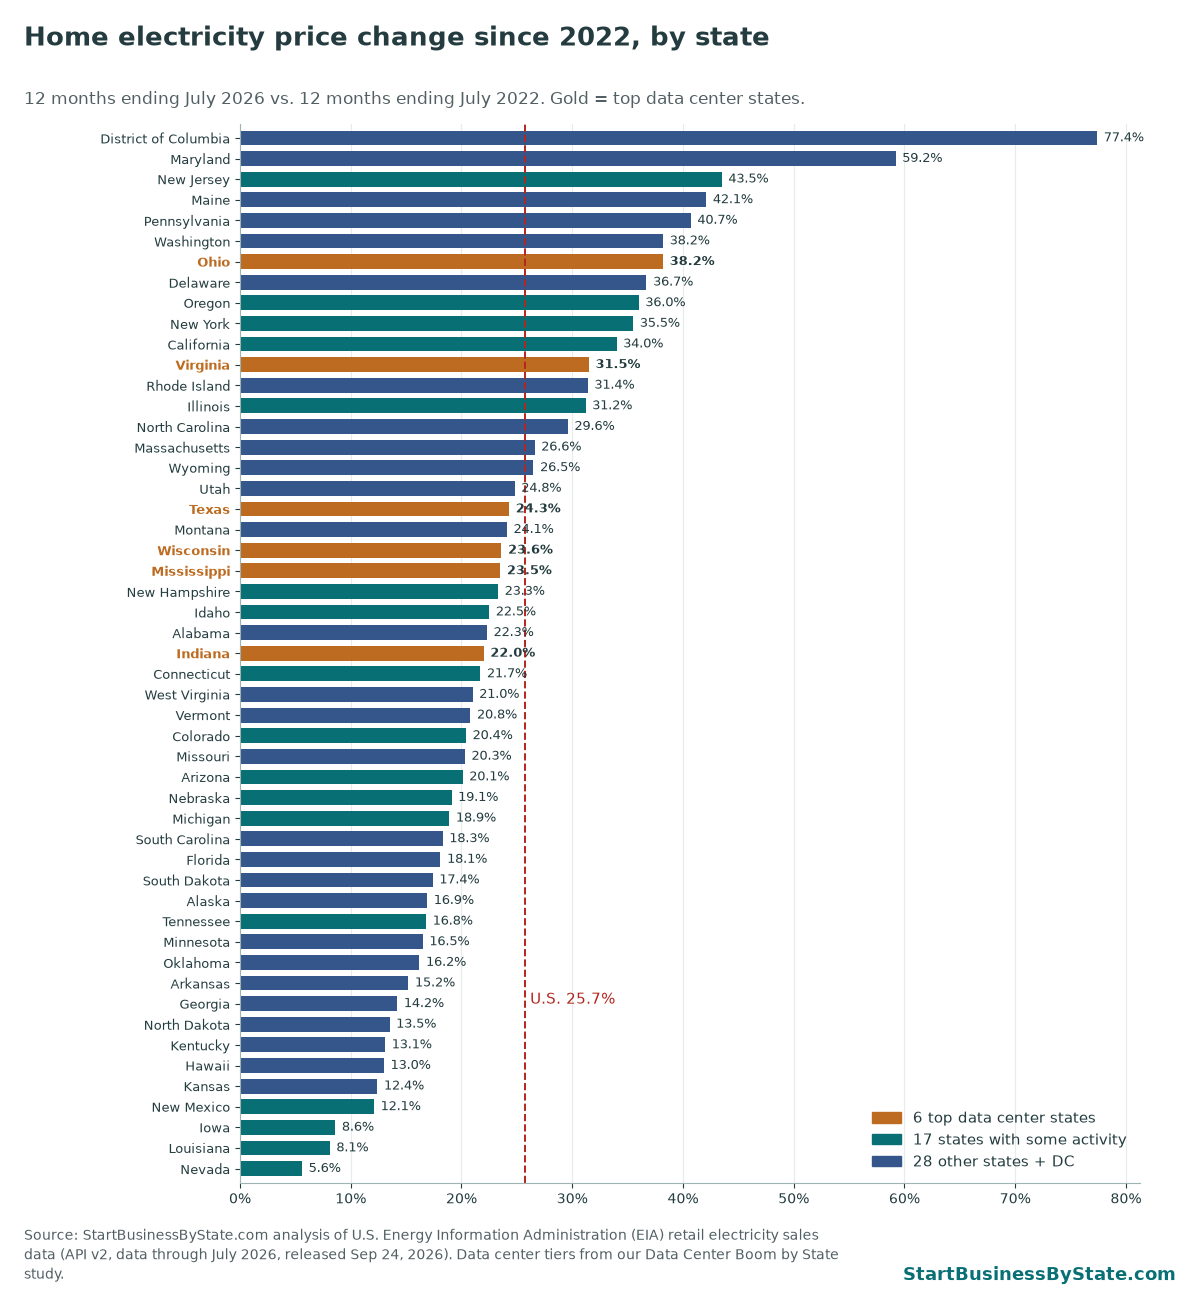
The 6 top data center states land all over the list, from 38.2% (Ohio) down to 22.0% (Indiana). 2 of the 6 are above the U.S. increase of 25.7%.
Many of the biggest increases, including District of Columbia, Maryland, New Jersey and Pennsylvania, are in the area served by PJM, the grid operator for all or part of 13 states and DC. Virginia and Ohio are in PJM too. PJM’s independent market monitor says data center growth is “the primary reason” for recent high prices in PJM’s capacity market, where utilities pay power plants to be ready when demand peaks. It estimates data center load added about $23.1 billion to the cost of three of those auctions. Those costs are shared by customers across the region, not just in the states where data centers are built. So a state’s own data center count isn’t the whole story. (That’s the monitor’s estimate, not ours.)
Other states with big increases, like California, New York and Maine, are not in our top data center group. Prices there rose for reasons this data can’t sort out.
Is there a pattern between power use and prices?
If data centers were pushing up prices on their own, you might expect states where business power use grew fastest to see the biggest price increases. That isn’t what the state data shows.
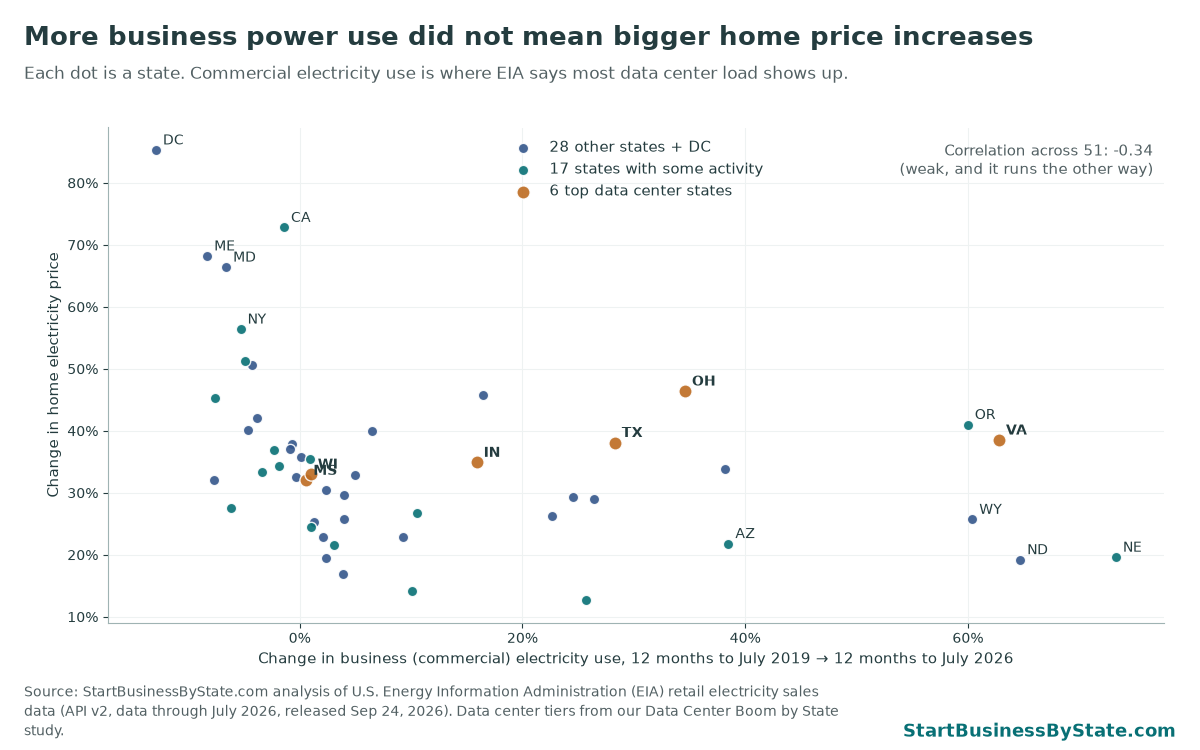
- Nebraska (+73.3%), North Dakota (+64.7%), Virginia (+62.8%), Wyoming and Oregon had the biggest jumps in business power use. Their home prices rose 19.6%, 19.2%, 38.5%, 25.7% and 41.0%. The U.S. rose 38.9%.
- DC, Maryland and Maine used less business power than in 2019, and their home prices rose among the most in the country.
- One possible reason: a lot of a utility’s costs are fixed, like poles, wires and power plants already built. When a utility sells more kWh, those costs get spread thinner. Another: data centers go where power is cheap, like Texas and Nebraska. Neither explanation is proven by this data.
Correlation is not causation. That goes both ways here. A weak link in state averages doesn’t prove data centers have no effect on bills, and a price jump in a data center state doesn’t prove they caused it. Rates are set utility by utility, and new costs from data centers can show up years later as new power lines and plants get built.
Full data table: all 50 states + DC
Click a column heading to sort. Prices are 12-month averages (total revenue ÷ kWh sold) for the 12 months ending July of each year. “Home bill” = average monthly residential bill over the past 12 months; the 2022 figure is in parentheses. Business = EIA’s commercial sector.
| State | Data center group | Home price, 12 mo. to Jul 2026 | Home: past year | Home: since 2022 | Home: since 2019 | Avg. home bill/month (2022) | Business price | Business: past year | Business: since 2022 | Business power use since 2019 |
|---|---|---|---|---|---|---|---|---|---|---|
| U.S. total | 18.01¢ | +6.7% | +25.7% | +38.9% | $157 ($128) | 13.85¢ | +5.9% | +17.3% | +11.4% | |
| Alabama | Other | 16.44¢ | +4.8% | +22.3% | +32.5% | $185 ($158) | 14.71¢ | +4.0% | +19.5% | -0.3% |
| Alaska | Other | 26.85¢ | +5.2% | +16.9% | +19.5% | $158 ($135) | 22.66¢ | +3.2% | +14.3% | +2.4% |
| Arizona | Some activity | 15.40¢ | +1.7% | +20.1% | +21.8% | $162 ($134) | 12.21¢ | -1.6% | +15.2% | +38.5% |
| Arkansas | Other | 13.43¢ | +7.0% | +15.2% | +37.8% | $141 ($129) | 11.25¢ | +7.6% | +15.0% | -0.7% |
| California | Some activity | 32.99¢ | +3.3% | +34.0% | +72.8% | $161 ($128) | 26.98¢ | +4.9% | +32.1% | -1.4% |
| Colorado | Some activity | 16.58¢ | +7.7% | +20.4% | +35.4% | $112 ($95) | 13.11¢ | +8.9% | +17.7% | +0.9% |
| Connecticut | Some activity | 27.99¢ | -7.1% | +21.7% | +27.6% | $196 ($166) | 22.14¢ | -5.4% | +27.7% | -6.2% |
| Delaware | Other | 17.79¢ | +5.7% | +36.7% | +42.1% | $165 ($122) | 13.43¢ | +7.1% | +32.1% | -3.8% |
| District of Columbia | Other | 24.20¢ | +21.9% | +77.4% | +85.3% | $153 ($96) | 22.56¢ | +20.8% | +53.6% | -12.9% |
| Florida | Other | 15.39¢ | +5.5% | +18.1% | +32.8% | $169 ($145) | 11.69¢ | +4.9% | +11.6% | +5.0% |
| Georgia | Other | 15.12¢ | +4.5% | +14.2% | +29.3% | $162 ($145) | 11.49¢ | +0.7% | -0.8% | +24.5% |
| Hawaii | Other | 43.51¢ | +5.6% | +13.0% | +32.0% | $224 ($201) | 39.55¢ | +8.0% | +10.7% | -7.7% |
| Idaho | Some activity | 12.65¢ | +8.9% | +22.5% | +26.7% | $114 ($100) | 9.49¢ | +3.4% | +17.2% | +10.5% |
| Illinois | Some activity | 18.79¢ | +11.4% | +31.2% | +45.3% | $132 ($105) | 13.74¢ | +10.3% | +29.7% | -7.6% |
| Indiana | Top data center state | 16.94¢ | +9.0% | +22.0% | +34.9% | $158 ($133) | 13.93¢ | +4.7% | +15.0% | +15.9% |
| Iowa | Some activity | 14.13¢ | +4.5% | +8.6% | +14.1% | $121 ($114) | 11.28¢ | +5.2% | +7.9% | +10.1% |
| Kansas | Other | 15.09¢ | +5.2% | +12.4% | +16.9% | $132 ($123) | 11.63¢ | +3.3% | +6.4% | +3.9% |
| Kentucky | Other | 13.92¢ | +6.5% | +13.1% | +29.6% | $154 ($135) | 12.40¢ | +5.9% | +9.3% | +4.0% |
| Louisiana | Some activity | 12.99¢ | +5.6% | +8.1% | +34.3% | $156 ($147) | 11.48¢ | +4.7% | +4.3% | -1.9% |
| Maine | Other | 29.31¢ | +10.0% | +42.1% | +68.2% | $156 ($122) | 22.27¢ | +12.9% | +49.9% | -8.3% |
| Maryland | Other | 22.08¢ | +18.9% | +59.2% | +66.4% | $209 ($134) | 16.44¢ | +18.8% | +43.2% | -6.6% |
| Massachusetts | Other | 30.43¢ | +1.1% | +26.6% | +40.2% | $182 ($141) | 24.07¢ | +8.1% | +33.9% | -4.6% |
| Michigan | Some activity | 21.05¢ | +7.4% | +18.9% | +36.9% | $133 ($118) | 15.20¢ | +7.2% | +22.2% | -2.3% |
| Minnesota | Other | 16.22¢ | +4.1% | +16.5% | +22.9% | $120 ($108) | 12.43¢ | +2.5% | +4.9% | +2.1% |
| Mississippi | Top data center state | 14.77¢ | +7.8% | +23.5% | +32.0% | $171 ($142) | 13.66¢ | +7.8% | +21.5% | +0.6% |
| Missouri | Other | 13.95¢ | +5.5% | +20.3% | +25.3% | $145 ($124) | 10.92¢ | +4.7% | +16.1% | +1.3% |
| Montana | Other | 13.84¢ | +9.5% | +24.1% | +25.7% | $115 ($97) | 12.57¢ | +7.7% | +20.4% | +4.0% |
| Nebraska | Some activity | 12.86¢ | +7.4% | +19.1% | +19.6% | $123 ($110) | 8.93¢ | +4.6% | +1.5% | +73.3% |
| Nevada | Some activity | 13.36¢ | -2.3% | +5.6% | +12.7% | $119 ($117) | 9.39¢ | -0.6% | +6.7% | +25.7% |
| New Hampshire | Some activity | 26.67¢ | +13.2% | +23.3% | +33.3% | $171 ($136) | 21.10¢ | +7.0% | +24.5% | -3.4% |
| New Jersey | Some activity | 23.78¢ | +12.2% | +43.5% | +51.2% | $158 ($113) | 17.42¢ | +10.1% | +31.5% | -4.9% |
| New Mexico | Some activity | 15.32¢ | +4.9% | +12.1% | +21.5% | $99 ($89) | 11.02¢ | +1.3% | +1.1% | +3.1% |
| New York | Some activity | 28.39¢ | +11.1% | +35.5% | +56.4% | $167 ($125) | 22.26¢ | +10.2% | +29.2% | -5.3% |
| North Carolina | Other | 14.77¢ | +5.8% | +29.6% | +30.5% | $152 ($122) | 10.52¢ | +1.5% | +22.7% | +2.4% |
| North Dakota | Other | 12.32¢ | +6.6% | +13.5% | +19.2% | $132 ($118) | 7.54¢ | +4.4% | -13.9% | +64.7% |
| Ohio | Top data center state | 18.25¢ | +11.7% | +38.2% | +46.4% | $158 ($117) | 13.17¢ | +20.3% | +30.0% | +34.6% |
| Oklahoma | Other | 13.70¢ | +7.4% | +16.2% | +33.9% | $144 ($134) | 9.20¢ | +2.1% | -4.7% | +38.2% |
| Oregon | Some activity | 15.50¢ | +2.9% | +36.0% | +41.0% | $132 ($106) | 10.55¢ | +1.7% | +13.9% | +60.0% |
| Pennsylvania | Other | 20.70¢ | +12.8% | +40.7% | +50.6% | $174 ($125) | 13.53¢ | +15.8% | +36.9% | -4.3% |
| Rhode Island | Other | 29.27¢ | +0.5% | +31.4% | +37.0% | $164 ($131) | 23.51¢ | -0.4% | +48.8% | -0.9% |
| South Carolina | Other | 15.64¢ | +6.0% | +18.3% | +26.3% | $165 ($145) | 11.56¢ | +5.5% | +7.0% | +22.7% |
| South Dakota | Other | 14.20¢ | +7.6% | +17.4% | +22.9% | $140 ($126) | 11.36¢ | +5.3% | +12.2% | +9.3% |
| Tennessee | Some activity | 13.56¢ | +4.2% | +16.8% | +24.5% | $162 ($139) | 13.25¢ | +4.7% | +16.4% | +1.0% |
| Texas | Top data center state | 15.96¢ | +4.8% | +24.3% | +38.1% | $176 ($149) | 8.62¢ | +0.4% | +1.3% | +28.3% |
| Utah | Other | 13.32¢ | +4.3% | +24.8% | +29.0% | $104 ($81) | 10.35¢ | +4.8% | +25.3% | +26.4% |
| Vermont | Other | 23.80¢ | +5.6% | +20.8% | +35.7% | $141 ($112) | 20.72¢ | +6.5% | +21.6% | +0.1% |
| Virginia | Top data center state | 16.48¢ | +11.5% | +31.5% | +38.5% | $173 ($136) | 10.71¢ | +20.0% | +21.8% | +62.8% |
| Washington | Other | 14.12¢ | +12.7% | +38.2% | +45.7% | $132 ($102) | 11.59¢ | +11.4% | +23.7% | +16.5% |
| West Virginia | Other | 15.48¢ | +0.6% | +21.0% | +39.9% | $163 ($136) | 11.68¢ | -1.1% | +16.7% | +6.5% |
| Wisconsin | Top data center state | 18.74¢ | +6.1% | +23.6% | +33.0% | $124 ($104) | 13.43¢ | +4.9% | +17.2% | +1.0% |
| Wyoming | Other | 14.01¢ | +7.8% | +26.5% | +25.7% | $114 ($96) | 9.68¢ | +1.6% | +1.8% | +60.4% |
What it means for you
Nebraska business preparation. A higher electricity bill is a reason to inspect actual loads and tariffs, not proof that a wiring upgrade will pay for itself. Our guide to starting an electrical business in Nebraska covers state licensing, contractor tax options, insurance and local permits for firms evaluating and delivering electrical work.
Turning an upgrade inquiry into a real job. An Illinois contractor still needs to assess the customer’s equipment, actual tariff and service capacity before proposing electrical changes. Our guide to starting an electrical business in Illinois covers local licensing, permits, coverage and contracts for businesses delivering that work.
- If you pay a home power bill: prices are up almost everywhere, whether or not a data center is nearby. Your own utility’s rate case matters more than any state average. Several states now have new laws about who pays for data center power lines and plants. Our data center tax break tracker lists them.
- If you run a small business: business prices rose fastest this year in DC, Ohio, Virginia, Maryland and Pennsylvania. See the full ranking and what it means in dollars in where business electricity costs rose the most. For costs at your own usage, try our commercial electricity cost calculator.
- If you’re watching a data center proposal near you: ask who pays for the new power lines and plants, and whether the data center has its own rate class. Those decisions affect bills more than the building itself.
What this data can’t tell you
- This is a comparison of state averages. It can’t show what caused a price change. Correlation is not causation.
- Average price is revenue ÷ kWh sold. It includes fixed charges and can move when usage changes, even if rates don’t.
- EIA doesn’t track data centers as their own group. Most are counted as commercial customers, but utilities sort customers their own way, and some big sites are counted as industrial. EIA says many changes in commercial and industrial sales since 2023 come from better reporting of data centers and crypto mining.
- Our data center groups come from a list of big AI sites, planned power plants and hosting jobs. They are not a full count of every data center. Northern Virginia, the biggest data center market, is only partly captured on the AI site list, though Virginia still made the top group.
- Many costs from new data centers, like new power lines and plants, show up in bills years later. A state could see its biggest effects after July 2026.
- 2025 and 2026 figures are preliminary and can be revised. Prices are not adjusted for inflation.
Cite or share this data
Reporters and bloggers are welcome to use the charts and numbers. Please credit and link to this page.
Source: StartBusinessByState.com analysis of U.S. Energy Information Administration retail electricity sales data. https://startbusinessbystate.com/data-center-electricity-prices-by-state/
Methods and sources
- Prices. EIA Open Data API v2, electricity retail sales (monthly revenue, kWh sold, customers and average price by state and sector), pulled September 28, 2026, through July 2026. We summed revenue and kWh over 12-month periods ending July (Aug–Jul) and divided. We compare the 12 months ending July 2026 with the same 12 months ending July 2025 (past year), 2022 and 2019. Using full 12-month periods avoids mixing up summer and winter prices.
- Groups. Group prices are total revenue ÷ total kWh for all states in the group. We also report the median state.
- Home bill. 12-month residential revenue ÷ average number of residential customers ÷ 12.
- Data center groups. From our data center map by state (published September 28, 2026). A state is in the top group if it meets 2 or 3 of: 1,000+ MW at big AI sites on Epoch AI’s list (now plus planned), a top-10 state for new power plants planned for 2026–2028 (EIA-860M), or data processing and hosting jobs up 10%+ from 2023 to 2025 with 1,000+ jobs (BLS). We did not change the groups for this story.
- Second check. Using the 10 states with the most planned power at big AI sites instead (Texas, Wisconsin, Ohio, Indiana, Tennessee, New Mexico, Iowa, Louisiana, Virginia, Mississippi): home prices rose 23.9% since 2022 vs. 26.3% for the rest; business prices rose 8.0% in the past year vs. 5.6%.
- Correlation. Pearson correlation across 50 states and DC between the change in commercial kWh sold and the change in average price, both from the 12 months ending July 2019 to the 12 months ending July 2026.
- Missing months. EIA left out a few monthly sales values (5 state-months). Where revenue and price were given, we worked out kWh from them. For Rhode Island commercial in November 2024, we used the average of the months before and after.
- Other sources. PJM figures come from the 2025 State of the Market Report for PJM by Monitoring Analytics. EIA notes on data centers: commercial demand growth in data center states, Virginia commercial sales and sales table notes.
- Source. U.S. Energy Information Administration, Open Data API (same data as the Electric Power Monthly). EIA data is public domain.
FAQ
Are data centers raising electricity prices?
In some places they probably add to costs, especially where the regional grid has to buy more capacity or build new lines. But state averages don’t show a clear pattern. Home prices in the 6 top data center states rose 27.0% since 2022, vs. 25.3% elsewhere.
Which states had the biggest electricity price increases?
For homes since 2022: District of Columbia (77.4%), Maryland (59.2%) and New Jersey (43.5%). For businesses in the past year: DC, Ohio and Virginia, each up about 20%.
Why is Virginia’s price still lower than average?
Virginia started with cheap power. Its average home price was 16.48¢ per kWh over the past 12 months, vs. 18.01¢ for the U.S. Its business price rose 20.0% this year but is still 10.71¢, below the U.S. average of 13.85¢.
How often is this updated?
EIA releases new monthly numbers about eight weeks after each month ends. The next release is due Oct 23, 2026. Check the “Data through” line at the top.