Original research · U.S. Energy Information Administration retail electricity data · Updated September 28, 2026
Data through: July 2026 (EIA release of Sep 24, 2026). Next EIA release: Oct 23, 2026. Prices for 2025 and 2026 are preliminary.
Business electricity got more expensive in 46 of 51 states (counting DC) over the past year. The U.S. average commercial price was 13.85¢ per kWh for the 12 months ending July 2026. That’s up 5.9% from a year earlier and 26.9% since 2021. DC (+20.8%), Ohio (+20.3%) and Virginia (+20.0%) rose the most. For an example shop using 5,000 kWh a month, the U.S. increase works out to about $459 more a year than the year before, and $1,759 more a year than in 2021.
Key findings
- Prices rose almost everywhere. Business electricity prices went up in 46 states and fell in 5 over the past year. 10 states rose 10% or more. The middle state rose 4.9%.
- The biggest one-year jumps were in the mid-Atlantic and Ohio. DC (+20.8%), Ohio (+20.3%), Virginia (+20.0%), Maryland (+18.8%) and Pennsylvania (+15.8%) top the list.
- Since 2021, four places rose by more than half. DC is up 86.5%, Maine 78.5%, Maryland 67.3% and Pennsylvania 58.5%. 23 states rose 25% or more. The U.S. rose 26.9%.
- A few cheap states barely moved. Texas business prices rose just 0.9% since 2021 and are the second lowest in the country at 8.62¢. North Dakota is the lowest (7.54¢) and is down 17.1% since 2021. Hawaii is the highest at 39.55¢.
- In dollars (example): at 5,000 kWh a month, the U.S. average bill went from $654 to $692 a month, or $459 more a year. In DC the same shop would pay $2,331 more a year; in Maryland $1,564; in Ohio $1,335.
- Factories are seeing it too. The U.S. industrial price rose 6.1% in the past year and 29.2% since 2021. Ohio (+25.7%), Maryland (+25.1%) and Pennsylvania (+22.4%) had big one-year jumps.
Looking for this year’s January–June numbers or a bill calculator? Our commercial electricity costs by state page has both. This page looks at full 12-month periods and longer-term change since 2021.
Past year: where business electricity rose most
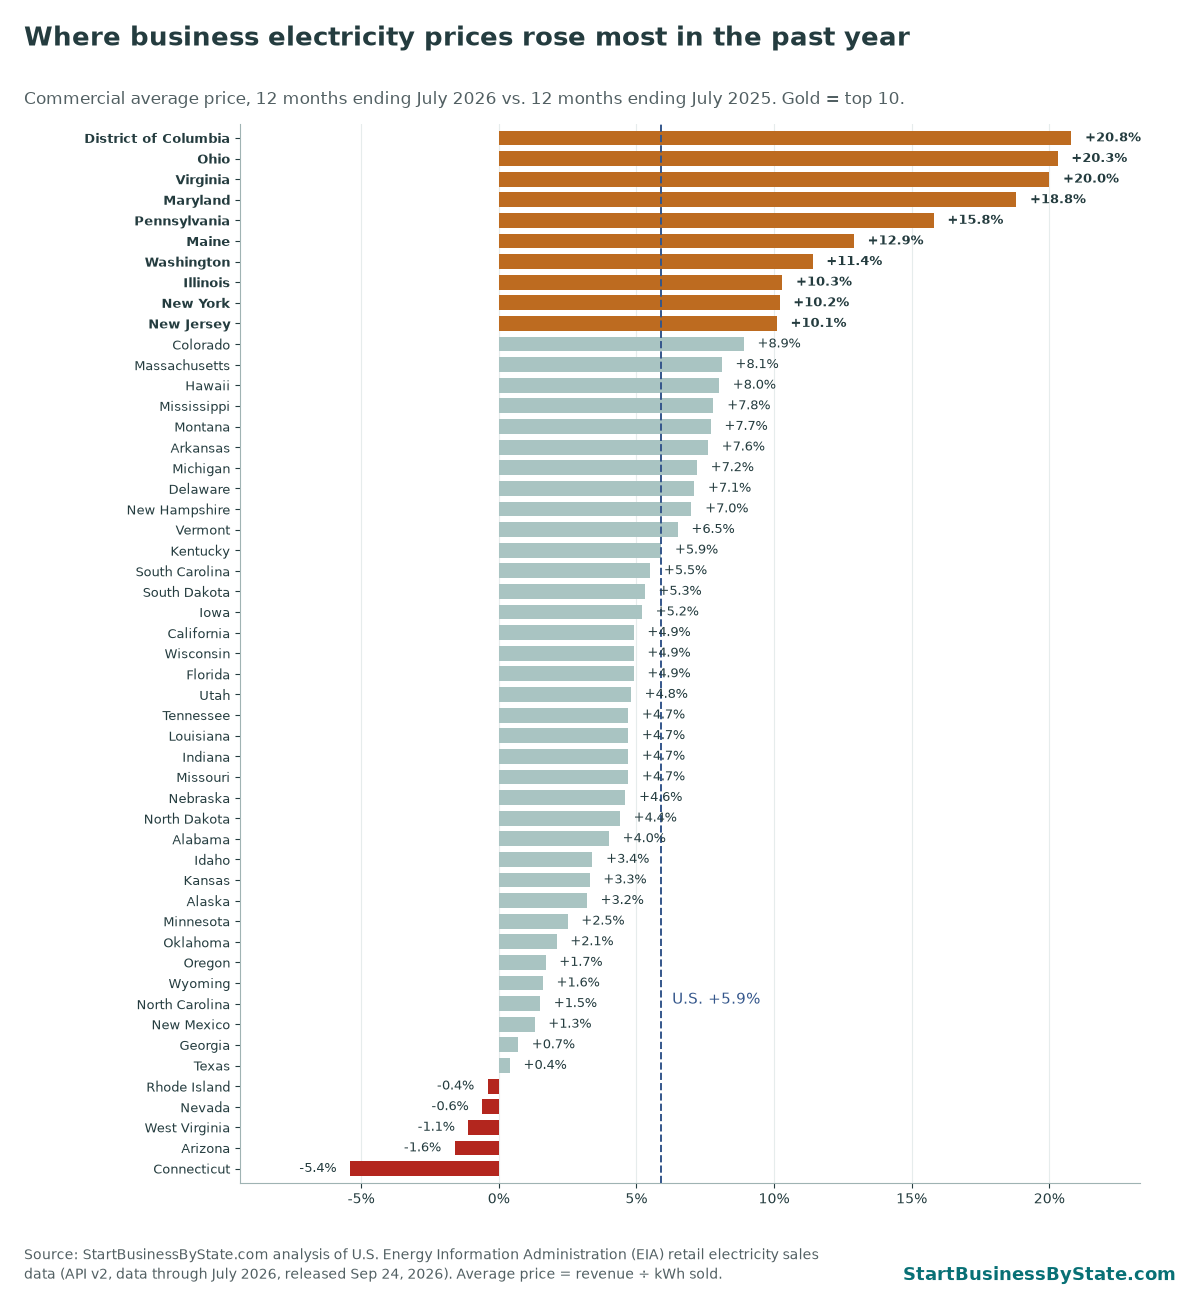
The top 10 for the past year:
- District of Columbia: +20.8% (18.68¢ → 22.56¢)
- Ohio: +20.3% (10.94¢ → 13.17¢)
- Virginia: +20.0% (8.93¢ → 10.71¢)
- Maryland: +18.8% (13.84¢ → 16.44¢)
- Pennsylvania: +15.8% (11.69¢ → 13.53¢)
- Maine: +12.9% (19.71¢ → 22.27¢)
- Washington: +11.4% (10.41¢ → 11.59¢)
- Illinois: +10.3% (12.46¢ → 13.74¢)
- New York: +10.2% (20.19¢ → 22.26¢)
- New Jersey: +10.1% (15.82¢ → 17.42¢)
Prices fell in Rhode Island, Nevada, West Virginia, Arizona and Connecticut. Connecticut fell the most (-5.4%), but it’s still one of the most expensive states at 22.14¢.
Several of the top states, like Ohio and Virginia, also have a lot of data center building. We looked at whether that lines up with higher prices in are data centers raising power bills? Short version: the state numbers don’t show a clear link, and a price jump next to data centers doesn’t prove they caused it.
Since 2021: the longer climb
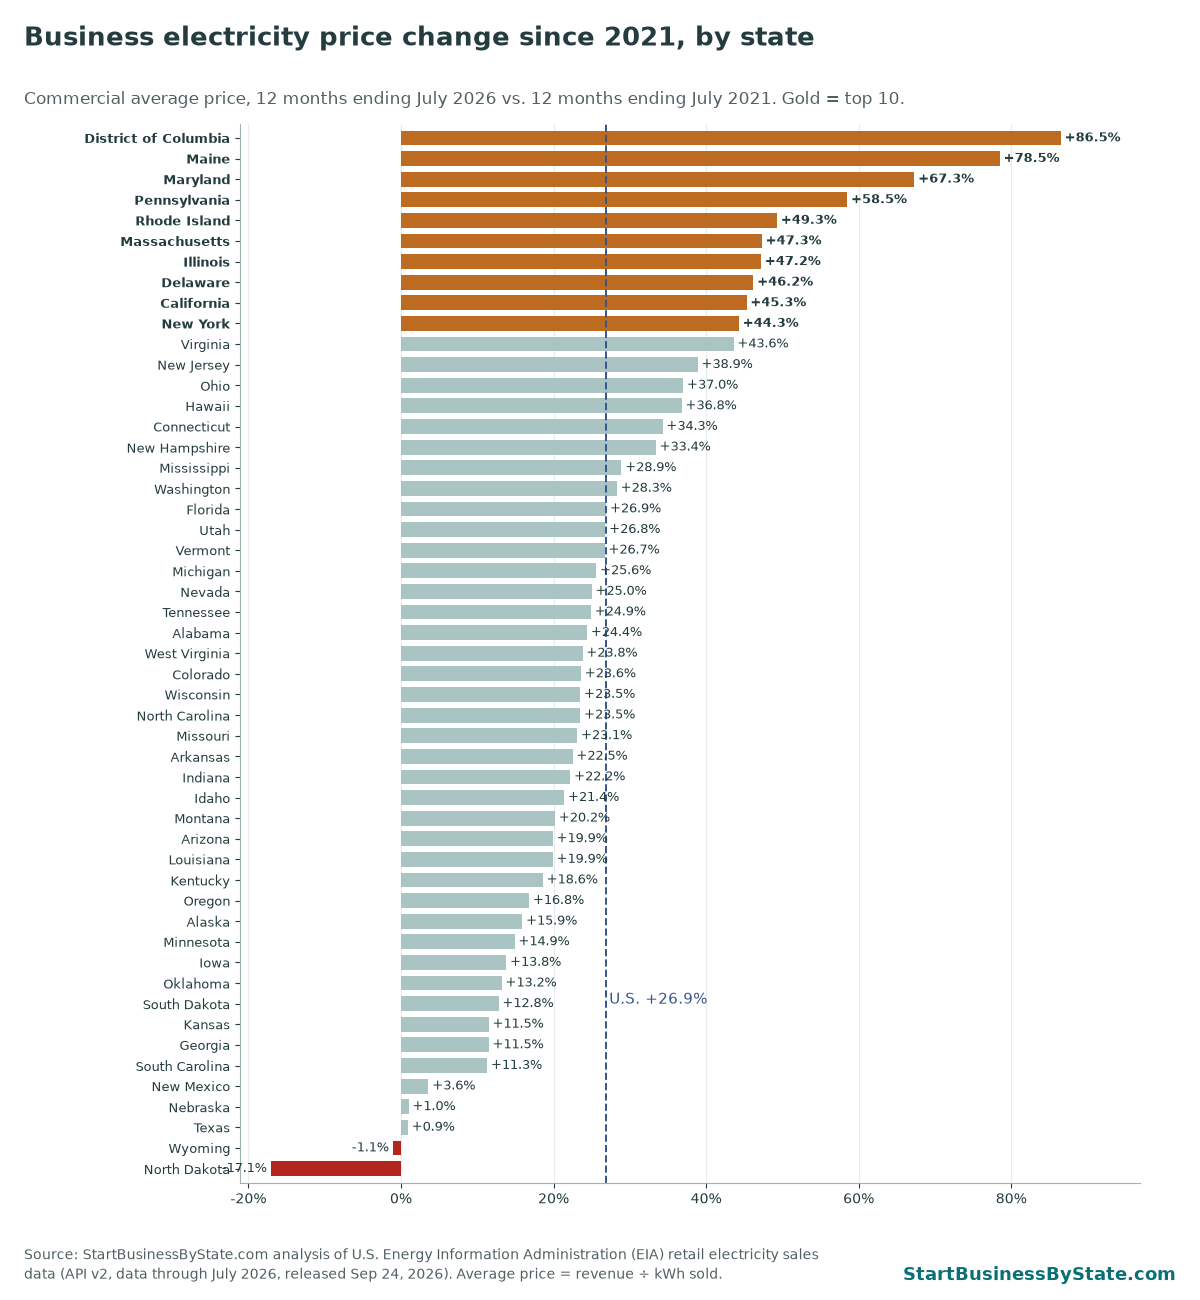
Over five years the order changes. The top of the list is mostly New England and the mid-Atlantic: after DC, Maine, Maryland and Pennsylvania come Rhode Island (49.3%), Massachusetts (47.3%) and Illinois (47.2%). Prices rose in 49 of 51. Only North Dakota and Wyoming are lower than in 2021.
What it means in dollars (example)
Percentages are easier to picture as a bill. Here’s the math for an example business that uses the same amount of power every month. These usage numbers are examples we picked to show the math, not measured averages for any trade. Check the kWh line on your own bill.
| Example usage | Monthly bill at U.S. avg., 12 mo. to Jul 2021 | 12 mo. to Jul 2025 | 12 mo. to Jul 2026 | Extra per year vs. year before | Extra per year vs. 2021 |
|---|---|---|---|---|---|
| 2,000 kWh a month | $218 | $262 | $277 | +$184 | +$703 |
| 5,000 kWh a month | $546 | $654 | $692 | +$459 | +$1,759 |
| 10,000 kWh a month | $1,091 | $1,308 | $1,385 | +$918 | +$3,517 |
Bill = kWh × the U.S. average commercial price over each 12-month period. The average price already includes fixed and demand charges spread over all kWh. For reference, the average U.S. commercial customer used about 6,470 kWh a month over the past year, but that average includes big stores, offices and data centers, so it isn’t a small-shop number.
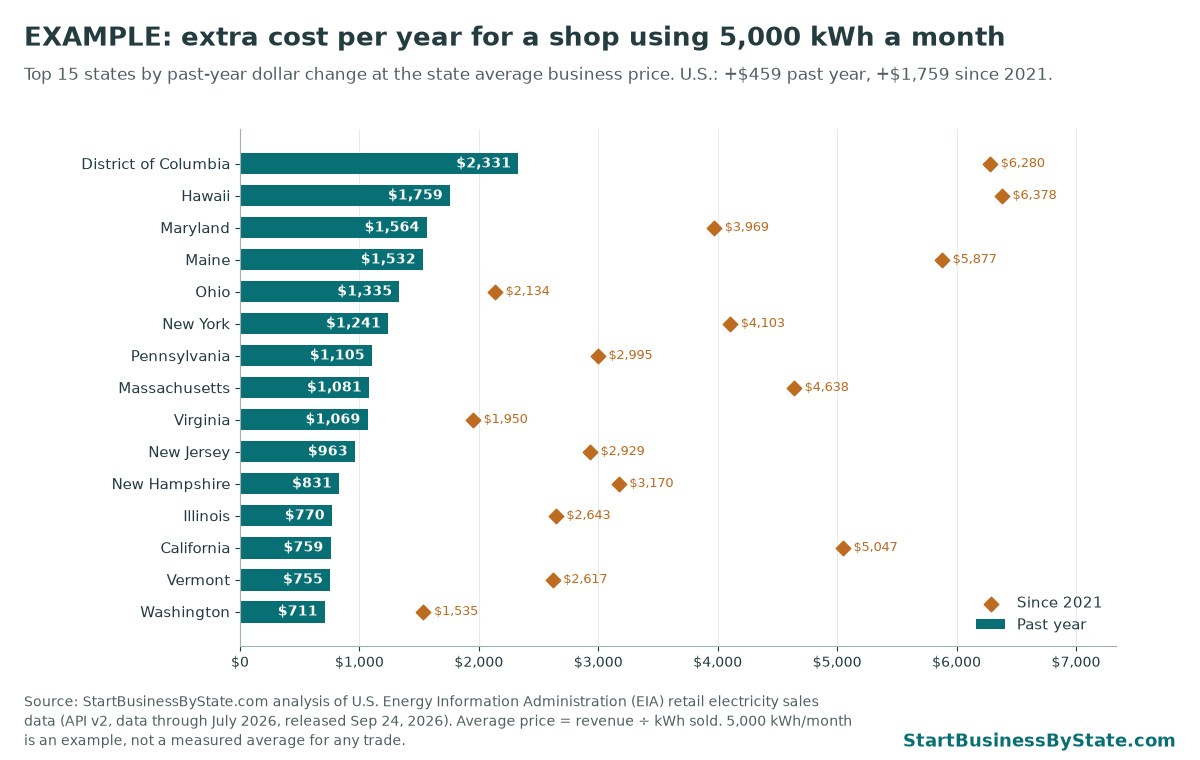
High-price states can top the dollar list even with smaller percent increases. Hawaii rose 8.0%, but because its power already costs 39.55¢, the example shop pays $1,759 more a year.
For power-hungry small businesses
Some small businesses feel this more than others. Restaurants run ovens, fryers, hoods and walk-in coolers. Laundromats run washers, dryers and water heaters for hours. Salons run dryers, lights and air conditioning all day. HVAC and repair shops often run a warehouse, air compressors and shop tools. If power is one of your biggest bills, a few plain steps:
- Find your real numbers. Your bill shows kWh used and, on many business rates, a demand charge based on your highest use at any one time. Divide the total bill by kWh to get your own price per kWh and compare it with your state’s average in the table.
- Ask about your rate. Utilities often have several business rates. Call and ask whether a different one, like a time-of-use rate, would cost less for your hours.
- Spread out big loads. If you pay demand charges, starting every dryer, oven or compressor at once can raise the bill even when total kWh doesn’t change.
- Keep equipment clean. Dirty condenser coils on coolers and ice machines make them run longer.
- Check if you can shop for supply. In some states businesses can buy power from a competing supplier. Your state utility commission’s website will say.
- Build it into prices. If your state is near the top of this list, it may be time to revisit what you charge. For trade-specific numbers, see our HVAC industry statistics and our guide to starting a hair salon.
Electrical contractors. When customers ask about lighting or electrical upgrades, use their actual usage and proposed equipment to assess the project; state averages cannot establish promised savings. Our guide to starting an electrical business in Ohio covers licensing, insurance, local approvals and the business setup behind that work.
Factories and plants (industrial prices)
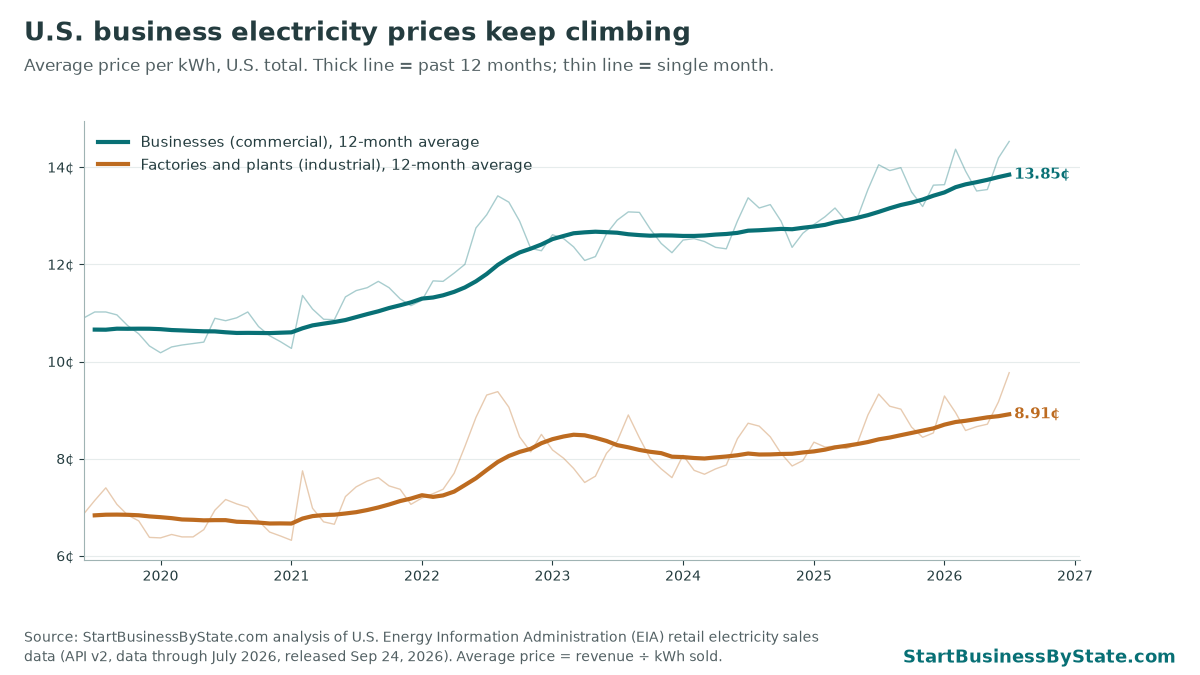
Industrial customers, like factories and big plants, pay less per kWh because they buy so much. Their prices have climbed too: from 6.90¢ in the 12 months ending July 2021 to 8.91¢ now. Industrial prices rose in 46 states in the past year. Both columns are in the full table below.
Full data table: all 50 states + DC
Ranked by past-year change in the average commercial price. Click a column heading to sort. “July only” compares the single month of July 2026 with July 2025, the newest month out. Dollar columns are the example 5,000 kWh-a-month business.
| Rank | State | Business price, 12 mo. to Jul 2026 | Past year | Past year (¢/kWh) | Since 2022 | Since 2021 | July only, vs. July 2025 | Industrial: past year | Industrial: since 2021 | Example: extra per year vs. year before | Example: extra per year vs. 2021 |
|---|---|---|---|---|---|---|---|---|---|---|---|
| U.S. total | 13.85¢ | +5.9% | +0.77¢ | +17.3% | +26.9% | +3.4% | +6.1% | +29.2% | +$459 | +$1,759 | |
| 1 | District of Columbia | 22.56¢ | +20.8% | +3.89¢ | +53.6% | +86.5% | +15.4% | +39.3% | +136.2% | +$2,331 | +$6,280 |
| 2 | Ohio | 13.17¢ | +20.3% | +2.23¢ | +30.0% | +37.0% | +22.3% | +25.7% | +58.0% | +$1,335 | +$2,134 |
| 3 | Virginia | 10.71¢ | +20.0% | +1.78¢ | +21.8% | +43.6% | +14.4% | +9.0% | +61.0% | +$1,069 | +$1,950 |
| 4 | Maryland | 16.44¢ | +18.8% | +2.61¢ | +43.2% | +67.3% | +15.7% | +25.1% | +77.5% | +$1,564 | +$3,969 |
| 5 | Pennsylvania | 13.53¢ | +15.8% | +1.84¢ | +36.9% | +58.5% | +9.7% | +22.4% | +69.4% | +$1,105 | +$2,995 |
| 6 | Maine | 22.27¢ | +12.9% | +2.55¢ | +49.9% | +78.5% | +2.7% | +12.4% | +76.5% | +$1,532 | +$5,877 |
| 7 | Washington | 11.59¢ | +11.4% | +1.18¢ | +23.7% | +28.3% | +4.8% | +4.5% | +25.8% | +$711 | +$1,535 |
| 8 | Illinois | 13.74¢ | +10.3% | +1.28¢ | +29.7% | +47.2% | +11.2% | +7.6% | +48.3% | +$770 | +$2,643 |
| 9 | New York | 22.26¢ | +10.2% | +2.07¢ | +29.2% | +44.3% | +4.9% | +3.9% | +67.3% | +$1,241 | +$4,103 |
| 10 | New Jersey | 17.42¢ | +10.1% | +1.61¢ | +31.5% | +38.9% | +4.4% | +13.2% | +43.7% | +$963 | +$2,929 |
| 11 | Colorado | 13.11¢ | +8.9% | +1.07¢ | +17.7% | +23.6% | +4.2% | +7.0% | +21.8% | +$640 | +$1,502 |
| 12 | Massachusetts | 24.07¢ | +8.1% | +1.80¢ | +33.9% | +47.3% | +4.9% | +2.4% | +34.4% | +$1,081 | +$4,638 |
| 13 | Hawaii | 39.55¢ | +8.0% | +2.93¢ | +10.7% | +36.8% | +24.4% | +8.9% | +39.0% | +$1,759 | +$6,378 |
| 14 | Mississippi | 13.66¢ | +7.8% | +0.99¢ | +21.5% | +28.9% | +7.2% | +6.3% | +31.6% | +$596 | +$1,838 |
| 15 | Montana | 12.57¢ | +7.7% | +0.90¢ | +20.4% | +20.2% | +3.9% | -3.0% | +18.0% | +$539 | +$1,271 |
| 16 | Arkansas | 11.25¢ | +7.6% | +0.80¢ | +15.0% | +22.5% | +10.8% | +1.9% | +9.2% | +$479 | +$1,239 |
| 17 | Michigan | 15.20¢ | +7.2% | +1.01¢ | +22.2% | +25.6% | +10.0% | +6.4% | +21.5% | +$609 | +$1,860 |
| 18 | Delaware | 13.43¢ | +7.1% | +0.89¢ | +32.1% | +46.2% | +10.0% | +17.5% | +47.4% | +$534 | +$2,544 |
| 19 | New Hampshire | 21.10¢ | +7.0% | +1.39¢ | +24.5% | +33.4% | +4.5% | +6.5% | +30.2% | +$831 | +$3,170 |
| 20 | Vermont | 20.72¢ | +6.5% | +1.26¢ | +21.6% | +26.7% | +6.8% | +6.0% | +13.9% | +$755 | +$2,617 |
| 21 | Kentucky | 12.40¢ | +5.9% | +0.69¢ | +9.3% | +18.6% | +2.7% | +6.3% | +31.1% | +$417 | +$1,169 |
| 22 | South Carolina | 11.56¢ | +5.5% | +0.60¢ | +7.0% | +11.3% | +5.8% | +6.8% | +28.3% | +$362 | +$705 |
| 23 | South Dakota | 11.36¢ | +5.3% | +0.57¢ | +12.2% | +12.8% | +3.8% | +7.1% | +14.3% | +$343 | +$775 |
| 24 | Iowa | 11.28¢ | +5.2% | +0.56¢ | +7.9% | +13.8% | +0.7% | +5.4% | +14.4% | +$334 | +$823 |
| 25 | Wisconsin | 13.43¢ | +4.9% | +0.63¢ | +17.2% | +23.5% | +4.2% | +5.8% | +23.5% | +$379 | +$1,536 |
| 25 | California | 26.98¢ | +4.9% | +1.27¢ | +32.1% | +45.3% | +1.6% | +0.4% | +47.8% | +$759 | +$5,047 |
| 25 | Florida | 11.69¢ | +4.9% | +0.54¢ | +11.6% | +26.9% | +0.6% | +5.8% | +22.8% | +$325 | +$1,485 |
| 28 | Utah | 10.35¢ | +4.8% | +0.47¢ | +25.3% | +26.8% | +3.9% | +4.3% | +42.4% | +$283 | +$1,314 |
| 29 | Louisiana | 11.48¢ | +4.7% | +0.52¢ | +4.3% | +19.9% | -5.3% | +7.0% | +14.4% | +$311 | +$1,145 |
| 29 | Missouri | 10.92¢ | +4.7% | +0.49¢ | +16.1% | +23.1% | +3.5% | +4.9% | +25.4% | +$292 | +$1,229 |
| 29 | Tennessee | 13.25¢ | +4.7% | +0.59¢ | +16.4% | +24.9% | +4.8% | +1.3% | +27.4% | +$355 | +$1,586 |
| 29 | Indiana | 13.93¢ | +4.7% | +0.63¢ | +15.0% | +22.2% | -5.5% | +7.6% | +29.8% | +$375 | +$1,521 |
| 33 | Nebraska | 8.93¢ | +4.6% | +0.39¢ | +1.5% | +1.0% | -1.9% | +4.7% | +12.0% | +$234 | +$55 |
| 34 | North Dakota | 7.54¢ | +4.4% | +0.32¢ | -13.9% | -17.1% | +5.5% | +7.4% | +10.6% | +$192 | −$932 |
| 35 | Alabama | 14.71¢ | +4.0% | +0.56¢ | +19.5% | +24.4% | +1.6% | +3.6% | +26.8% | +$338 | +$1,729 |
| 36 | Idaho | 9.49¢ | +3.4% | +0.31¢ | +17.2% | +21.4% | +5.9% | +2.0% | +26.3% | +$185 | +$1,004 |
| 37 | Kansas | 11.63¢ | +3.3% | +0.37¢ | +6.4% | +11.5% | +3.1% | +5.0% | +12.9% | +$224 | +$721 |
| 38 | Alaska | 22.66¢ | +3.2% | +0.69¢ | +14.3% | +15.9% | +1.3% | +14.1% | +39.2% | +$416 | +$1,869 |
| 39 | Minnesota | 12.43¢ | +2.5% | +0.30¢ | +4.9% | +14.9% | +2.4% | +5.1% | +21.0% | +$179 | +$967 |
| 40 | Oklahoma | 9.20¢ | +2.1% | +0.18¢ | -4.7% | +13.2% | +4.0% | +8.6% | +31.6% | +$111 | +$643 |
| 41 | Oregon | 10.55¢ | +1.7% | +0.17¢ | +13.9% | +16.8% | +0.1% | +1.8% | +41.3% | +$104 | +$913 |
| 42 | Wyoming | 9.68¢ | +1.6% | +0.15¢ | +1.8% | -1.1% | +1.0% | +1.9% | +25.3% | +$93 | −$66 |
| 43 | North Carolina | 10.52¢ | +1.5% | +0.15¢ | +22.7% | +23.5% | +10.1% | +0.5% | +27.0% | +$91 | +$1,200 |
| 44 | New Mexico | 11.02¢ | +1.3% | +0.14¢ | +1.1% | +3.6% | -4.5% | -5.5% | -7.5% | +$84 | +$228 |
| 45 | Georgia | 11.49¢ | +0.7% | +0.08¢ | -0.8% | +11.5% | +0.4% | -1.5% | +28.8% | +$48 | +$713 |
| 46 | Texas | 8.62¢ | +0.4% | +0.03¢ | +1.3% | +0.9% | -4.3% | +5.7% | +15.8% | +$19 | +$48 |
| 47 | Rhode Island | 23.51¢ | -0.4% | -0.10¢ | +48.8% | +49.3% | +5.4% | +1.0% | +34.9% | −$58 | +$4,658 |
| 48 | Nevada | 9.39¢ | -0.6% | -0.06¢ | +6.7% | +25.0% | -4.1% | +6.3% | +47.3% | −$36 | +$1,129 |
| 49 | West Virginia | 11.68¢ | -1.1% | -0.13¢ | +16.7% | +23.8% | +2.2% | +4.2% | +37.4% | −$78 | +$1,349 |
| 50 | Arizona | 12.21¢ | -1.6% | -0.20¢ | +15.2% | +19.9% | -2.2% | -4.1% | +19.2% | −$121 | +$1,218 |
| 51 | Connecticut | 22.14¢ | -5.4% | -1.27¢ | +27.7% | +34.3% | -13.1% | -4.5% | +62.9% | −$764 | +$3,393 |
What this data can’t tell you
- These are state averages across all business customers, from corner shops to big office towers and data centers. Your own rate can be higher or lower.
- Average price is revenue ÷ kWh sold. It can change when the mix of customers or their usage changes, even if posted rates don’t.
- The dollar figures use example usage, not real bills. They hold usage the same every month and don’t model demand charges, taxes or fees separately.
- The data doesn’t say why prices rose. Fuel costs, new power lines, storm costs and demand from big new customers can all play a part, and this page doesn’t sort them out.
- 2025 and 2026 figures are preliminary and can be revised. Prices are not adjusted for inflation.
Cite or share this data
Reporters and bloggers are welcome to use the charts and numbers. Please credit and link to this page.
Source: StartBusinessByState.com analysis of U.S. Energy Information Administration retail electricity sales data. https://startbusinessbystate.com/business-electricity-cost-increase-by-state/
Methods and sources
- Data. EIA Open Data API v2, electricity retail sales: monthly revenue, kWh sold, customers and average price for the commercial and industrial sectors in each state, pulled September 28, 2026, through July 2026.
- 12-month prices. We summed revenue and kWh over 12-month periods ending July (August through July) and divided. “Past year” compares the 12 months ending July 2026 with the 12 months ending July 2025. “Since 2021” and “since 2022” compare with the 12 months ending July 2021 and July 2022. Full 12-month periods avoid mixing summer and winter prices.
- July only. EIA’s published average price for July 2026 vs. July 2025.
- Example bills. Example kWh × each period’s average price. Yearly change = example kWh × 12 × the change in price. The kWh amounts are round examples, not averages for any trade.
- Missing months. EIA left out a few values (2 state-months). Rhode Island commercial for November 2024 and West Virginia industrial for May 2026 had no revenue or kWh; we used the average kWh of the months before and after, times EIA’s price for that month.
- Ranks. Ties share a rank. Close ranks are not meaningful differences.
- Source. U.S. Energy Information Administration, Open Data API (same data as the Electric Power Monthly). EIA data is public domain.
FAQ
Which state had the biggest business electricity price increase?
DC, up 20.8% over the past year. Among states, Ohio (20.3%) and Virginia (20.0%) were next.
How much have business electricity prices gone up since 2021?
The U.S. average commercial price is up 26.9%, from 10.91¢ to 13.85¢ per kWh (12 months ending July of each year).
Which states have the cheapest business electricity?
North Dakota (7.54¢), Texas (8.62¢) and Nebraska (8.93¢) over the past 12 months. Hawaii (39.55¢) and California (26.98¢) are the most expensive.
How is this different from your commercial electricity costs page?
That page compares January–June 2026 with January–June 2025 and has a calculator for your own usage. This one ranks change over full 12-month periods and since 2021, and adds industrial prices.
How often is this updated?
EIA releases new monthly numbers about eight weeks after each month ends. The next release is due Oct 23, 2026.