Updated September 18, 2026 · EIA data through June 2026 · January–June and June-only comparisons with 2025 · Release: August 26, 2026 · Next scheduled EIA release: September 24
Ohio, Virginia and Maryland had the largest percentage increases in commercial electricity prices in the first half of 2026 versus the same period of 2025. EIA’s U.S. average rose from 13.06¢ to 13.86¢ per kWh, up 6.1%. At an unchanged, labeled 3,000 kWh per month, that price difference represents $24 more per month. These are broad commercial-sector averages, not small-business tariffs or actual company bills.
Where commercial electricity prices rose fastest: January–June
44 of the 51 states/DC jurisdictions increased; seven decreased. Ohio’s commercial average rose 24.5%, Virginia’s 22.8% and Maryland’s 21.3%. This compares January–June 2026 with January–June 2025, using EIA Table 5.6.B. The national 6.1% increase uses EIA’s U.S. figures, not an unweighted average of states.
Highest price is a different question. Hawaii had the highest first-half average at 41.98¢/kWh, compared with 36.86¢ in 2025. Its 5.12¢ increase would add $153.60 to a labeled 3,000-kWh month. Ohio’s larger percentage increase, from 11.07¢ to 13.78¢, would add $81.30 at that same usage. Neither is an observed small-business bill.
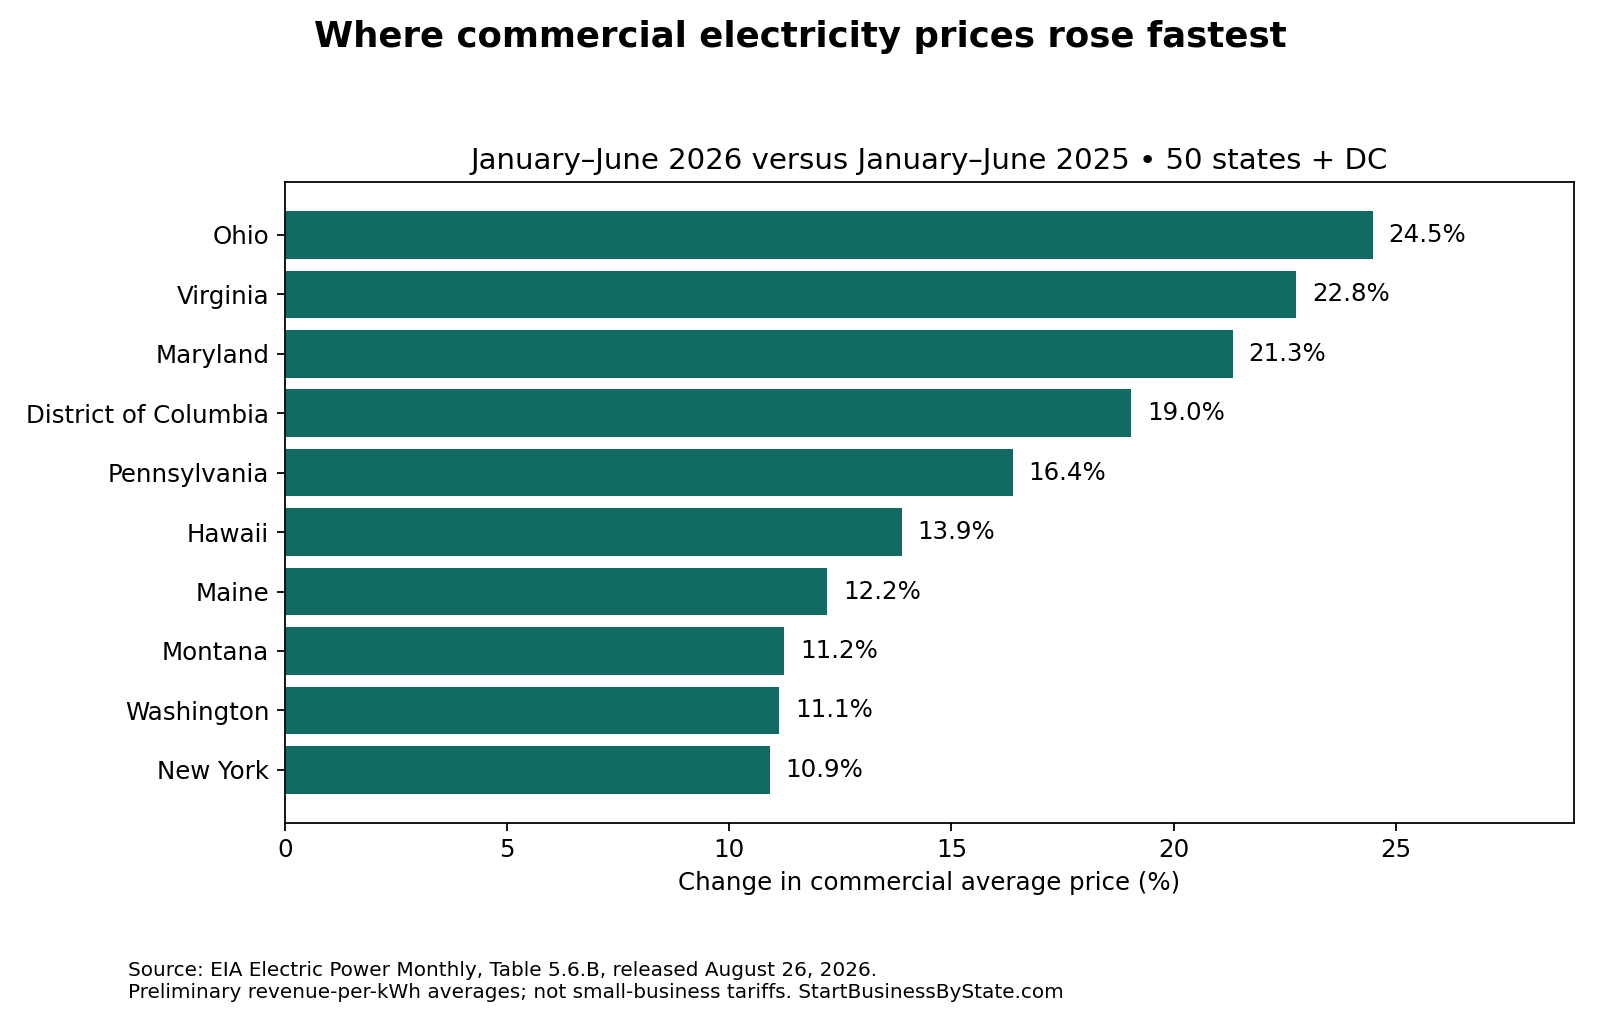
51 of 51 jurisdictions shown
| State / DC | 2025 ¢/kWh | 2026 ¢/kWh | Change % | Change ¢/kWh | Modeled $/month difference | 2026 price RSE % |
|---|---|---|---|---|---|---|
| Ohio | 11.07 | 13.78 | +24.5% | +2.71 | +81.30 | 0.36 |
| Virginia | 9.05 | 11.11 | +22.8% | +2.06 | +61.80 | 1 |
| Maryland | 14.11 | 17.12 | +21.3% | +3.01 | +90.30 | 0.24 |
| District of Columbia | 19.74 | 23.50 | +19.0% | +3.76 | +112.80 | 0 |
| Pennsylvania | 12.02 | 13.99 | +16.4% | +1.97 | +59.10 | 0.34 |
| Hawaii | 36.86 | 41.98 | +13.9% | +5.12 | +153.60 | 0 |
| Maine | 20.81 | 23.35 | +12.2% | +2.54 | +76.20 | 1 |
| Montana | 11.39 | 12.67 | +11.2% | +1.28 | +38.40 | 7 |
| Washington | 10.69 | 11.88 | +11.1% | +1.19 | +35.70 | 2 |
| New York | 20.43 | 22.66 | +10.9% | +2.23 | +66.90 | 0.2 |
| Delaware | 12.57 | 13.93 | +10.8% | +1.36 | +40.80 | 2 |
| Colorado | 11.97 | 13.18 | +10.1% | +1.21 | +36.30 | 1 |
| New Jersey | 16.04 | 17.52 | +9.2% | +1.48 | +44.40 | 0.29 |
| Mississippi | 13.05 | 14.20 | +8.8% | +1.15 | +34.50 | 3 |
| New Hampshire | 19.87 | 21.61 | +8.8% | +1.74 | +52.20 | 1 |
| Illinois | 12.61 | 13.70 | +8.6% | +1.09 | +32.70 | 1 |
| Kentucky | 11.89 | 12.89 | +8.4% | +1.00 | +30.00 | 2 |
| South Carolina | 11.02 | 11.93 | +8.3% | +0.91 | +27.30 | 2 |
| Michigan | 14.40 | 15.58 | +8.2% | +1.18 | +35.40 | 1 |
| South Dakota | 10.68 | 11.55 | +8.1% | +0.87 | +26.10 | 10 |
| Massachusetts | 23.01 | 24.79 | +7.7% | +1.78 | +53.40 | 1 |
| Arkansas | 10.66 | 11.46 | +7.5% | +0.80 | +24.00 | 2 |
| Vermont | 19.60 | 20.97 | +7.0% | +1.37 | +41.10 | 5 |
| Louisiana | 11.35 | 12.07 | +6.3% | +0.72 | +21.60 | 2 |
| Utah | 9.72 | 10.28 | +5.8% | +0.56 | +16.80 | 1 |
| Missouri | 10.04 | 10.56 | +5.2% | +0.52 | +15.60 | 2 |
| Tennessee | 13.03 | 13.70 | +5.1% | +0.67 | +20.10 | 1 |
| Wisconsin | 12.95 | 13.60 | +5.0% | +0.65 | +19.50 | 2 |
| California | 24.39 | 25.53 | +4.7% | +1.14 | +34.20 | 0 |
| Kansas | 11.10 | 11.61 | +4.6% | +0.51 | +15.30 | 5 |
| Idaho | 9.18 | 9.57 | +4.2% | +0.39 | +11.70 | 4 |
| Nebraska | 8.52 | 8.86 | +4.0% | +0.34 | +10.20 | 4 |
| Florida | 11.42 | 11.86 | +3.9% | +0.44 | +13.20 | 1 |
| Iowa | 10.49 | 10.89 | +3.8% | +0.40 | +12.00 | 6 |
| North Carolina | 10.21 | 10.55 | +3.3% | +0.34 | +10.20 | 2 |
| Alaska | 22.17 | 22.81 | +2.9% | +0.64 | +19.20 | 13 |
| North Dakota | 7.37 | 7.58 | +2.8% | +0.21 | +6.30 | 3 |
| Wyoming | 9.40 | 9.66 | +2.8% | +0.26 | +7.80 | 5 |
| Alabama | 14.46 | 14.79 | +2.3% | +0.33 | +9.90 | 2 |
| Minnesota | 12.00 | 12.27 | +2.2% | +0.27 | +8.10 | 4 |
| Oklahoma | 8.63 | 8.81 | +2.1% | +0.18 | +5.40 | 2 |
| Indiana | 13.78 | 14.06 | +2.0% | +0.28 | +8.40 | 1 |
| Nevada | 9.03 | 9.19 | +1.8% | +0.16 | +4.80 | 0.4 |
| Texas | 8.54 | 8.57 | +0.4% | +0.03 | +0.90 | 1 |
| Oregon | 10.59 | 10.57 | -0.2% | -0.02 | -0.60 | 2 |
| Georgia | 11.56 | 11.52 | -0.3% | -0.04 | -1.20 | 1 |
| Rhode Island | 24.05 | 23.80 | -1.0% | -0.25 | -7.50 | 0.05 |
| West Virginia | 11.86 | 11.68 | -1.5% | -0.18 | -5.40 | 1 |
| New Mexico | 10.86 | 10.51 | -3.2% | -0.35 | -10.50 | 2 |
| Arizona | 12.39 | 11.92 | -3.8% | -0.47 | -14.10 | 0.43 |
| Connecticut | 23.97 | 22.57 | -5.8% | -1.40 | -42.00 | 1 |
RSE is EIA’s relative standard error for the 2026 year-to-date price estimate (Table A.8.B), not an error bound for the year-over-year change. A displayed zero may be a small value rounded to zero. The ordering is descriptive; small differences and closely placed states should not be treated as statistically distinct. State averages cover all commercial customers, including businesses much larger than these illustrative shops.
Compare costs at your own electricity usage
Enter monthly kWh from a bill and choose a geography and comparison period. Both years use the same assumed usage, isolating the published price difference. The calculation does not estimate the effect of hotter weather, changed opening hours or new equipment on consumption.
Enter a whole-number usage from 0 to 1,000,000 kWh.
U.S. Total: 13.06¢ → 13.86¢ per kWh (January–June averages).
Modeled amount at 2026 price: $415.80
Same usage at 2025 price: $391.80
Modeled monthly difference: +$24.00
Six-month difference at unchanged monthly usage: +$144.00
What the average includes: EIA’s price is revenue divided by electricity sold. Charges reflected in that revenue are already part of the average; it is not an energy-only tariff with demand charges and fees removed. The calculator does not itemize or adjust your utility’s tariff. Do not add a generic fee on top and call it an actual bill. EIA’s price definition.
For daycare operators, electricity is one operating cost alongside staffing and occupancy; use our state daycare startup guides for the broader plan. The shop labels below are illustrative contexts, not measured industry consumption benchmarks.
Download the first-half state comparison CSV, including original prices, calculated changes, scenario amounts, RSE values and source dates. Download the first-half increases chart. Writers may reuse our original chart with attribution and a link to this page; keep the comparison dates and preliminary-data label.
How the first-half comparison was calculated
Source: EIA Table 5.6.B; June-only figures remain from Table 5.6.A; precision context from Table A.8.B. All retrieved September 18, 2026. Commercial columns only; 50 states plus DC, with U.S. Total separate. Census-division rows are excluded.
Percentage change = (2026 price − 2025 price) ÷ 2025 price × 100. Modeled dollar difference = assumed kWh × change in cents ÷ 100. Six-month scenarios hold the entered monthly usage constant for six months; they are not forecasts for the rest of 2026. All monetary changes are nominal. Published prices have two-decimal precision; calculations use those rounded source values. We use EIA’s year-to-date averages directly rather than averaging monthly or state prices.
Revenue-per-kWh averages can change with customer mix, consumption patterns and tariff components; these data alone do not isolate a utility rate increase or explain causes. No increase is attributed here to data centers, a particular law or summer weather. Prices are preliminary and subject to revision. The next EIA release was scheduled for September 24 when checked; this page is a dated snapshot, not an automatic feed.
Three findings reporters can use
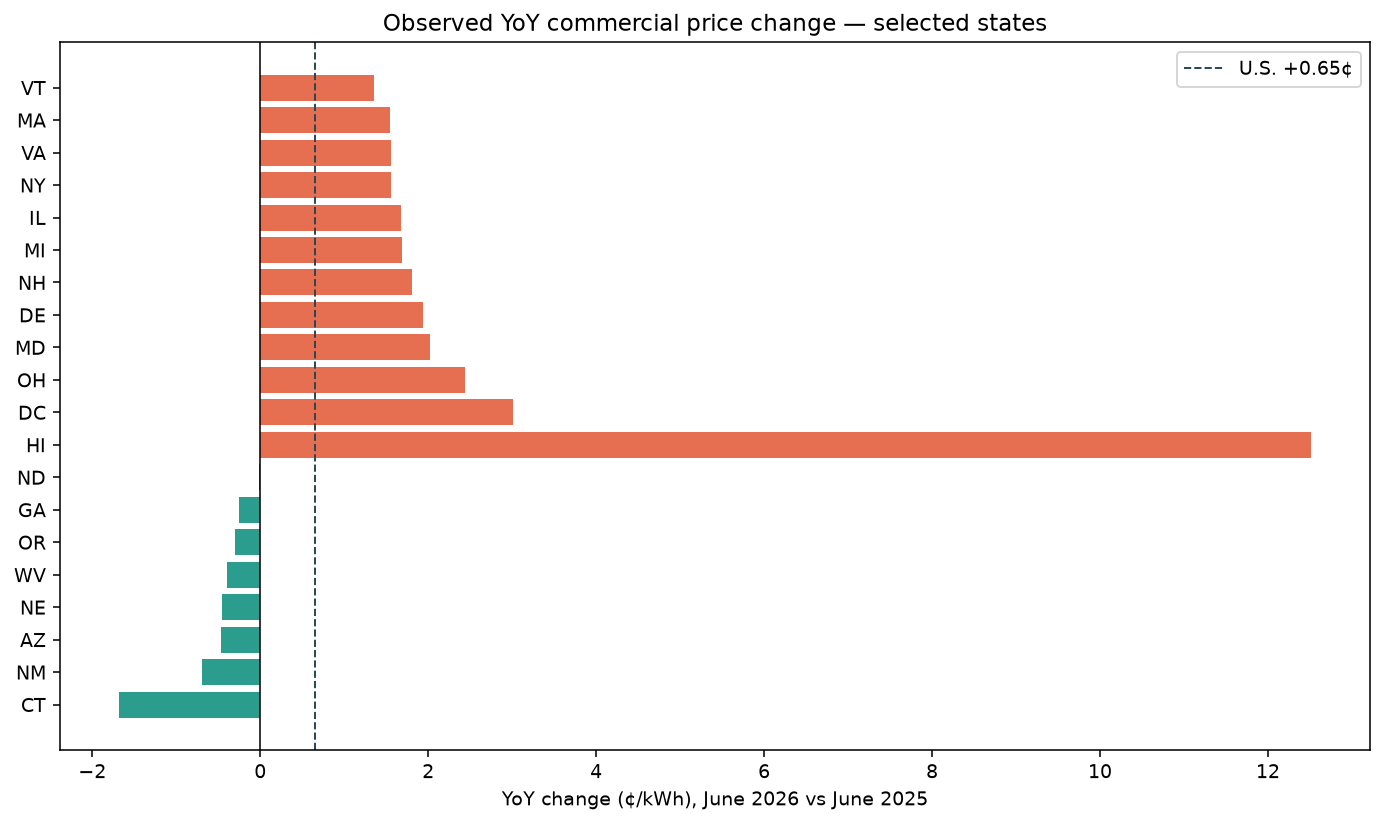
- Observed: U.S. commercial retail electricity averaged 14.19¢/kWh in June 2026, up +0.65¢ (+4.80%) from June 2025’s 13.54¢ (EIA EPM Table 5.6.A).
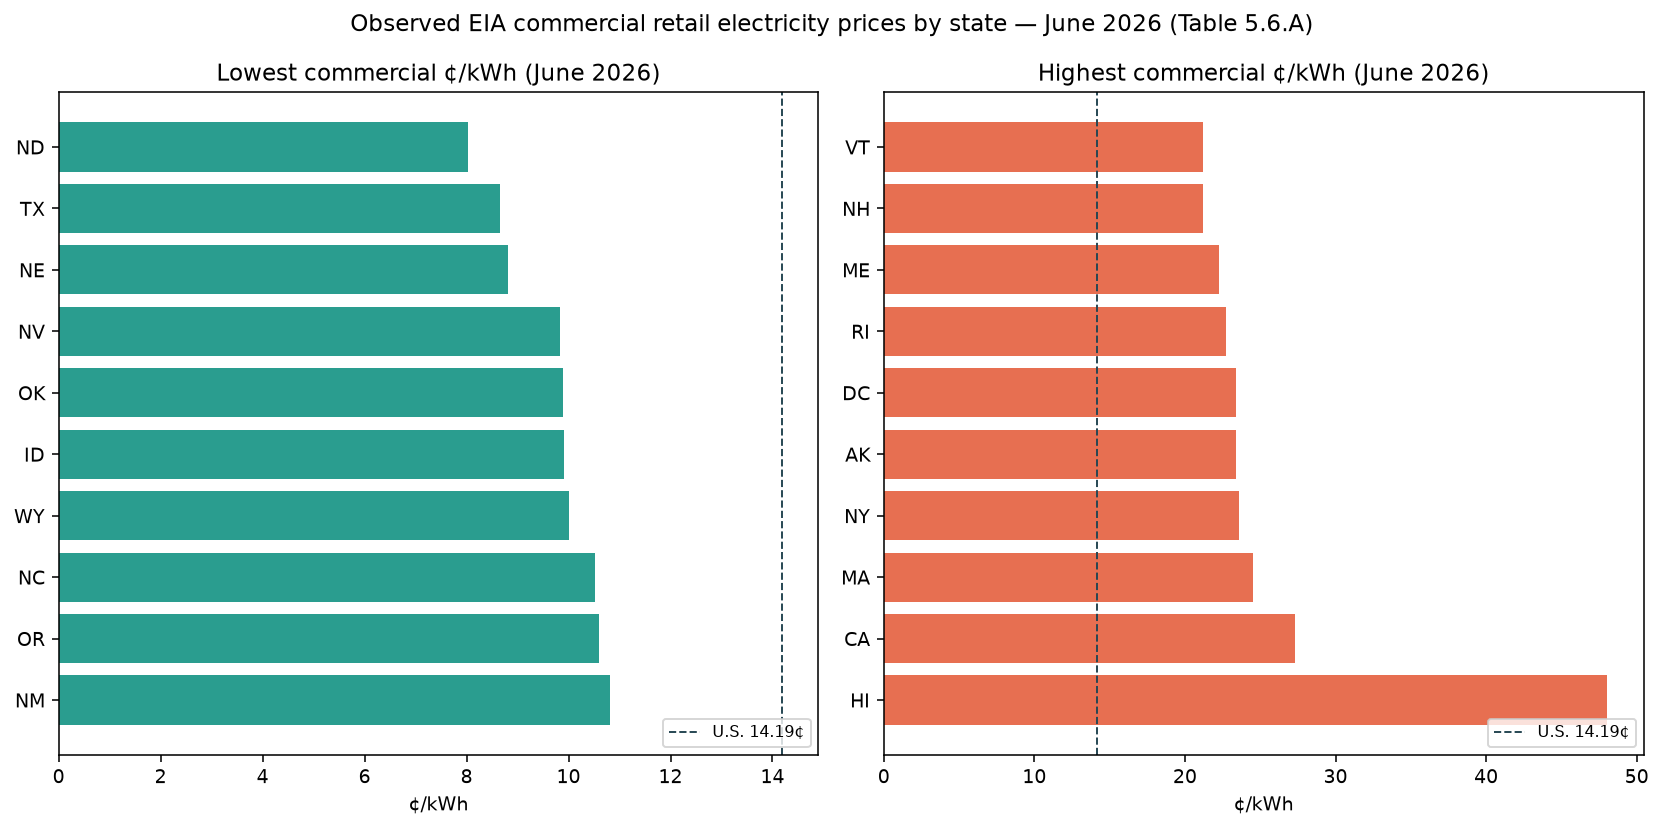
- Observed: Among 50 states + DC, commercial ¢/kWh ranged from North Dakota 8.02¢ to Hawaii 48.05¢. Top five: Hawaii 48.05¢, California 27.33¢, Massachusetts 24.52¢, New York 23.56¢, Alaska 23.42¢. Bottom five: North Dakota 8.02¢, Texas 8.66¢, Nebraska 8.82¢, Nevada 9.83¢, Oklahoma 9.9¢.
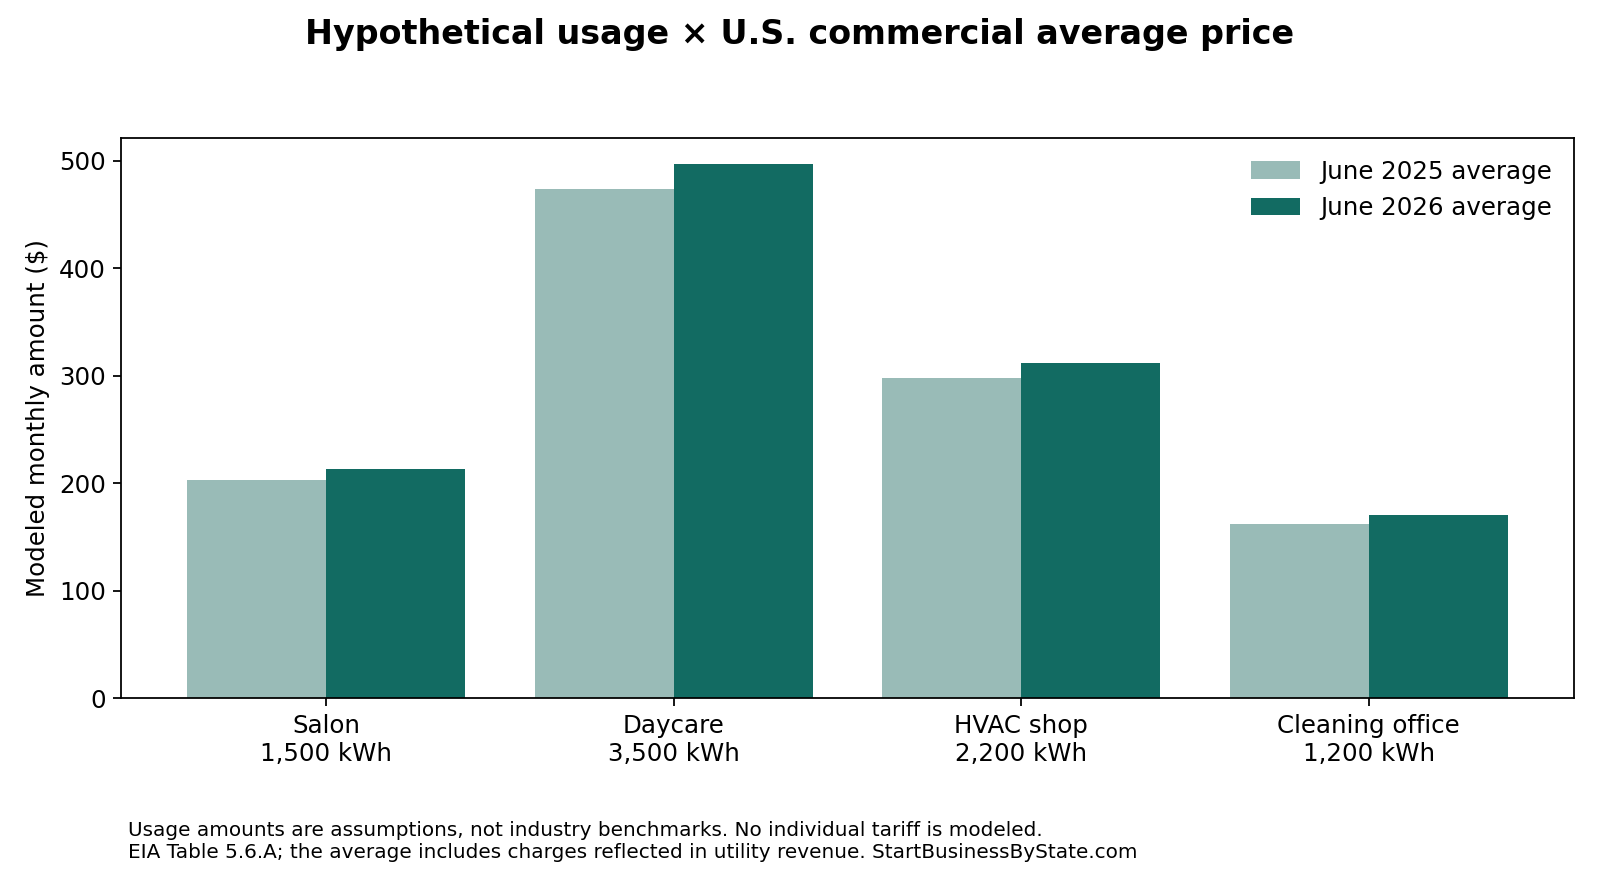
- Modeled (same kWh): Holding kWh fixed at the documented bands, the same U.S. commercial average implies modeled monthly bills $10–$23 higher than June 2025 prices — largest dollar gap on the higher-kWh daycare band. State ¢ differences dominate scenario bill spreads.
Not a best-state ranking. This page separates observed EIA commercial ¢/kWh from documented kWh bands. The average includes charges reflected in utility revenue; no customer-specific tariff is modeled. It is distinct from pump fuel costs for mobile fleets (gasoline/diesel at the pump vs commercial power at the meter).
Observed EIA commercial rates by state
Source: EIA Electric Power Monthly Table 5.6.A (June 2026 and June 2025). Public XLSX download;
| State | Comm. ¢ Jun 2026 | Comm. ¢ Jun 2025 | YoY ¢ | YoY % | Salon 1,500 kWh $ | Daycare 3,500 kWh $ | HVAC shop 2,200 kWh $ | Cleaning office 1,200 kWh $ |
|---|---|---|---|---|---|---|---|---|
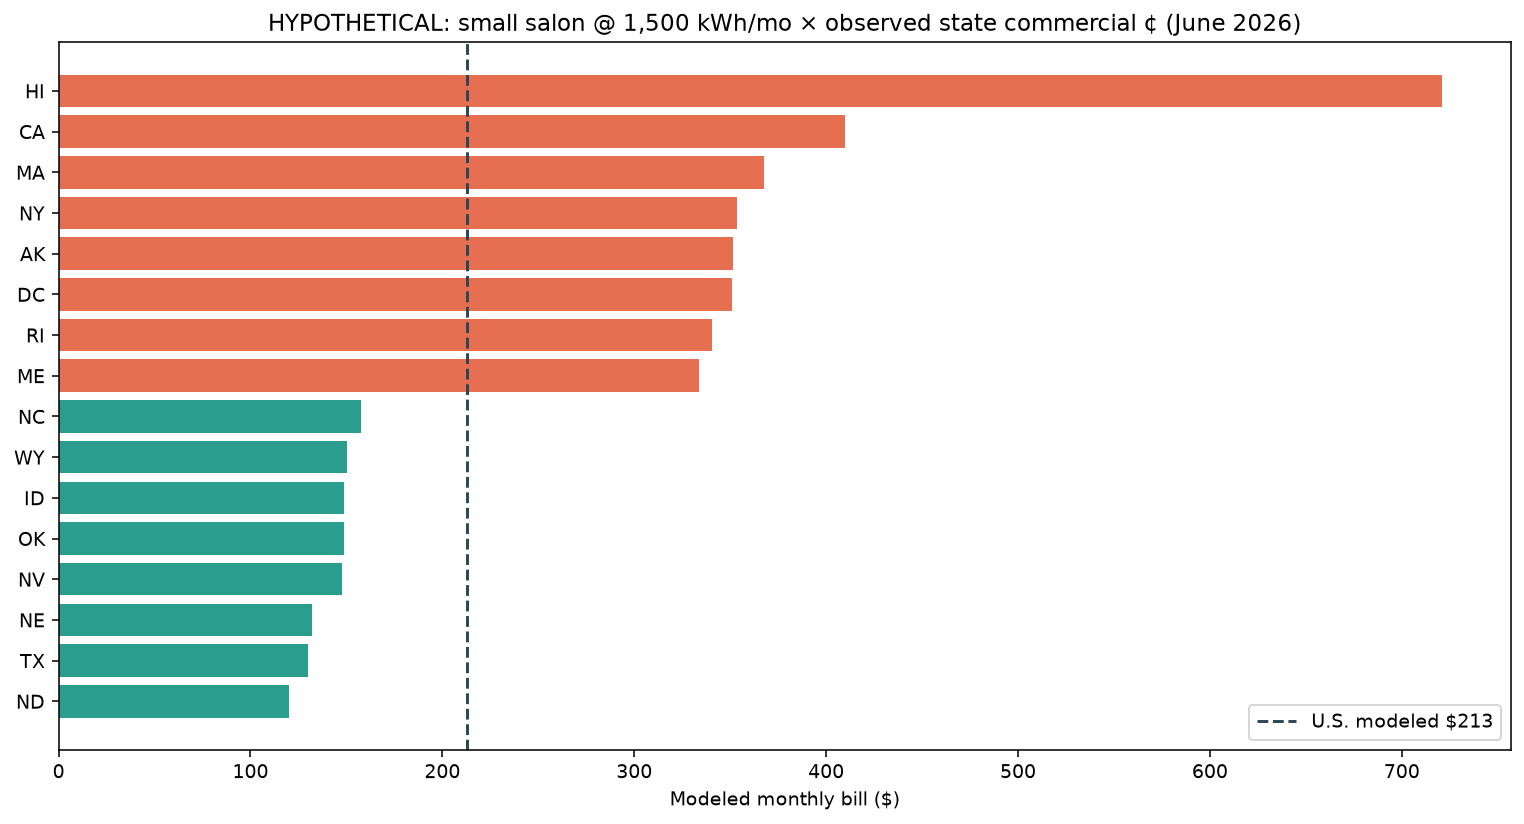
| Hawaii | 48.05 | 35.54 | +12.51 | +35.20% | $720.75 | $1,681.75 | $1,057.10 | $576.60 |
| California | 27.33 | 26.83 | +0.50 | +1.86% | $409.95 | $956.55 | $601.26 | $327.96 |
| Massachusetts | 24.52 | 22.97 | +1.55 | +6.75% | $367.80 | $858.20 | $539.44 | $294.24 |
| New York | 23.56 | 22.00 | +1.56 | +7.09% | $353.40 | $824.60 | $518.32 | $282.72 |
| Alaska | 23.42 | 22.95 | +0.47 | +2.05% | $351.30 | $819.70 | $515.24 | $281.04 |
| District of Columbia | 23.38 | 20.37 | +3.01 | +14.78% | $350.70 | $818.30 | $514.36 | $280.56 |
| Rhode Island | 22.70 | 22.15 | +0.55 | +2.48% | $340.50 | $794.50 | $499.40 | $272.40 |
| Maine | 22.24 | 21.09 | +1.15 | +5.45% | $333.60 | $778.40 | $489.28 | $266.88 |
| New Hampshire | 21.22 | 19.41 | +1.81 | +9.33% | $318.30 | $742.70 | $466.84 | $254.64 |
| Vermont | 21.22 | 19.87 | +1.35 | +6.79% | $318.30 | $742.70 | $466.84 | $254.64 |
| Connecticut | 19.62 | 21.30 | -1.68 | -7.89% | $294.30 | $686.70 | $431.64 | $235.44 |
| New Jersey | 18.47 | 18.01 | +0.46 | +2.55% | $277.05 | $646.45 | $406.34 | $221.64 |
| Maryland | 16.84 | 14.82 | +2.02 | +13.63% | $252.60 | $589.40 | $370.48 | $202.08 |
| Michigan | 16.63 | 14.94 | +1.69 | +11.31% | $249.45 | $582.05 | $365.86 | $199.56 |
| Alabama | 14.67 | 14.53 | +0.14 | +0.96% | $220.05 | $513.45 | $322.74 | $176.04 |
| Illinois | 14.53 | 12.85 | +1.68 | +13.07% | $217.95 | $508.55 | $319.66 | $174.36 |
| Delaware | 14.40 | 12.46 | +1.94 | +15.57% | $216.00 | $504.00 | $316.80 | $172.80 |
| Colorado | 14.19 | 13.49 | +0.70 | +5.19% | $212.85 | $496.65 | $312.18 | $170.28 |
| Indiana | 14.15 | 13.67 | +0.48 | +3.51% | $212.25 | $495.25 | $311.30 | $169.80 |
| Wisconsin | 14.05 | 13.35 | +0.70 | +5.24% | $210.75 | $491.75 | $309.10 | $168.60 |
| Tennessee | 13.94 | 13.39 | +0.55 | +4.11% | $209.10 | $487.90 | $306.68 | $167.28 |
| Mississippi | 13.83 | 13.00 | +0.83 | +6.38% | $207.45 | $484.05 | $304.26 | $165.96 |
| Ohio | 13.77 | 11.33 | +2.44 | +21.54% | $206.55 | $481.95 | $302.94 | $165.24 |
| Minnesota | 13.68 | 13.54 | +0.14 | +1.03% | $205.20 | $478.80 | $300.96 | $164.16 |
| Montana | 13.48 | 13.16 | +0.32 | +2.43% | $202.20 | $471.80 | $296.56 | $161.76 |
| Pennsylvania | 13.33 | 12.37 | +0.96 | +7.76% | $199.95 | $466.55 | $293.26 | $159.96 |
| Iowa | 12.79 | 12.57 | +0.22 | +1.75% | $191.85 | $447.65 | $281.38 | $153.48 |
| Missouri | 12.71 | 12.42 | +0.29 | +2.33% | $190.65 | $444.85 | $279.62 | $152.52 |
| Arizona | 12.47 | 12.94 | -0.47 | -3.63% | $187.05 | $436.45 | $274.34 | $149.64 |
| Kentucky | 12.40 | 11.76 | +0.64 | +5.44% | $186.00 | $434.00 | $272.80 | $148.80 |
| Kansas | 12.27 | 12.10 | +0.17 | +1.40% | $184.05 | $429.45 | $269.94 | $147.24 |
| Georgia | 11.91 | 12.16 | -0.25 | -2.06% | $178.65 | $416.85 | $262.02 | $142.92 |
| Washington | 11.77 | 10.72 | +1.05 | +9.79% | $176.55 | $411.95 | $258.94 | $141.24 |
| Louisiana | 11.64 | 11.17 | +0.47 | +4.21% | $174.60 | $407.40 | $256.08 | $139.68 |
| South Carolina | 11.62 | 11.06 | +0.56 | +5.06% | $174.30 | $406.70 | $255.64 | $139.44 |
| Arkansas | 11.54 | 10.90 | +0.64 | +5.87% | $173.10 | $403.90 | $253.88 | $138.48 |
| Florida | 11.47 | 11.39 | +0.08 | +0.70% | $172.05 | $401.45 | $252.34 | $137.64 |
| South Dakota | 11.35 | 11.28 | +0.07 | +0.62% | $170.25 | $397.25 | $249.70 | $136.20 |
| West Virginia | 11.09 | 11.49 | -0.40 | -3.48% | $166.35 | $388.15 | $243.98 | $133.08 |
| Utah | 10.99 | 10.56 | +0.43 | +4.07% | $164.85 | $384.65 | $241.78 | $131.88 |
| Virginia | 10.99 | 9.43 | +1.56 | +16.54% | $164.85 | $384.65 | $241.78 | $131.88 |
| New Mexico | 10.82 | 11.51 | -0.69 | -5.99% | $162.30 | $378.70 | $238.04 | $129.84 |
| Oregon | 10.59 | 10.89 | -0.30 | -2.75% | $158.85 | $370.65 | $232.98 | $127.08 |
| North Carolina | 10.51 | 9.80 | +0.71 | +7.24% | $157.65 | $367.85 | $231.22 | $126.12 |
| Wyoming | 10.01 | 9.79 | +0.22 | +2.25% | $150.15 | $350.35 | $220.22 | $120.12 |
| Idaho | 9.92 | 9.00 | +0.92 | +10.22% | $148.80 | $347.20 | $218.24 | $119.04 |
| Oklahoma | 9.90 | 9.78 | +0.12 | +1.23% | $148.50 | $346.50 | $217.80 | $118.80 |
| Nevada | 9.83 | 8.79 | +1.04 | +11.83% | $147.45 | $344.05 | $216.26 | $117.96 |
| Nebraska | 8.82 | 9.27 | -0.45 | -4.85% | $132.30 | $308.70 | $194.04 | $105.84 |
| Texas | 8.66 | 8.42 | +0.24 | +2.85% | $129.90 | $303.10 | $190.52 | $103.92 |
| North Dakota | 8.02 | 8.04 | -0.02 | -0.25% | $120.30 | $280.70 | $176.44 | $96.24 |
U.S. Total commercial: 14.19¢ (June 2026) vs 13.54¢ (June 2025). Scenario dollar columns = observed state ¢ × labeled kWh / 100 — labeled usage bands, not metered bills.
Shop kWh-band scenarios
Industry contexts: salon/barber 81211, HVAC contractors 238220 (QCEW 23822), janitorial 561720. Daycare kWh is a usage illustration only — this is not a daycare market study. Practical guides: hair salon, HVAC, cleaning service.
| Scenario | NAICS context | kWh/mo | $ @ Jun 2025 U.S. | $ @ Jun 2026 U.S. | Δ $ |
|---|---|---|---|---|---|
| Small salon / barbershop | 81211 / 812112 | 1,500 | $203.10 | $212.85 | +$9.75 |
| Small daycare / childcare center | 624410 (context only) | 3,500 | $473.90 | $496.65 | +$22.75 |
| Small HVAC / contractor shop | 238220 / QCEW 23822 | 2,200 | $297.88 | $312.18 | +$14.30 |
| Small cleaning / janitorial office | 561720 | 1,200 | $162.48 | $170.28 | +$7.80 |
Charts
Service-industry employment density (QCEW context)
Private QCEW 2025 annual averages. Use as where shops operate context — not electricity intensity and not causation with rates.
| State | Salon est | Salon emp | HVAC est | HVAC emp | Cleaning est | Cleaning emp |
|---|---|---|---|---|---|---|
| California | 16,263 | 72,757 | 13,023 | 125,858 | 8,281 | 114,328 |
| New York | 11,397 | 47,968 | 7,059 | 68,210 | 4,950 | 72,277 |
| Texas | 7,884 | 38,061 | 10,012 | 121,180 | 5,588 | 91,722 |
| Pennsylvania | 6,647 | 34,545 | 4,294 | 46,317 | 2,598 | 36,565 |
| Florida | 9,342 | 32,385 | 10,921 | 106,398 | 8,596 | 73,796 |
| New Jersey | 5,888 | 31,238 | 3,488 | 31,058 | 2,604 | 33,412 |
| Ohio | 3,555 | 20,948 | 3,479 | 45,951 | 2,574 | 37,082 |
| Illinois | 4,264 | 20,443 | 4,146 | 40,882 | 2,781 | 48,768 |
| Massachusetts | 3,544 | 18,000 | 3,144 | 31,954 | 1,847 | 31,441 |
| Virginia | 3,719 | 17,114 | 2,817 | 36,599 | 2,641 | 39,881 |
| Washington | 2,842 | 14,578 | 2,305 | 29,601 | 2,312 | 21,060 |
| Colorado | 2,716 | 13,060 | 2,781 | 28,509 | 1,598 | 21,250 |
| Georgia | 3,913 | 12,795 | 3,750 | 38,437 | 2,618 | 24,278 |
| North Carolina | 2,970 | 12,251 | 4,630 | 50,010 | 2,937 | 31,060 |
| Michigan | 2,157 | 12,099 | 2,854 | 33,446 | 1,720 | 30,932 |
| Minnesota | 1,930 | 11,414 | 1,848 | 22,629 | 1,544 | 18,107 |
| Maryland | 2,039 | 11,197 | 1,945 | 31,020 | 1,634 | 24,003 |
| Arizona | 2,330 | 11,126 | 3,011 | 36,519 | 1,417 | 18,805 |
| Wisconsin | 2,116 | 10,835 | 2,115 | 25,360 | 1,519 | 22,563 |
| Connecticut | 1,960 | 9,721 | 1,480 | 13,025 | 941 | 15,072 |
| Missouri | 1,704 | 8,510 | 2,199 | 23,800 | 1,396 | 17,733 |
| Tennessee | 1,383 | 8,329 | 2,348 | 29,228 | 1,340 | 21,410 |
| Indiana | 1,726 | 8,236 | 2,244 | 30,984 | 1,564 | 20,433 |
| Utah | 1,422 | 5,956 | 1,758 | 17,464 | 1,056 | 10,111 |
| South Carolina | 1,332 | 5,480 | 1,831 | 18,374 | 1,383 | 16,786 |
| Oregon | 1,194 | 5,321 | 1,577 | 16,083 | 1,476 | 11,551 |
| Louisiana | 1,512 | 4,961 | 1,974 | 15,439 | 1,038 | 11,594 |
| Kansas | 725 | 4,792 | 1,047 | 13,255 | 708 | 8,681 |
| Alabama | 1,210 | 4,612 | 2,114 | 19,101 | 1,020 | 12,850 |
| Nevada | 866 | 3,826 | 1,058 | 16,394 | 935 | 13,265 |
| Iowa | 846 | 3,802 | 1,142 | 16,044 | 752 | 10,640 |
| Kentucky | 954 | 3,537 | 1,776 | 17,889 | 1,000 | 14,907 |
| Oklahoma | 806 | 3,429 | 1,874 | 16,229 | 697 | 7,540 |
| New Hampshire | 604 | 3,136 | 838 | 5,981 | 548 | 4,233 |
| Nebraska | 722 | 2,967 | 920 | 11,160 | 541 | 7,599 |
| Delaware | 486 | 2,698 | 482 | 5,253 | 429 | 4,652 |
| Idaho | 595 | 2,315 | 1,137 | 10,516 | 819 | 5,693 |
| Arkansas | 651 | 2,280 | 1,434 | 11,396 | 631 | 9,938 |
| Rhode Island | 511 | 1,928 | 549 | 4,655 | 416 | 4,055 |
| Mississippi | 541 | 1,734 | 1,039 | 8,612 | 546 | 8,012 |
| New Mexico | 375 | 1,660 | 737 | 7,150 | 426 | 4,922 |
| Hawaii | 492 | 1,603 | 546 | 5,060 | 614 | 5,680 |
| Maine | 384 | 1,445 | 876 | 5,604 | 444 | 3,434 |
| District of Columbia | 251 | 1,427 | 88 | 1,794 | 302 | 10,880 |
| North Dakota | 320 | 1,397 | 401 | 3,889 | 292 | 2,448 |
| West Virginia | 315 | 1,343 | 549 | 4,181 | 374 | 3,363 |
| South Dakota | 197 | 1,144 | 462 | 4,567 | 312 | 2,660 |
| Montana | 264 | 983 | 789 | 5,452 | 533 | 3,162 |
| Alaska | 164 | 735 | 263 | 2,092 | 258 | 2,162 |
| Vermont | 174 | 735 | 332 | 2,507 | 243 | 1,388 |
| Wyoming | 97 | 318 | 380 | 2,453 | 250 | 1,645 |
Related research
- HVAC equipment tariff scenarios (Section 232) — Annex III / Proclamation 11032 duty math for residential equipment (import duty scenarios, not shop kWh).
- Fuel costs for mobile service businesses — pump gasoline/diesel (different energy cost; vehicle fuel vs meter power).
- Small-business rate-hike impact — financing / variable-rate loan scenarios (different shock).
- Industry statistics: salon, HVAC, cleaning.
- Startup hubs: hair salon, HVAC, cleaning service.
Sources and methodology
Observed prices: EIA Electric Power Monthly Table 5.6.A, commercial sector, June 2026 vs June 2025, 50 states + DC + U.S. Total. Workbook table_5_06_a.xlsx. Public EIA workbook.
Hypothetical bills: documented kWh/month × observed commercial ¢/kWh ÷ 100. See scenario CSV rationales. Never present as measured firm costs. The average includes charges reflected in utility revenue; no customer-specific tariff adjustment is modeled.
Density: BLS QCEW open annual CSVs, private ownership, 2025, industries 81211 / 23822 / 561720.
State commercial averages ≠ your utility rate schedule. Classification of commercial vs industrial customers varies by utility. Preliminary EIA-861M estimates may revise.
Frequently asked
Are the monthly dollar bills real company costs?
No. They are scenarios: assumed kWh multiplied by observed EIA commercial averages. Replace the kWh with your meter data and your tariff for a real estimate — and still watch demand charges.
Does the EIA average exclude demand charges?
No. EIA calculates the average from revenue divided by electricity sold; revenue includes energy, demand and service charges. The average does not specify your tariff’s separate components. Adding a generic demand fee on top could double-count costs. Use your own tariff and meter profile for an actual bill.
How is this different from the fuel-costs page?
The fuel-costs study uses EIA pump gasoline/diesel for mobile fleets. This page uses EIA commercial retail electricity ¢/kWh for shop meters.
Is this a ranking of best states for service businesses?
No. Higher or lower commercial ¢ is one operating-cost input among many (wages, rent, licensing, demand). We do not score or rank “best” states here.
Download the data and charts
- Observed commercial rates + scenario bill columns (CSV)
- Hypothetical kWh scenario definitions (CSV)
- Long-form hypothetical bills by state (CSV)
- QCEW service density by state (CSV)
Cite with a link to this page. Chart PNGs are linked in the figures above.