Original research · U.S. Energy Information Administration power plant data · Updated September 28, 2026
Data through: July 2026 (EIA Electric Power Monthly, released Sep 24, 2026). “Now” means the 12 months from August 2025 to July 2026. We compare it with calendar 2019.
Natural gas makes the most U.S. electricity, and solar is growing fastest. In the 12 months through July 2026, gas made 40.7% of the country’s utility-scale power. Nuclear made 17.7%, coal 15.5%, wind 10.7% and solar 7.5%. In 2019, solar was 1.7% and coal was 23.4%. The six states where data centers are growing fastest (Texas, Ohio, Indiana, Virginia, Mississippi and Wisconsin) now make 19.8% more electricity than in 2019. The U.S. as a whole makes 8.5% more.
Key findings
- The U.S. makes 8.5% more electricity than in 2019. Utility-scale plants made 4,481 terawatt-hours (TWh) in the 12 months through July 2026, up from 4,131 TWh in 2019. The last year alone was up 2.3%.
- Solar added more new power than any other source. Solar made 263 TWh more than in 2019, about 4.7 times as much. Natural gas added 237 TWh and wind 185 TWh. Coal made 272 TWh less.
- Natural gas is the top source in 27 states, up from 21 in 2019. Coal is the top source in 7 states, down from 15. Wind leads in 6 states, including Iowa (57.6%) and South Dakota (55.5%).
- The six “hot” data center states lean on natural gas. Together, Texas, Ohio, Indiana, Virginia, Mississippi and Wisconsin got 50.0% of their power from gas, about the same as in 2019 (50.1%). Coal fell from 25.0% to 15.7%. Solar rose from 0.7% to 9.6%.
- Texas makes more new power than anyone. Texas made 25.3% more electricity than in 2019. That’s 34.9% of the whole country’s increase. Ohio is up 27.1%, mostly from new gas plants: its gas share went from 43.5% to 56.7%.
- Virginia, long the best-known data center state, runs on gas and nuclear. Gas made 56.4% of Virginia’s in-state power and nuclear 26.8%. Solar went from 1.0% to 9.3%. Virginia also buys a lot of power from other states, and this data only counts power made inside Virginia.
Where U.S. electricity comes from
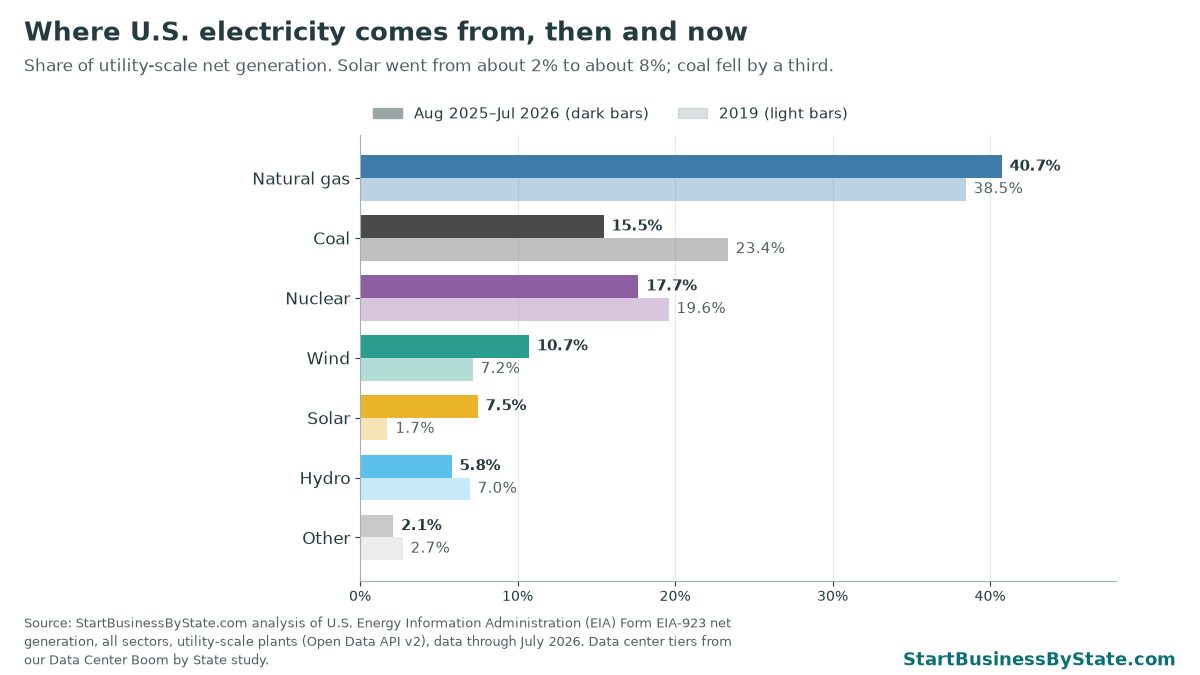
Natural gas has been the biggest source for years, and its share grew a little, from 38.5% to 40.7%. Nuclear plants made about the same amount of power as in 2019, but because total demand grew, nuclear’s share slipped from 19.6% to 17.7%. Hydro depends on rain and snow. Its share was lower than in 2019 (5.8% vs. 7.0%).
The biggest shift is coal to solar and wind. Coal’s share fell −7.9 points. Wind and solar together rose +9.3 points, to 18.2%.
Electricity sources in every state
Each state makes power in its own way. Natural gas is over half of in-state power in 11 states, led by Delaware (88.2%) and Rhode Island (86.3%). Coal still makes 86.7% of West Virginia’s power and 63.9% of Kentucky’s. Nuclear is over half in New Hampshire (53.2%) and South Carolina (52.4%). Solar is highest in Nevada (30.4%) and California (28.7%). Hawaii runs mostly on oil (75.8%).
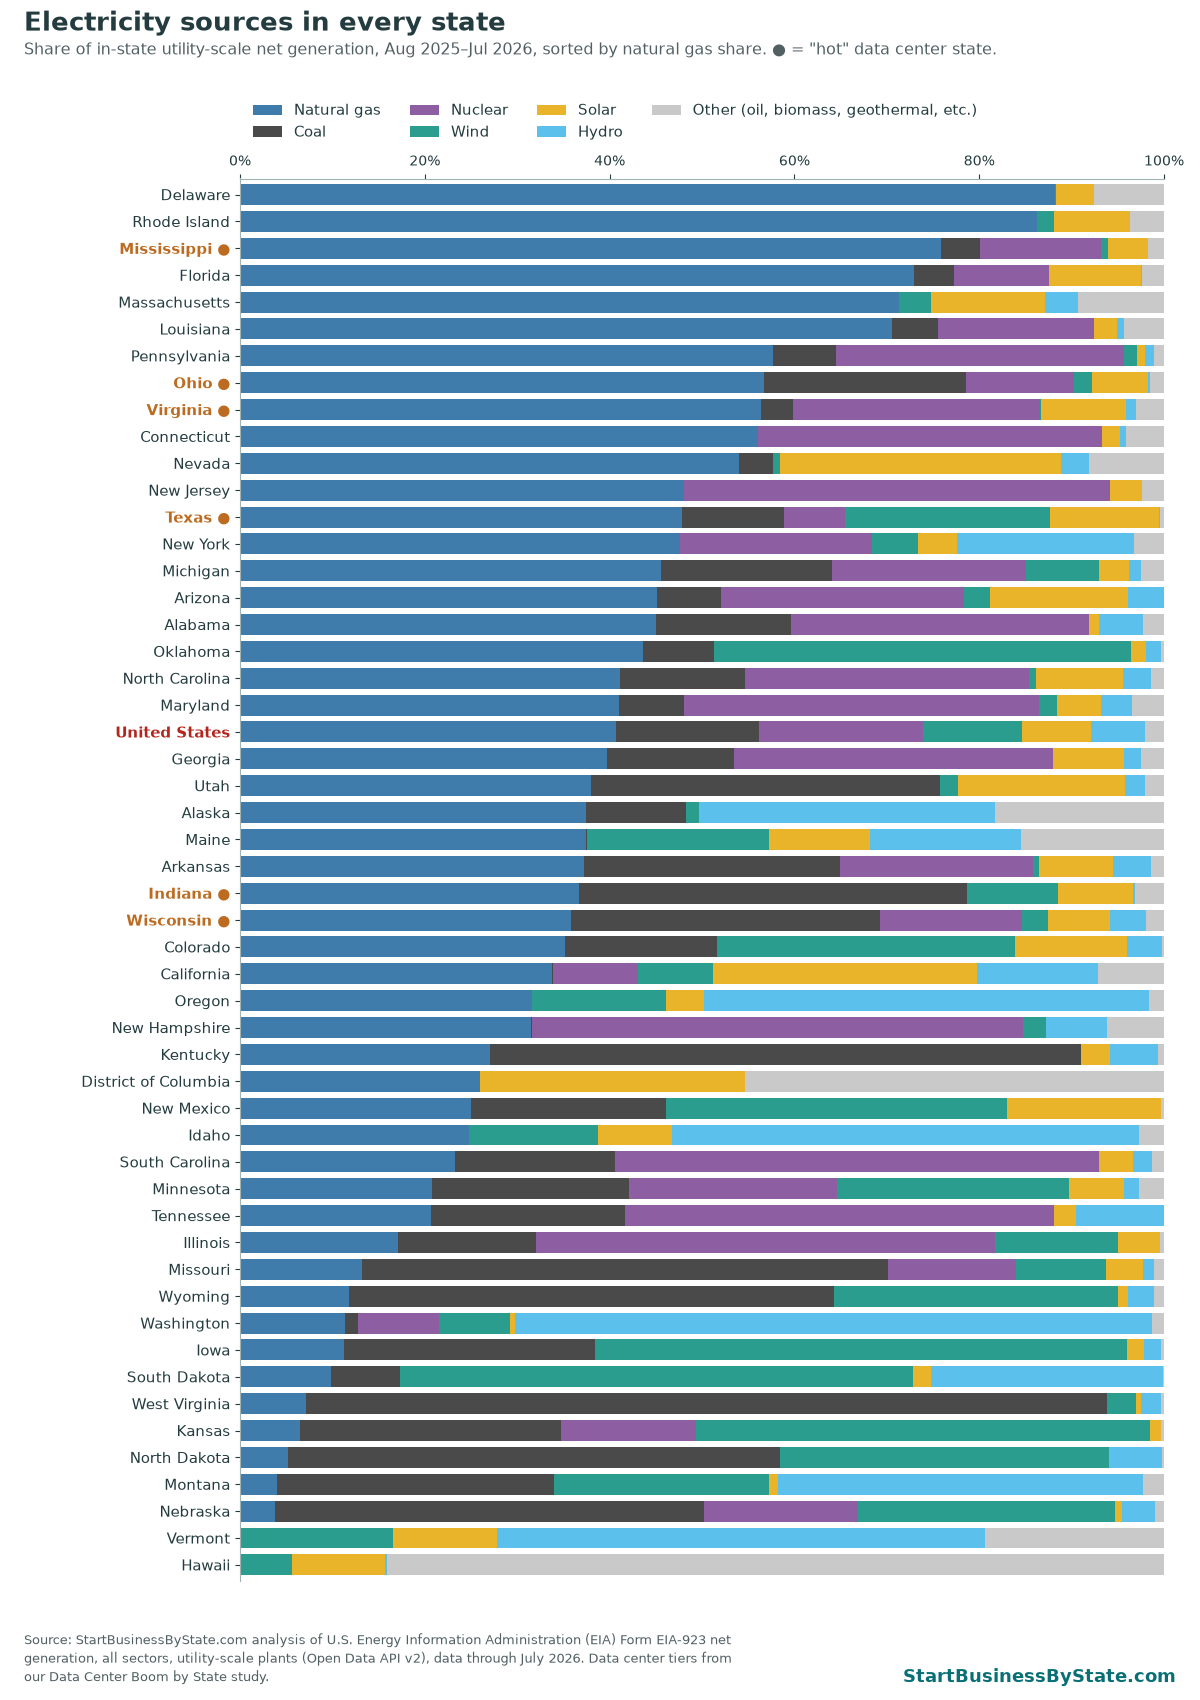
Coal’s share fell in 46 of the 47 states that burned coal for power in 2019. Coal made over a third of the power in 16 states in 2019 and 9 states now. Solar’s share grew in 48 states.
What powers the data center states
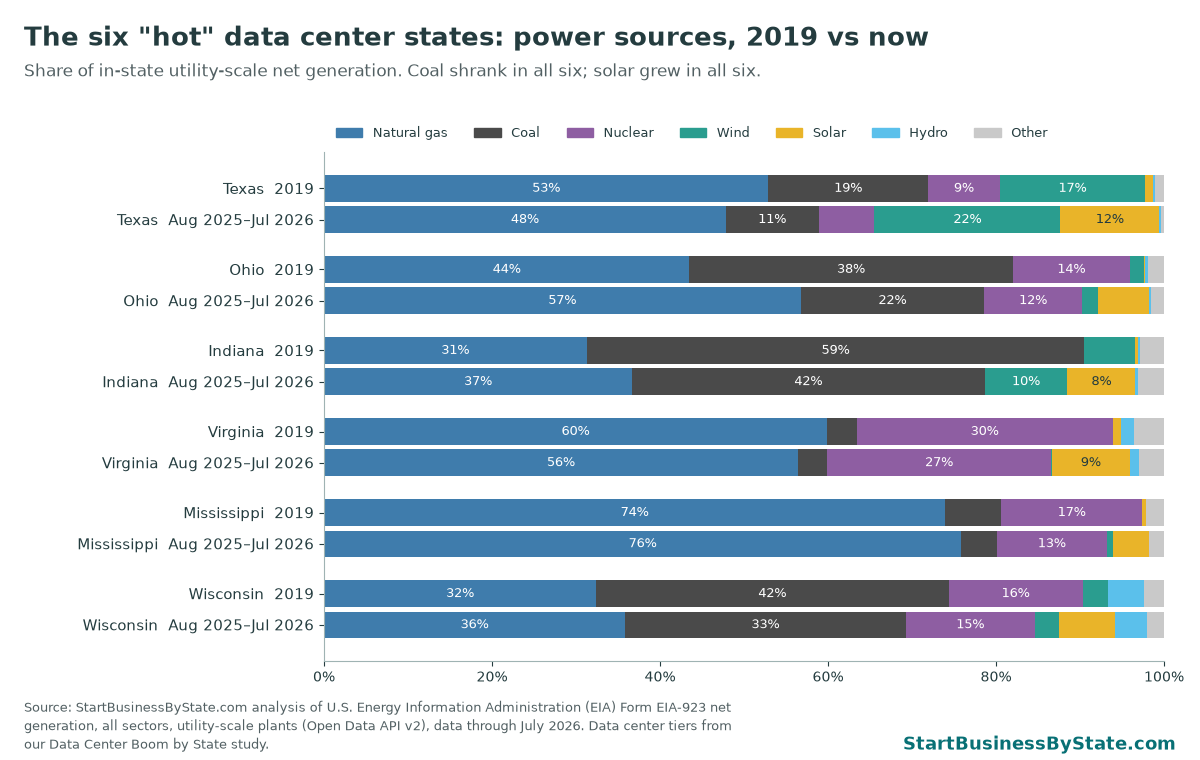
Our data center map by state rates six states “hot” based on large AI sites, planned power plants and data hosting jobs: Texas, Ohio, Indiana, Virginia, Mississippi and Wisconsin. Here’s what their power plants run on now compared with 2019.
| State | AI data center sites: est. power today (MW) | Electricity made vs. 2019 | Natural gas share (change, pts) | Coal share (change, pts) | Nuclear share | Wind + solar share (change, pts) | New power plants planned 2026–28 (MW) |
|---|---|---|---|---|---|---|---|
| Texas | 1,301 | +25.3% | 47.8% (−5.1) | 11.0% (−8.0) | 6.6% | 33.9% (+15.7) | 70,693 |
| Ohio | 1,482 | +27.1% | 56.7% (+13.2) | 21.9% (−16.6) | 11.6% | 8.0% (+6.2) | 3,412 |
| Indiana | 1,088 | +8.0% | 36.7% (+5.4) | 42.0% (−17.3) | 0.0% | 17.9% (+11.6) | 3,814 |
| Virginia | 1,044 | +7.5% | 56.4% (−3.5) | 3.4% (−0.1) | 26.8% | 9.3% (+8.3) | 4,932 |
| Mississippi | 512 | +17.1% | 75.9% (+1.9) | 4.2% (−2.5) | 13.2% | 5.1% (+4.6) | 4,253 |
| Wisconsin | 369 | +4.0% | 35.8% (+3.5) | 33.4% (−8.6) | 15.4% | 9.5% (+6.4) | 4,568 |
AI site power and planned plants come from our data center page (Epoch AI list and EIA Form 860M, August 2026). Shares and changes are from EIA Form 923.
- Texas gets far more of its power from wind than the other five (22.1%). Solar went from 0.9% to 11.8%. Texas alone accounts for 25.4% of the country’s new solar power since 2019.
- Ohio and Indiana are moving from coal to gas. Indiana still gets 42.0% of its power from coal, down from 59.3%.
- Mississippi is mostly gas (75.9%). Wisconsin is a mix of gas (35.8%), coal (33.4%) and nuclear (15.4%).
- In Indiana, Ohio, Texas and Wisconsin, most of the new plants planned for 2026–28 are solar and batteries. Texas plans 34,257 MW of solar, 21,825 MW of batteries and 10,452 MW of gas. Mississippi’s plans are mostly gas (2,977 MW), and Virginia’s include 2,718 MW of wind.
Some states that aren’t “hot” also grew a lot. South Dakota (+54.4%), Maine (+45.0%) and New Mexico (+27.2%) added new wind, solar or gas plants.
Which states make more electricity than in 2019
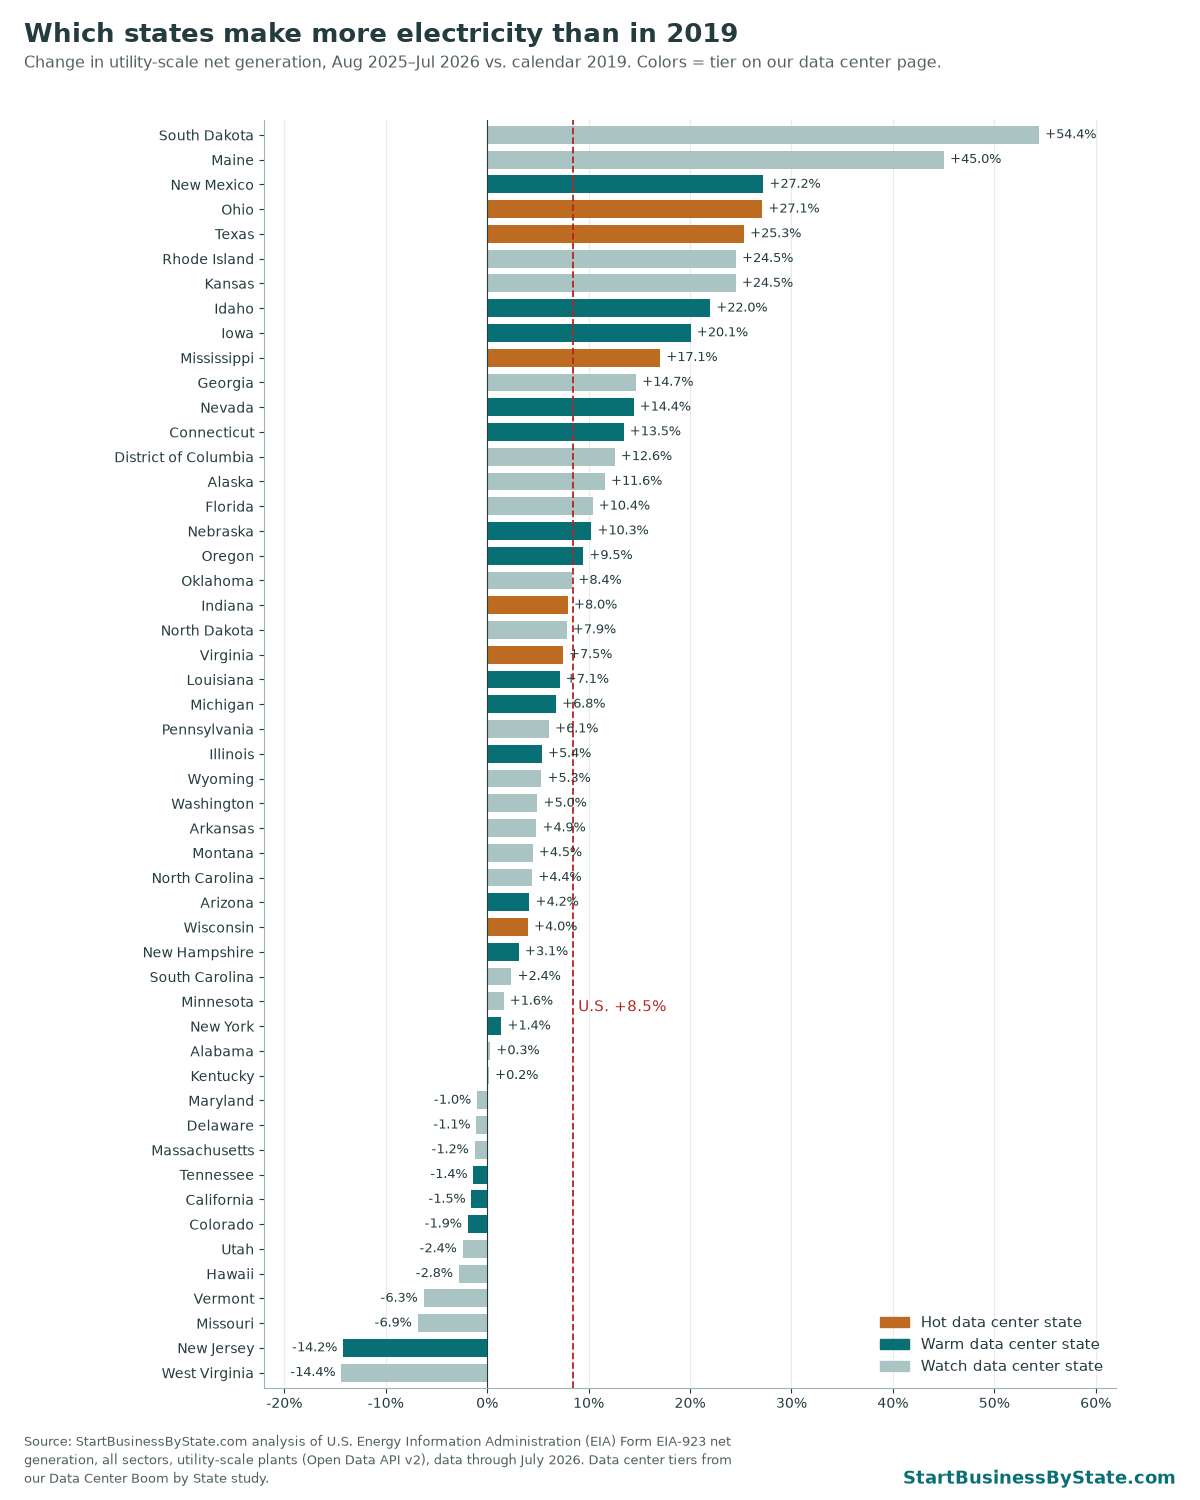
39 states made more electricity than in 2019. Making more power doesn’t always mean using more. Some states export power, and some import it. West Virginia (−14.4%) and New Jersey (−14.2%) made the least compared with 2019.
Full table: electricity sources by state
| State | Data center tier | Top source | Natural gas | Coal | Nuclear | Wind | Solar | Hydro | Other | TWh made (12 mo.) | vs. 2019 | Coal share change (pts) | Wind + solar change (pts) |
|---|---|---|---|---|---|---|---|---|---|---|---|---|---|
| United States | Natural gas | 40.7% | 15.5% | 17.7% | 10.7% | 7.5% | 5.8% | 2.1% | 4,480.7 | +8.5% | −7.9 | +9.3 | |
| Alabama | Watch | Natural gas | 45.0% | 14.7% | 32.2% | 0.0% | 1.1% | 4.8% | 2.3% | 143.1 | +0.3% | −4.0 | +0.8 |
| Alaska | Watch | Natural gas | 37.5% | 10.8% | 0.0% | 1.4% | 0.0% | 32.0% | 18.3% | 6.8 | +11.6% | −0.5 | −0.9 |
| Arizona | Warm | Natural gas | 45.1% | 6.9% | 26.3% | 2.8% | 14.9% | 4.2% | -0.4% | 118.3 | +4.2% | −13.5 | +12.6 |
| Arkansas | Watch | Natural gas | 37.2% | 27.8% | 20.8% | 0.6% | 8.0% | 4.2% | 1.4% | 67.6 | +4.9% | −8.4 | +8.3 |
| California | Warm | Natural gas | 33.8% | 0.1% | 9.2% | 8.1% | 28.7% | 13.1% | 7.1% | 198.7 | −1.5% | −0.1 | +15.9 |
| Colorado | Warm | Natural gas | 35.2% | 16.5% | 0.0% | 32.2% | 12.1% | 3.7% | 0.3% | 55.3 | −1.9% | −28.5 | +22.9 |
| Connecticut | Warm | Natural gas | 56.1% | 0.0% | 37.2% | 0.0% | 1.9% | 0.6% | 4.1% | 45.4 | +13.5% | −0.1 | +1.5 |
| Delaware | Watch | Natural gas | 88.2% | 0.0% | 0.0% | 0.1% | 4.2% | 0.0% | 7.5% | 5.2 | −1.1% | −2.3 | +3.1 |
| District of Columbia | Watch | Other | 26.0% | 0.0% | 0.0% | 0.0% | 28.6% | 0.0% | 45.4% | 0.2 | +12.6% | +0.0 | +23.5 |
| Florida | Watch | Natural gas | 72.9% | 4.4% | 10.3% | 0.0% | 10.0% | 0.0% | 2.4% | 271.2 | +10.4% | −4.2 | +8.4 |
| Georgia | Watch | Natural gas | 39.7% | 13.7% | 34.6% | 0.0% | 7.7% | 1.8% | 2.5% | 147.6 | +14.7% | −5.9 | +6.0 |
| Hawaii | Watch | Other (mostly oil) | 0.0% | 0.0% | 0.0% | 5.6% | 10.0% | 0.3% | 84.1% | 9.5 | −2.8% | −13.4 | +7.5 |
| Idaho | Warm | Hydro | 24.8% | 0.0% | 0.0% | 13.9% | 8.1% | 50.5% | 2.7% | 22.5 | +22.0% | −0.1 | +5.1 |
| Illinois | Warm | Nuclear | 17.1% | 14.9% | 49.6% | 13.4% | 4.5% | 0.0% | 0.4% | 194.4 | +5.4% | −11.5 | +10.0 |
| Indiana | Hot | Coal | 36.7% | 42.0% | 0.0% | 9.9% | 8.1% | 0.3% | 3.1% | 110.7 | +8.0% | −17.3 | +11.6 |
| Iowa | Warm | Wind | 11.3% | 27.1% | 0.0% | 57.6% | 1.8% | 1.8% | 0.4% | 75.2 | +20.1% | −8.3 | +17.4 |
| Kansas | Watch | Wind | 6.5% | 28.2% | 14.6% | 49.0% | 1.2% | 0.0% | 0.3% | 63.4 | +24.5% | −5.8 | +8.7 |
| Kentucky | Watch | Coal | 27.1% | 63.9% | 0.0% | 0.0% | 3.2% | 5.2% | 0.7% | 71.9 | +0.2% | −8.1 | +3.1 |
| Louisiana | Warm | Natural gas | 70.5% | 5.0% | 16.9% | 0.0% | 2.6% | 0.7% | 4.3% | 107.3 | +7.1% | −2.5 | +2.5 |
| Maine | Watch | Natural gas | 37.4% | 0.2% | 0.0% | 19.6% | 11.0% | 16.3% | 15.4% | 15.2 | +45.0% | −0.5 | +6.8 |
| Maryland | Watch | Natural gas | 41.0% | 7.1% | 38.4% | 1.9% | 4.7% | 3.4% | 3.5% | 38.9 | −1.0% | −7.5 | +4.1 |
| Massachusetts | Watch | Natural gas | 71.3% | 0.0% | 0.0% | 3.6% | 12.3% | 3.6% | 9.3% | 21.2 | −1.2% | +0.0 | +9.4 |
| Michigan | Warm | Natural gas | 45.6% | 18.5% | 20.9% | 7.9% | 3.3% | 1.3% | 2.5% | 124.6 | +6.8% | −13.5 | +6.1 |
| Minnesota | Watch | Wind | 20.8% | 21.3% | 22.5% | 25.1% | 5.9% | 1.6% | 2.7% | 60.3 | +1.6% | −8.7 | +10.5 |
| Mississippi | Hot | Natural gas | 75.9% | 4.2% | 13.2% | 0.7% | 4.4% | 0.0% | 1.7% | 77.2 | +17.1% | −2.5 | +4.6 |
| Missouri | Watch | Coal | 13.2% | 57.0% | 13.8% | 9.7% | 4.0% | 1.3% | 1.1% | 72.9 | −6.9% | −14.1 | +9.9 |
| Montana | Watch | Hydro | 4.0% | 30.0% | 0.0% | 23.2% | 1.0% | 39.4% | 2.3% | 29.0 | +4.5% | −20.7 | +15.6 |
| Nebraska | Warm | Coal | 3.8% | 46.4% | 16.7% | 27.8% | 0.7% | 3.6% | 1.0% | 41.1 | +10.3% | −8.2 | +9.1 |
| Nevada | Warm | Natural gas | 54.0% | 3.7% | 0.0% | 0.7% | 30.4% | 3.0% | 8.1% | 45.7 | +14.4% | −3.1 | +18.2 |
| New Hampshire | Warm | Nuclear | 31.4% | 0.2% | 53.2% | 2.5% | 0.0% | 6.6% | 6.2% | 18.6 | +3.1% | −1.7 | +0.1 |
| New Jersey | Warm | Natural gas | 48.1% | 0.0% | 46.1% | 0.0% | 3.5% | 0.0% | 2.3% | 60.9 | −14.2% | −1.5 | +1.8 |
| New Mexico | Warm | Wind | 25.0% | 21.1% | 0.0% | 36.8% | 16.7% | 0.0% | 0.4% | 44.8 | +27.2% | −20.7 | +30.0 |
| New York | Warm | Natural gas | 47.7% | 0.0% | 20.7% | 5.0% | 4.3% | 19.1% | 3.3% | 133.5 | +1.4% | −0.3 | +5.5 |
| North Carolina | Watch | Natural gas | 41.1% | 13.6% | 30.8% | 0.7% | 9.5% | 3.0% | 1.4% | 137.0 | +4.4% | −9.8 | +4.1 |
| North Dakota | Watch | Coal | 5.2% | 53.3% | 0.0% | 35.6% | 0.0% | 5.8% | 0.2% | 44.4 | +7.9% | −7.9 | +8.3 |
| Ohio | Hot | Natural gas | 56.7% | 21.9% | 11.6% | 1.9% | 6.1% | 0.2% | 1.5% | 154.5 | +27.1% | −16.6 | +6.2 |
| Oklahoma | Watch | Wind | 43.6% | 7.7% | 0.0% | 45.2% | 1.6% | 1.7% | 0.3% | 93.6 | +8.4% | −1.4 | +13.1 |
| Oregon | Warm | Hydro | 31.6% | 0.0% | 0.0% | 14.5% | 4.2% | 48.1% | 1.6% | 68.2 | +9.5% | −4.1 | +7.0 |
| Pennsylvania | Watch | Natural gas | 57.7% | 6.8% | 31.1% | 1.5% | 0.9% | 1.0% | 1.1% | 243.0 | +6.1% | −9.7 | +0.9 |
| Rhode Island | Watch | Natural gas | 86.3% | 0.0% | 0.0% | 1.8% | 8.1% | 0.0% | 3.7% | 9.5 | +24.5% | +0.0 | +6.6 |
| South Carolina | Watch | Nuclear | 23.3% | 17.3% | 52.4% | 0.0% | 3.6% | 2.1% | 1.3% | 102.5 | +2.4% | +2.4 | +2.8 |
| South Dakota | Watch | Wind | 9.9% | 7.4% | 0.0% | 55.5% | 2.0% | 25.0% | 0.2% | 22.4 | +54.4% | −10.6 | +38.3 |
| Tennessee | Warm | Nuclear | 20.7% | 21.0% | 46.4% | 0.0% | 2.4% | 9.5% | 0.0% | 81.2 | −1.4% | −1.7 | +1.9 |
| Texas | Hot | Natural gas | 47.8% | 11.0% | 6.6% | 22.1% | 11.8% | 0.2% | 0.4% | 605.6 | +25.3% | −8.0 | +15.7 |
| Utah | Watch | Natural gas | 38.0% | 37.8% | 0.0% | 1.9% | 18.1% | 2.3% | 2.0% | 38.2 | −2.4% | −26.7 | +12.3 |
| Vermont | Watch | Hydro | 0.1% | 0.0% | 0.0% | 16.5% | 11.3% | 52.9% | 19.3% | 2.1 | −6.3% | +0.0 | +4.8 |
| Virginia | Hot | Natural gas | 56.4% | 3.4% | 26.8% | 0.0% | 9.3% | 1.0% | 3.0% | 104.1 | +7.5% | −0.1 | +8.3 |
| Washington | Watch | Hydro | 11.4% | 1.4% | 8.8% | 7.7% | 0.6% | 68.9% | 1.3% | 111.7 | +5.0% | −5.4 | +2.0 |
| West Virginia | Watch | Coal | 7.1% | 86.7% | 0.0% | 3.2% | 0.5% | 2.2% | 0.3% | 54.7 | −14.4% | −4.3 | +1.2 |
| Wisconsin | Hot | Natural gas | 35.8% | 33.4% | 15.4% | 2.9% | 6.6% | 3.9% | 2.0% | 65.3 | +4.0% | −8.6 | +6.4 |
| Wyoming | Watch | Coal | 11.8% | 52.5% | 0.0% | 30.7% | 1.1% | 2.8% | 1.0% | 44.4 | +5.3% | −31.4 | +21.5 |
Shares of in-state utility-scale net generation, Aug 2025–Jul 2026. Changes compare with calendar 2019. “Other” includes oil, biomass, geothermal, other gases and pumped storage (which uses more power than it makes, so it counts as negative). Data center tier from our data center page. Click a column to sort.
What this means for business owners
From electricity research to an Oregon service business. Generation mix does not establish a customer’s wiring needs or utility capacity. For contractors assessing actual service upgrades, our guide to starting an electrical business in Oregon explains the CCB license, electrical contractor authorization, signing supervisor and project permits.
Indiana electrical businesses. Generation mix provides background for customers asking about backup power or electrification, but it does not tell you the capacity at an individual address. Our guide to starting an electrical business in Indiana explains local licensing, permits, insurance and the business setup behind those projects.
- More plants means more work. New solar farms, gas plants, batteries and power lines all need electricians, equipment operators, HVAC techs and site crews. See trade jobs vs. tech jobs since ChatGPT.
- Your power bill depends on your state. Where your state gets its power affects what you pay, but so do grid costs and state rules. See our commercial electricity costs for service businesses. To see how much business power prices rose in your state, see where business electricity costs rose the most. For whether data center states are paying more, see data centers and power bills by state.
- Watch your state’s data center rules. Many states are changing the tax breaks and power rules for large data centers. Our data center tax break tracker lists every 2025–26 bill.
Methods and sources
- Data. Monthly net generation by state and energy source, all sectors, from EIA Form 923 via the EIA Open Data API v2 (route electricity/electric-power-operational-data). Every month from January 2019 to July 2026 for all 50 states and D.C. Pulled September 28, 2026.
- Periods. “Now” = August 2025 through July 2026, the latest 12 months. “2019” = January through December 2019. We use 12 full months so seasons don’t skew the shares. The CSV also has calendar 2022 and the 12 months before the latest.
- Sources. Natural gas = EIA code NG. Coal = all coal products. Nuclear, wind, solar and conventional hydro as EIA reports them. Other = total minus those six.
- Data center tiers come from our data center page, built from Epoch AI’s list of large AI sites, EIA planned plants and Census jobs data.
Caveats
- This counts power made in a state, not power used there. Many states buy and sell power across state lines. Virginia, for example, imports a large share of its electricity.
- Utility-scale only. Rooftop solar and other small systems under 1 megawatt aren’t included, so solar is undercounted, especially in states like California and Hawaii.
- Recent months are preliminary. EIA revises them, usually by small amounts.
- EIA holds back a few values to protect company data. For the six main sources, 93 state-month values in 15 states are held back in the two periods, mostly small ones like solar in Alaska and New Hampshire or hydro in Florida and New Mexico. That power still counts in the state total and shows up under “Other.”
- Data center tiers show where building is happening, not how much power data centers use. EIA does not report data center electricity use by state.
This page has no ads or affiliate links. EIA is a U.S. government agency, and its data is public domain.
FAQ
What is the main source of electricity in the U.S.?
Natural gas. It made 40.7% of utility-scale power in the 12 months through July 2026. Nuclear was second at 17.7% and coal third at 15.5%.
How much of U.S. electricity comes from solar?
7.5% from utility-scale solar, up from 1.7% in 2019. Rooftop solar adds more but isn’t counted here.
What powers data centers?
Data centers use power from the grid, so they run on the same mix as everything else nearby. In the six fastest-growing data center states, the grid is about half natural gas (50.0%).
Which state makes the most electricity?
Texas, with 606 TWh in the latest 12 months. Florida (271 TWh) and Pennsylvania (243 TWh) are next.
How often is this updated?
EIA releases new monthly data near the end of each month. Check the “Data through” line at the top.