EIA Gasoline & Diesel Fuel Update · Survey week ending Sep 14, 2026 · YoY baseline Sep 15, 2025 · Published Sep 18, 2026
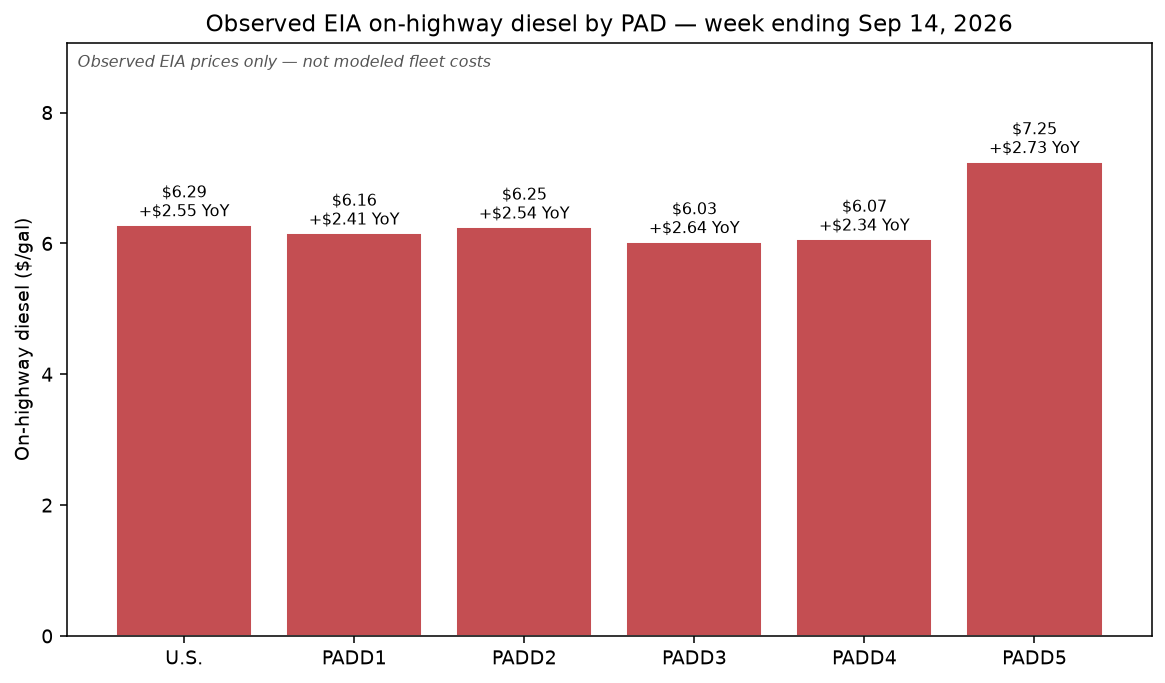
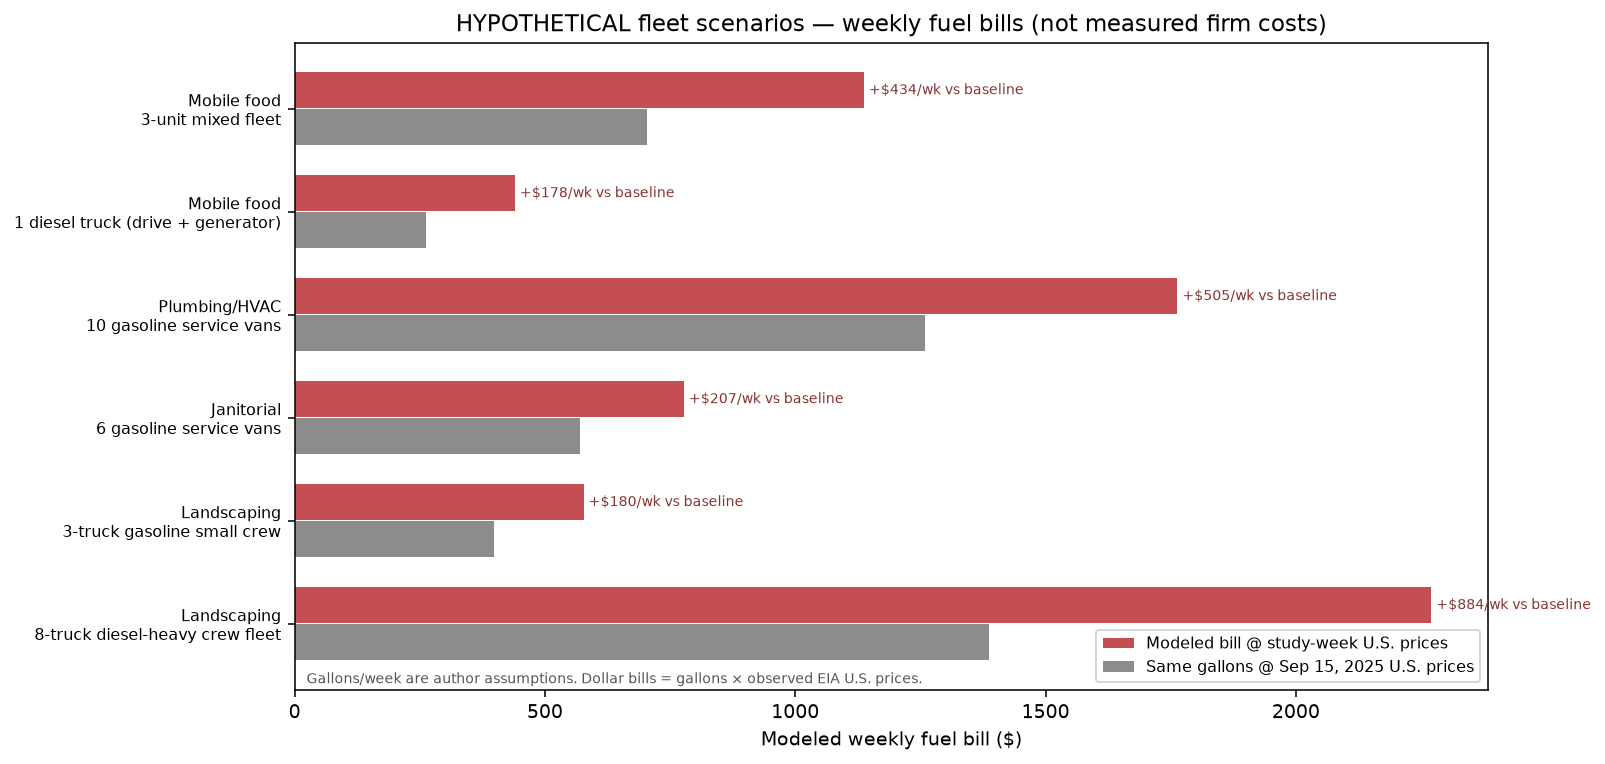
Observed pump prices are elevated; scenario fleet bills show how gallons translate to dollars. For the EIA week ending Sep 14, 2026, U.S. regular gasoline averaged $4.32/gal (+$1.15 vs Sep 15, 2025) and on-highway diesel $6.29/gal (+$2.55 YoY). West Coast (PADD 5) diesel printed $7.25. Separately, documented gallon assumptions for landscaping, janitorial, HVAC/plumbing, and food-truck fleets produce modeled weekly bills — for example an 8-truck diesel-heavy landscaping mix at U.S. prices is about $2,270/week now versus $1,387 at the same gallons a year earlier (+$884/week). Those dollar bills are scenarios, not measured firm costs.
Three findings reporters can use
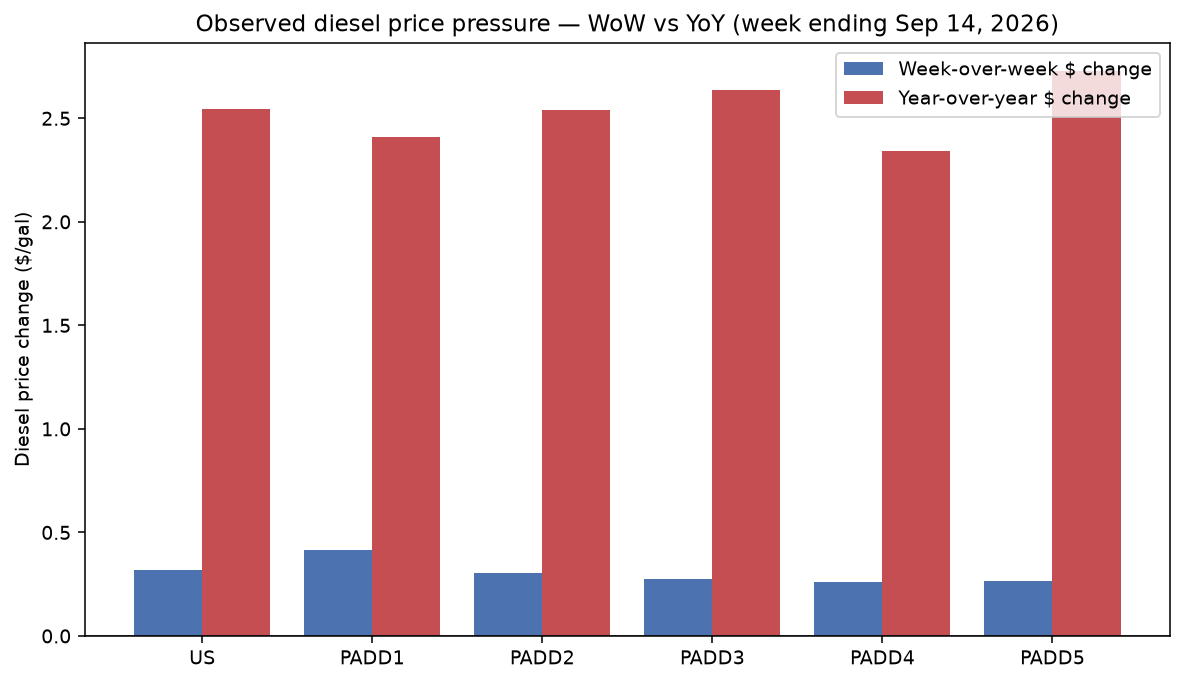
- Observed: U.S. diesel rose +$2.55/gal YoY and +$0.32 WoW to $6.29; regular gasoline rose +$1.15 YoY to $4.32 (week ending Sep 14, 2026 vs Sep 15, 2025 / Sep 7, 2026).
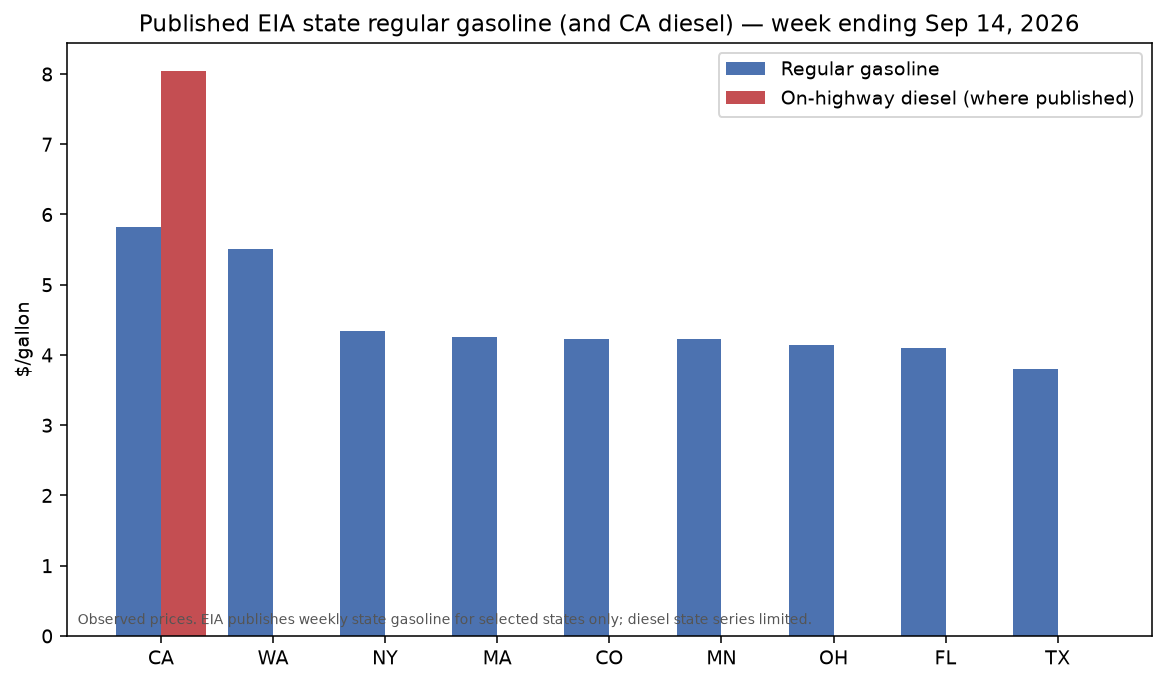
- Observed: Among PAD districts, West Coast (PADD 5) shows the largest diesel YoY increase in this pull (+$2.73 to $7.25); California’s published diesel series is $8.04 (+$3.07 YoY).
- Modeled (same gallons): Holding gallons fixed, the six documented fleet scenarios imply modeled weekly fuel bills $178–$884 higher than the same gallons at Sep 15, 2025 U.S. prices — largest dollar gap on the diesel-heavy 8-truck landscaping mix.
Not a best-state score. This page separates observed EIA prices from documented gallon assumptions. It does not attribute the price path to a single geopolitical cause, and QCEW employment counts are density context only.
Observed EIA prices (PAD + published states)
Series: regular gasoline all formulations (EMM_EPMR_PTE_NUS_DPG and PAD/state siblings) and on-highway No. 2 diesel (EMD_EPD2D_PTE_NUS_DPG). Public workbooks from the Gasoline & Diesel Fuel Update — API key not used.
| Geography | Gas $/gal | Gas WoW | Gas YoY | Diesel $/gal | Diesel WoW | Diesel YoY |
|---|---|---|---|---|---|---|
| U.S. | $4.32 | +$0.16 | +$1.15 | $6.29 | +$0.32 | +$2.55 |
| East Coast (PADD 1) | $4.19 | +$0.16 | +$1.18 | $6.16 | +$0.41 | +$2.41 |
| New England (PADD 1A) | $4.29 | +$0.10 | +$1.20 | $6.20 | +$0.21 | +$2.24 |
| Central Atlantic (PADD 1B) | $4.39 | +$0.15 | +$1.20 | $6.31 | +$0.26 | +$2.39 |
| Lower Atlantic (PADD 1C) | $4.04 | +$0.18 | +$1.15 | $6.10 | +$0.49 | +$2.43 |
| Midwest (PADD 2) | $4.09 | +$0.20 | +$1.11 | $6.25 | +$0.30 | +$2.54 |
| Gulf Coast (PADD 3) | $3.85 | +$0.17 | +$1.08 | $6.03 | +$0.27 | +$2.64 |
| Rocky Mountain (PADD 4) | $4.44 | +$0.12 | +$1.26 | $6.07 | +$0.26 | +$2.34 |
| West Coast (PADD 5) | $5.47 | +$0.10 | +$1.19 | $7.25 | +$0.26 | +$2.73 |
| West Coast except California | — | — | — | $6.57 | +$0.25 | +$2.43 |
Published EIA state gasoline series (selected states only). Diesel state detail in the weekly diesel workbook is limited (California shown when published).
| State | Gas $/gal | Gas WoW | Gas YoY | Diesel $/gal | Diesel YoY | Gas series ID |
|---|---|---|---|---|---|---|
| California | $5.83 | +$0.15 | +$1.36 | $8.04 | +$3.07 | EMM_EPMR_PTE_SCA_DPG |
| Washington | $5.50 | +$0.02 | +$0.97 | — | — | EMM_EPMR_PTE_SWA_DPG |
| New York | $4.34 | +$0.08 | +$1.18 | — | — | EMM_EPMR_PTE_SNY_DPG |
| Massachusetts | $4.25 | +$0.09 | +$1.17 | — | — | EMM_EPMR_PTE_SMA_DPG |
| Colorado | $4.23 | +$0.04 | +$1.15 | — | — | EMM_EPMR_PTE_SCO_DPG |
| Minnesota | $4.22 | +$0.15 | +$1.25 | — | — | EMM_EPMR_PTE_SMN_DPG |
| Ohio | $4.15 | +$0.26 | +$1.31 | — | — | EMM_EPMR_PTE_SOH_DPG |
| Florida | $4.10 | +$0.24 | +$1.14 | — | — | EMM_EPMR_PTE_SFL_DPG |
| Texas | $3.81 | +$0.19 | +$1.03 | — | — | EMM_EPMR_PTE_STX_DPG |
Fleet fuel-bill scenarios
Industries are NAICS contexts used on this site: landscaping 561730, janitorial 561720, plumbing & HVAC 238220 (QCEW published as 23822), mobile food 722330. Practical guides: landscaping, cleaning, HVAC, food truck.
| Scenario | NAICS | Vehicles | Gas gal/wk | Diesel gal/wk | Modeled $/wk now | Same gal @ baseline | Δ $/wk | Δ × 52 (illustrative) |
|---|---|---|---|---|---|---|---|---|
| Landscaping — 8-truck diesel-heavy crew fleet | 561730 | 8 | 60 | 320 | $2,270 | $1,387 | +$884 | +$45,957 |
| Landscaping — 3-truck gasoline small crew | 561730 | 3 | 90 | 30 | $577 | $397 | +$180 | +$9,358 |
| Janitorial — 6 gasoline service vans | 561720 | 6 | 180 | 0 | $777 | $570 | +$207 | +$10,773 |
| Plumbing/HVAC — 10 gasoline service vans | 238220 | 10 | 350 | 40 | $1,763 | $1,258 | +$505 | +$26,244 |
| Mobile food — 1 diesel truck (drive + generator) | 722330 | 1 | 0 | 70 | $440 | $262 | +$178 | +$9,267 |
| Mobile food — 3-unit mixed fleet | 722330 | 3 | 45 | 150 | $1,137 | $703 | +$434 | +$22,552 |
Annualized delta multiplies the weekly gap by 52 for scale only — it is not a forecast of a firm’s yearly fuel invoice.
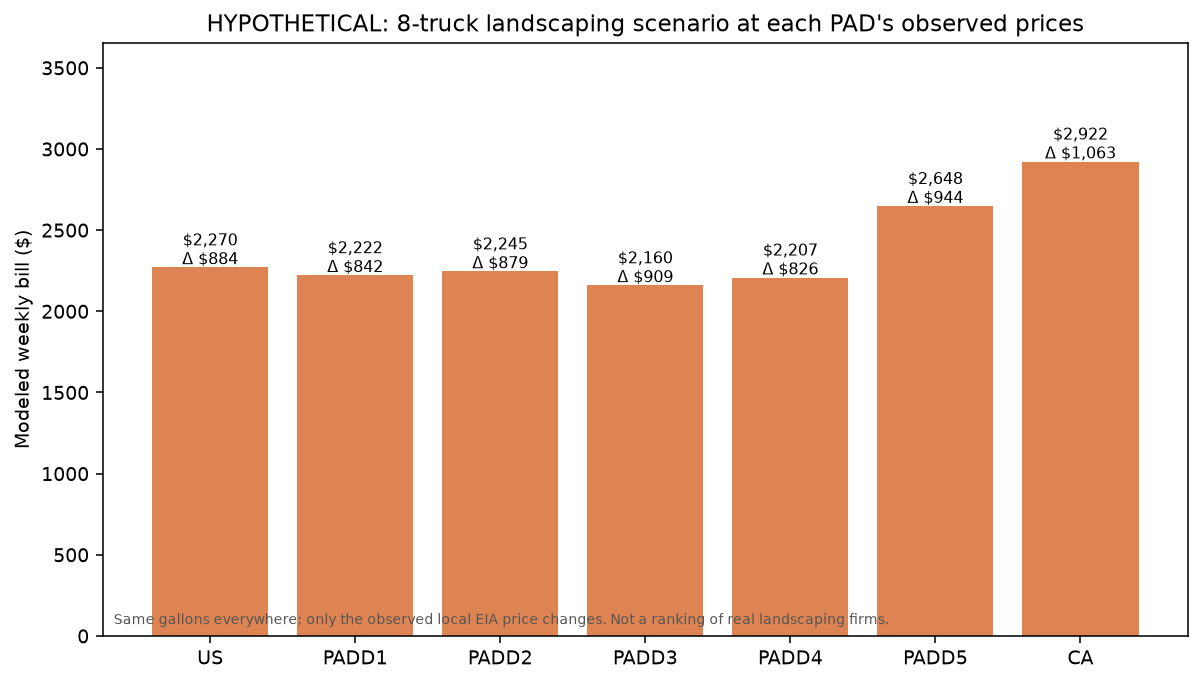
Geo sensitivity: hold the 8-truck landscaping gallon mix fixed and apply each PAD’s observed prices:
| Geography | Gas $/gal | Diesel $/gal | Modeled $/wk | Baseline $/wk | Δ $/wk |
|---|---|---|---|---|---|
| U.S. | $4.32 | $6.29 | $2,270 | $1,387 | +$884 |
| East Coast (PADD 1) | $4.19 | $6.16 | $2,222 | $1,380 | +$842 |
| Midwest (PADD 2) | $4.09 | $6.25 | $2,245 | $1,366 | +$879 |
| Gulf Coast (PADD 3) | $3.85 | $6.03 | $2,160 | $1,251 | +$909 |
| Rocky Mountain (PADD 4) | $4.44 | $6.07 | $2,207 | $1,382 | +$826 |
| West Coast (PADD 5) | $5.47 | $7.25 | $2,648 | $1,704 | +$944 |
| California | $5.83 | $8.04 | $2,922 | $1,859 | +$1,063 |
Charts
Industry employment density (QCEW context)
Private QCEW 2025 annual averages by state. Use as context density for where mobile-heavy employers operate — not as evidence that fuel prices caused employment levels. Mobile food (722330) has more suppressions (dashes).
| State | Land. est | Land. emp | Jan. est | Jan. emp | HVAC est | HVAC emp | Food est | Food emp |
|---|---|---|---|---|---|---|---|---|
| California | 9,962 | 106,225 | 8,281 | 114,328 | 13,023 | 125,858 | 1,335 | 5,592 |
| Florida | 11,487 | 89,426 | 8,596 | 73,796 | 10,921 | 106,398 | 1,344 | 3,707 |
| Texas | 5,830 | 67,017 | 5,588 | 91,722 | 10,012 | 121,180 | 1,076 | 4,276 |
| New York | 7,816 | 37,700 | 4,950 | 72,277 | 7,059 | 68,210 | 471 | 1,703 |
| Pennsylvania | 5,226 | 35,214 | 2,598 | 36,565 | 4,294 | 46,317 | 353 | 1,340 |
| North Carolina | 4,642 | 34,490 | 2,937 | 31,060 | 4,630 | 50,010 | 374 | 1,221 |
| Ohio | 4,539 | 32,488 | 2,574 | 37,082 | 3,479 | 45,951 | 397 | 1,956 |
| Illinois | 5,191 | 31,981 | 2,781 | 48,768 | 4,146 | 40,882 | 258 | 1,083 |
| New Jersey | 4,536 | 28,916 | 2,604 | 33,412 | 3,488 | 31,058 | 101 | 542 |
| Michigan | 3,934 | 28,847 | 1,720 | 30,932 | 2,854 | 33,446 | 310 | 935 |
| Virginia | 2,945 | 26,253 | 2,641 | 39,881 | 2,817 | 36,599 | 262 | 1,253 |
| Georgia | 3,644 | 25,971 | 2,618 | 24,278 | 3,750 | 38,437 | 176 | 579 |
| Massachusetts | 4,264 | 24,369 | 1,847 | 31,441 | 3,144 | 31,954 | 143 | 835 |
| Colorado | 2,266 | 22,022 | 1,598 | 21,250 | 2,781 | 28,509 | 379 | 1,425 |
| Maryland | 1,971 | 20,203 | 1,634 | 24,003 | 1,945 | 31,020 | 177 | 696 |
| Washington | 3,372 | 19,671 | 2,312 | 21,060 | 2,305 | 29,601 | 502 | 1,639 |
| Arizona | 1,703 | 19,096 | 1,417 | 18,805 | 3,011 | 36,519 | 296 | 928 |
| Indiana | 2,632 | 18,363 | 1,564 | 20,433 | 2,244 | 30,984 | 190 | 764 |
| Wisconsin | 2,628 | 17,196 | 1,519 | 22,563 | 2,115 | 25,360 | 164 | 510 |
| Tennessee | 2,122 | 16,955 | 1,340 | 21,410 | 2,348 | 29,228 | 273 | 1,115 |
| Missouri | 2,236 | 16,227 | 1,396 | 17,733 | 2,199 | 23,800 | 220 | 1,468 |
| Minnesota | 2,324 | 14,216 | 1,544 | 18,107 | 1,848 | 22,629 | 270 | 948 |
| South Carolina | 1,847 | 13,715 | 1,383 | 16,786 | 1,831 | 18,374 | 174 | 596 |
| Connecticut | 2,353 | 12,861 | 941 | 15,072 | 1,480 | 13,025 | 124 | 410 |
| Oregon | 2,066 | 12,680 | 1,476 | 11,551 | 1,577 | 16,083 | 474 | 1,700 |
| Utah | 1,672 | 11,959 | 1,056 | 10,111 | 1,758 | 17,464 | 218 | 932 |
| Nevada | 828 | 11,230 | 935 | 13,265 | 1,058 | 16,394 | 121 | 486 |
| Alabama | 1,659 | 10,174 | 1,020 | 12,850 | 2,114 | 19,101 | 176 | 681 |
| Kentucky | 1,446 | 8,980 | 1,000 | 14,907 | 1,776 | 17,889 | 145 | 649 |
| Kansas | 944 | 8,128 | 708 | 8,681 | 1,047 | 13,255 | 87 | 327 |
| Idaho | 1,402 | 7,590 | 819 | 5,693 | 1,137 | 10,516 | 338 | 1,050 |
| Oklahoma | 1,120 | 7,394 | 697 | 7,540 | 1,874 | 16,229 | 117 | 354 |
| Iowa | 1,228 | 7,347 | 752 | 10,640 | 1,142 | 16,044 | 91 | 370 |
| Louisiana | 1,168 | 6,875 | 1,038 | 11,594 | 1,974 | 15,439 | 156 | 408 |
| New Hampshire | 1,119 | 6,141 | 548 | 4,233 | 838 | 5,981 | — | — |
| Nebraska | 903 | 5,928 | 541 | 7,599 | 920 | 11,160 | 64 | 250 |
| Maine | 1,067 | 5,514 | 444 | 3,434 | 876 | 5,604 | — | — |
| Arkansas | 934 | 5,319 | 631 | 9,938 | 1,434 | 11,396 | 207 | 559 |
| Hawaii | 594 | 4,549 | 614 | 5,680 | 546 | 5,060 | 262 | 1,035 |
| Rhode Island | 854 | 4,314 | 416 | 4,055 | 549 | 4,655 | 41 | 152 |
| Mississippi | 766 | 4,305 | 546 | 8,012 | 1,039 | 8,612 | 65 | 242 |
| West Virginia | 533 | 4,249 | 374 | 3,363 | 549 | 4,181 | — | — |
| Delaware | 539 | 4,188 | 429 | 4,652 | 482 | 5,253 | — | — |
| Montana | 765 | 3,967 | 533 | 3,162 | 789 | 5,452 | 108 | 351 |
| New Mexico | 408 | 3,344 | 426 | 4,922 | 737 | 7,150 | 90 | 308 |
| Vermont | 582 | 2,384 | 243 | 1,388 | 332 | 2,507 | — | — |
| South Dakota | 379 | 1,973 | 312 | 2,660 | 462 | 4,567 | — | — |
| Wyoming | 326 | 1,756 | 250 | 1,645 | 380 | 2,453 | — | — |
| North Dakota | 313 | 1,689 | 292 | 2,448 | 401 | 3,889 | — | — |
| Alaska | 201 | 1,139 | 258 | 2,162 | 263 | 2,092 | — | — |
| District of Columbia | 42 | 282 | 302 | 10,880 | 88 | 1,794 | — | — |
Related research
- Section 232 HVAC equipment tariff scenarios — equipment import-duty math for changeout BOMs (distinct from van fuel).
- Commercial electricity costs for service shops (meter power vs pump fuel) — EIA commercial ¢/kWh by state with labeled shop kWh scenarios; different energy cost from gasoline/diesel.
- Small-business rate-hike impact — financing / variable-rate loan scenarios (different shock).
- Landscaping seasonal employment — labor seasonality, not fuel.
- Industry statistics: landscaping, cleaning, HVAC, food truck.
- Startup hubs: landscaping, cleaning service, HVAC, food truck.
Sources and methodology
Observed prices: EIA Gasoline & Diesel Fuel Update weekly Excel files pswrgvwall.xls (regular gasoline, Data 3) and psw18vwall.xls (on-highway diesel, Data 1), survey week ending 2026-09-14, release 2026-09-15. WoW vs 2026-09-07; YoY vs 2025-09-15. EIA_API_KEY was not configured; public downloads only.
Hypothetical bills: documented gallons/week × observed prices. See scenario table footnotes and downloadable CSV rationales. Never present as measured firm costs.
Density: BLS QCEW open annual CSVs, private ownership, 2025. Plumbing/HVAC uses published industry 23822 (6-digit 238220 open endpoint 404). Suppressions omitted.
On-highway diesel ≠ off-road dyed diesel. Station averages ≠ every county. This study does not model route optimization, fuel cards, or tax exemptions.
Frequently asked
Are the weekly dollar bills real company costs?
No. They are scenarios: assumed gallons multiplied by observed EIA prices. Replace the gallons with your own logs to model a specific fleet.
Why only some states for gasoline?
EIA’s weekly retail gasoline table publishes selected states and cities, not all 50. PAD districts cover the full contiguous framework.
Did the study claim a war caused prices?
No. We report observed EIA prices and labeled scenarios. Causal attribution is out of scope.
How is this different from the rate-hike page?
The rate-hike impact study models financing / variable-rate loan payments. This page models operating fuel using EIA pump prices.
Download the data and charts
- Observed EIA price CSV (PAD + published states, WoW/YoY)
- Hypothetical fleet scenario CSV
- Landscaping scenario by PAD CSV
- QCEW industry density by state CSV
Cite with a link to this page. Chart PNGs are linked in the figures above.