Original research · BLS QCEW quarterly employment 2024 · Private NAICS 561730 (Landscaping Services) · Published September 16, 2026
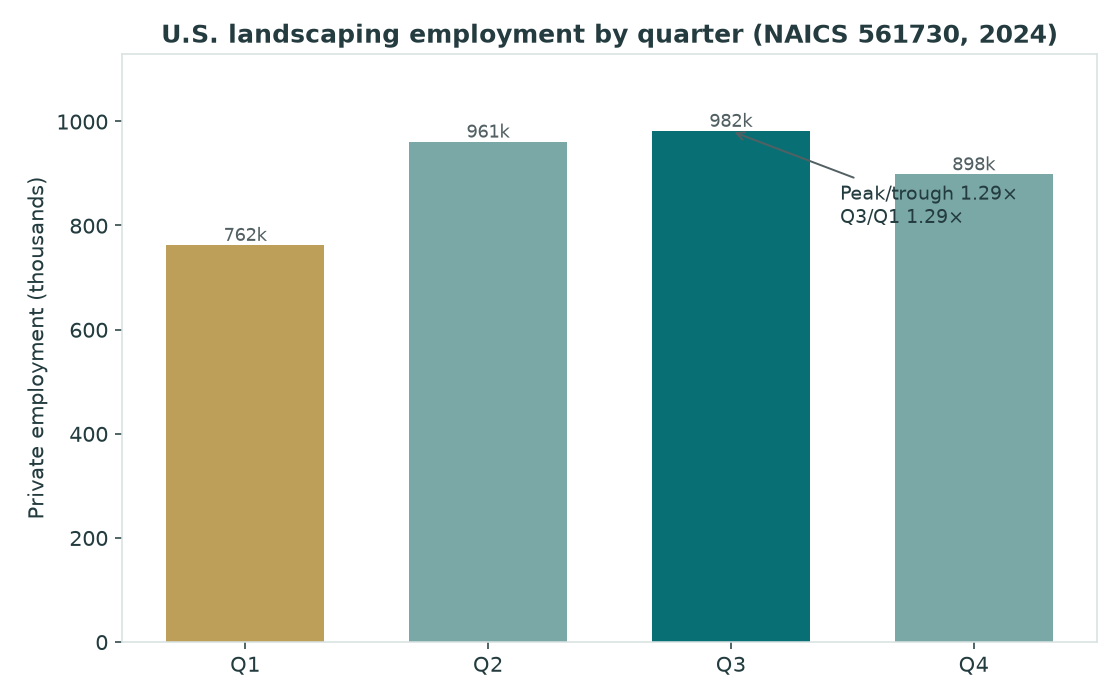
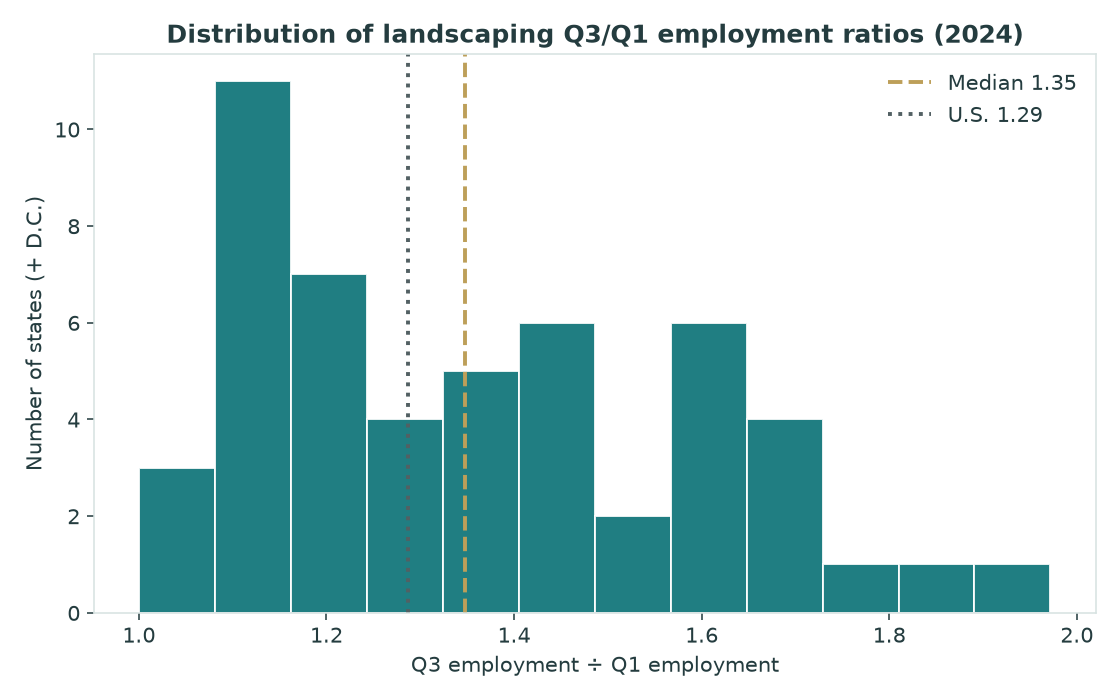
Landscaping jobs are seasonal in many states — and the summer-vs-winter swing is a payroll story, not a Google-search story. U.S. private landscaping employment (NAICS 561730) rose from about 762,448 in Q1 2024 to 981,522 in Q3 (1.29×). Across states, the median peak-to-trough employment ratio is 1.35× — from nearly flat in Hawaii (1.01×) to almost double in Rhode Island (1.97×). This page measures UI-covered jobs, not search interest or owner income.
Source: Bureau of Labor Statistics Quarterly Census of Employment and Wages open industry CSV slices for NAICS 561730. For landscaping market size and annual payroll context, see landscaping industry statistics. For how-to startup walkthroughs, see the landscaping hub.
Key findings
- National summer peak. Private landscaping employment in 2024: Q1 762,448 → Q2 960,884 → Q3 981,522 → Q4 898,048. Peak and trough are Q3 and Q1; both the peak/trough and Q3/Q1 ratios are about 1.29×.
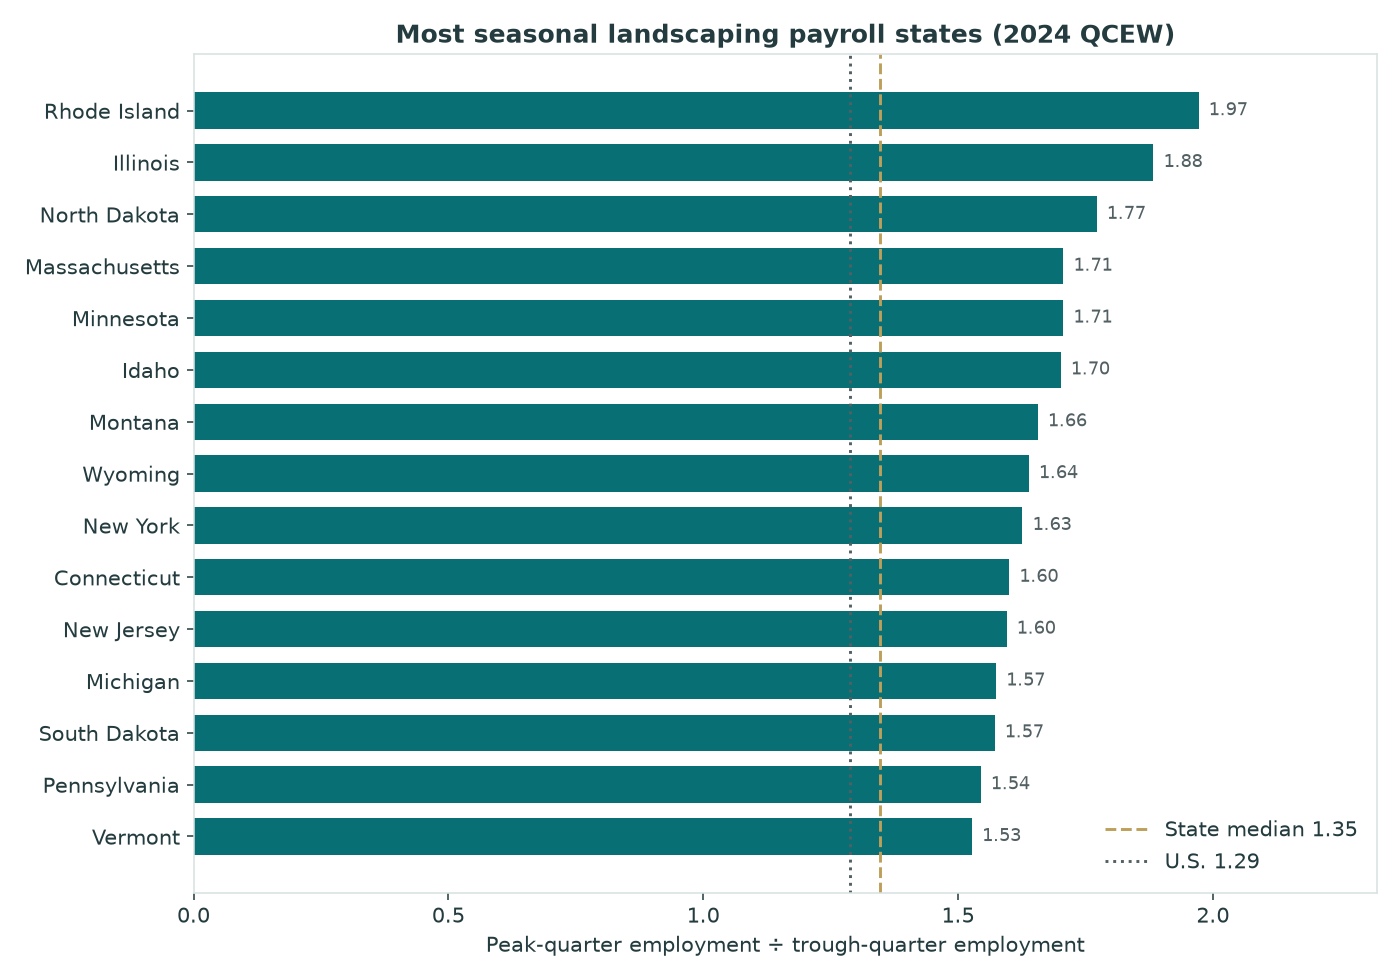
- Cold-winter states dominate amplitude. Highest peak/trough ratios: Rhode Island (1.97×), Illinois (1.88×), North Dakota (1.77×), Massachusetts (1.71×), Minnesota (1.71×). Median across 51 jurisdictions: 1.35×.
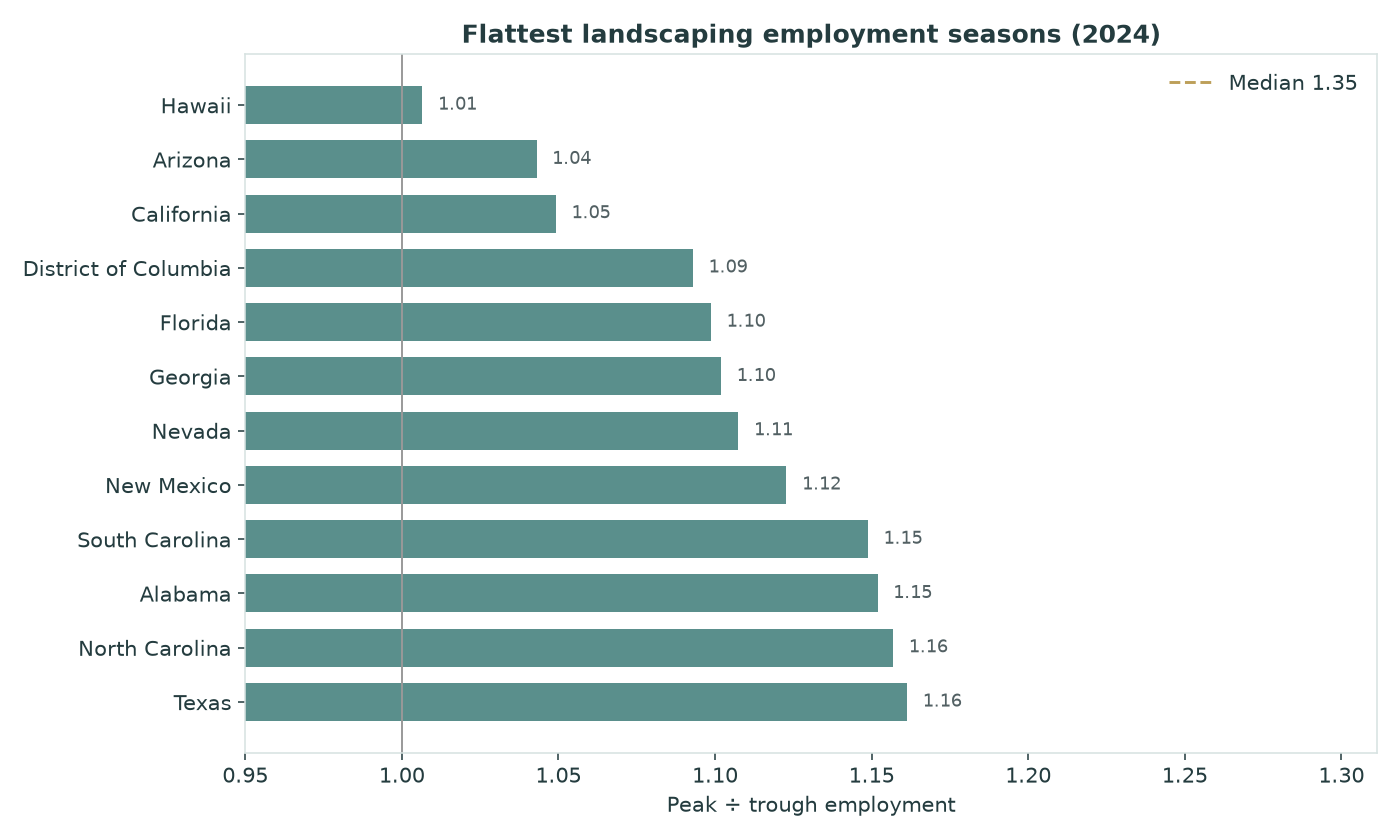
- Year-round climates stay flat. Lowest peak/trough: Hawaii (1.01×), Arizona, California, District of Columbia, Florida — all near 1.0–1.1×.
- Calendar is consistent. 41 jurisdictions peak in Q3; 50 trough in Q1. Employment seasonality is a summer-vs-winter payroll pattern.
- Not the same as search seasonality. National Google Ads interest in starting a landscaping business peaks in April (~2.4× November) on our search-seasonality page. UI-covered employment typically peaks in Q3. We do not invent state search ranks — the live search page is national only — but timing and geography already diverge from a single spring search curve. Hypothesis: supported on measurement/timing grounds.
- Stable year to year. State Q3/Q1 ratios in 2023 and 2024 correlate at about 0.97.
How to read these numbers. Employment is UI-covered wage-and-salary landscaping jobs — not solo operators without payroll, not receipts, and not a “best state” score. Establishments are payroll locations, not unique companies. Average weekly wage is shown for context; wage ratios usually move less than employment ratios.
U.S. quarterly baseline
Private ownership, NAICS 561730, 2024. Employment is the average of the three monthly levels in each quarter.
| Quarter | Employment | Avg weekly wage | vs Q1 |
|---|---|---|---|
| Q1 | 762,448 | $890 | — |
| Q2 | 960,884 | $955 | 1.26× |
| Q3 (peak) | 981,522 | $967 | 1.29× |
| Q4 | 898,048 | $1,051 | 1.18× |
| State | Peak/trough | Q3/Q1 | Peak/trough qtrs | Q1 → Q3 emp |
|---|---|---|---|---|
| Rhode Island | 1.97 | 1.97 | Q3/Q1 | 2,623 → 5,171 |
| Illinois | 1.88 | 1.88 | Q3/Q1 | 20,456 → 38,525 |
| North Dakota | 1.77 | 1.77 | Q3/Q1 | 1,141 → 2,022 |
| Massachusetts | 1.71 | 1.71 | Q3/Q1 | 16,858 → 28,770 |
| Minnesota | 1.71 | 1.71 | Q3/Q1 | 9,580 → 16,347 |
| State | Peak/trough | Q3/Q1 | Peak/trough qtrs | Annual avg emp |
|---|---|---|---|---|
| Hawaii | 1.01 | 1.00 | Q4/Q2 | 4,648 |
| Arizona | 1.04 | 1.04 | Q3/Q1 | 18,894 |
| California | 1.05 | 1.05 | Q3/Q1 | 106,707 |
| District of Columbia | 1.09 | 1.09 | Q3/Q1 | 279 |
| Florida | 1.10 | 1.10 | Q3/Q1 | 87,579 |
Charts
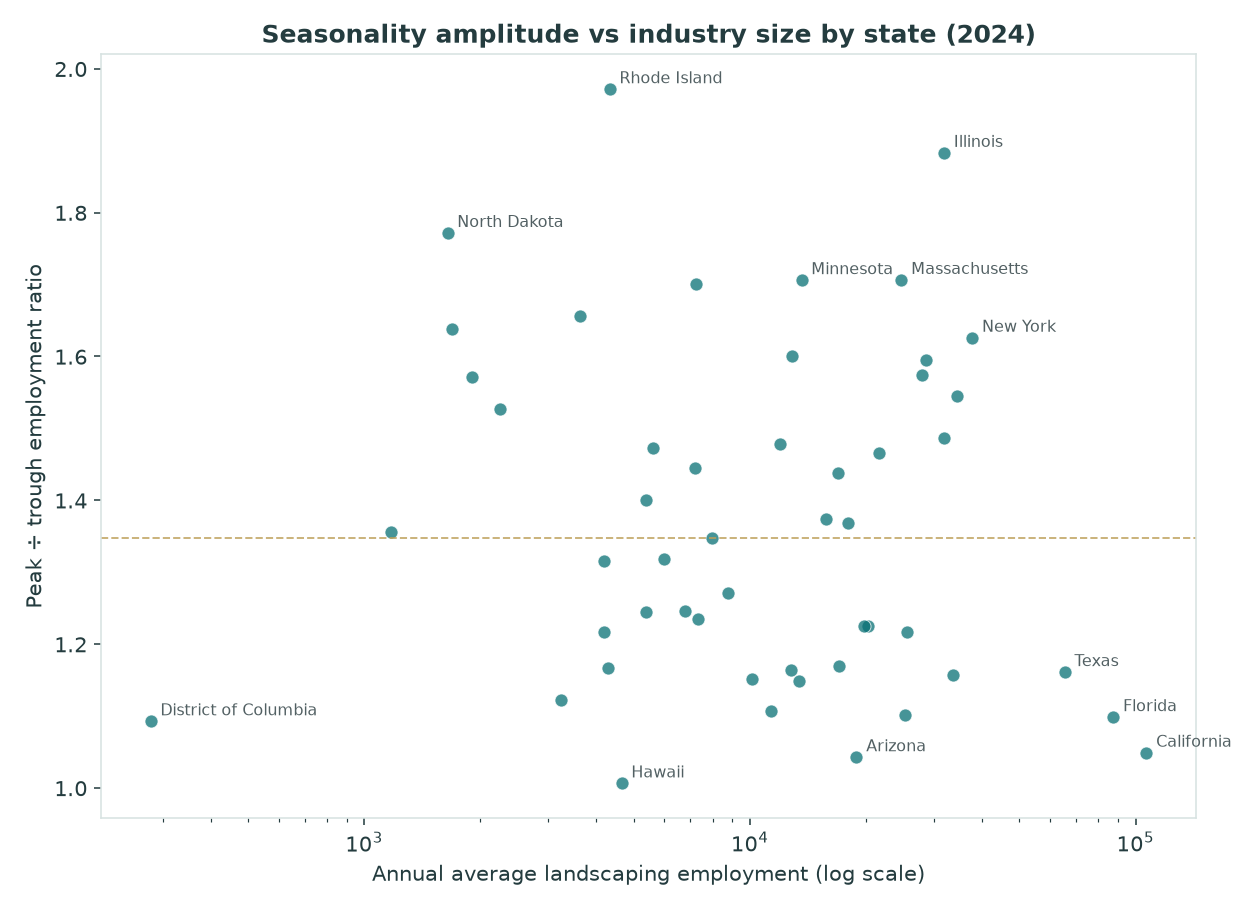
Vs search seasonality (and annual pay)
Our business startup seasonality page tracks national Google Ads Keyword Planner volumes for “how to start a landscaping business.” In the Aug 2025–Jul 2026 window, that query peaks in April at about 2.4× the November trough. It does not publish state-level search ranks, so this study does not invent a joined state ranking.
What we can say without inventing ranks:
- Timing mismatch. Search interest for starting the business peaks in spring; UI-covered landscaping employment typically peaks in Q3 (summer work) and troughs in Q1.
- Geography of payroll swing. Employment amplitude ranks are led by cold-winter Northeast/Midwest states. Warm year-round markets that support large landscaping industries (e.g., California, Florida, Arizona, Hawaii) show modest payroll swings — a map you cannot read off the national April search spike.
- Different from annual pay. Employer pay by state ranks 2024 annual average pay and employees per establishment. Seasonality amplitude is a separate axis: high annual pay or large employment does not imply a large Q3/Q1 swing.
State table (2024)
Sortable by peak/trough ratio (default), Q3/Q1, or annual average employment. State names link to landscaping startup guides.
| State | Q1 emp | Q2 emp | Q3 emp | Q4 emp | Peak | Trough | Peak/trough | Q3/Q1 | PT rank | Annual avg | Q1 AWW | Q3 AWW |
|---|---|---|---|---|---|---|---|---|---|---|---|---|
| Rhode Island | 2,623 | 4,875 | 5,171 | 4,649 | Q3 | Q1 | 1.97 | 1.97 | 1 | 4,330 | $1,010 | $1,036 |
| Illinois | 20,456 | 37,112 | 38,525 | 31,461 | Q3 | Q1 | 1.88 | 1.88 | 2 | 31,888 | $916 | $1,006 |
| North Dakota | 1,141 | 1,810 | 2,022 | 1,602 | Q3 | Q1 | 1.77 | 1.77 | 3 | 1,644 | $723 | $915 |
| Massachusetts | 16,858 | 27,978 | 28,770 | 25,234 | Q3 | Q1 | 1.71 | 1.71 | 4 | 24,710 | $1,077 | $1,200 |
| Minnesota | 9,580 | 15,056 | 16,347 | 13,447 | Q3 | Q1 | 1.71 | 1.71 | 5 | 13,607 | $841 | $1,015 |
| Idaho | 5,084 | 8,063 | 8,649 | 7,153 | Q3 | Q1 | 1.70 | 1.70 | 6 | 7,237 | $702 | $895 |
| Montana | 2,620 | 3,998 | 4,339 | 3,505 | Q3 | Q1 | 1.66 | 1.66 | 7 | 3,615 | $695 | $884 |
| Wyoming | 1,261 | 1,816 | 2,066 | 1,619 | Q3 | Q1 | 1.64 | 1.64 | 8 | 1,690 | $734 | $914 |
| New York | 26,716 | 41,944 | 43,447 | 38,813 | Q3 | Q1 | 1.63 | 1.63 | 9 | 37,730 | $1,007 | $1,071 |
| Connecticut | 9,196 | 14,437 | 14,716 | 13,160 | Q3 | Q1 | 1.60 | 1.60 | 10 | 12,877 | $898 | $1,041 |
| New Jersey | 20,335 | 32,061 | 32,435 | 29,392 | Q3 | Q1 | 1.60 | 1.60 | 11 | 28,556 | $818 | $977 |
| Michigan | 20,541 | 30,688 | 32,342 | 28,235 | Q3 | Q1 | 1.57 | 1.57 | 12 | 27,952 | $910 | $997 |
| South Dakota | 1,420 | 2,108 | 2,232 | 1,830 | Q3 | Q1 | 1.57 | 1.57 | 13 | 1,898 | $725 | $860 |
| Pennsylvania | 25,513 | 39,099 | 39,401 | 33,840 | Q3 | Q1 | 1.54 | 1.54 | 14 | 34,463 | $898 | $948 |
| Vermont | 1,702 | 2,421 | 2,599 | 2,251 | Q3 | Q1 | 1.53 | 1.53 | 15 | 2,243 | $872 | $923 |
| Ohio | 24,279 | 36,104 | 36,011 | 31,180 | Q2 | Q1 | 1.49 | 1.48 | 16 | 31,894 | $904 | $913 |
| Utah | 9,325 | 13,002 | 13,787 | 11,895 | Q3 | Q1 | 1.48 | 1.48 | 17 | 12,002 | $791 | $937 |
| Nebraska | 4,295 | 6,282 | 6,325 | 5,523 | Q3 | Q1 | 1.47 | 1.47 | 18 | 5,606 | $794 | $893 |
| Colorado | 16,994 | 23,406 | 24,900 | 21,215 | Q3 | Q1 | 1.47 | 1.47 | 19 | 21,629 | $947 | $1,038 |
| Iowa | 5,708 | 7,877 | 8,251 | 6,921 | Q3 | Q1 | 1.45 | 1.45 | 20 | 7,189 | $702 | $860 |
| Wisconsin | 13,400 | 18,383 | 19,273 | 16,649 | Q3 | Q1 | 1.44 | 1.44 | 21 | 16,926 | $757 | $939 |
| Maine | 4,323 | 5,760 | 6,054 | 5,354 | Q3 | Q1 | 1.40 | 1.40 | 22 | 5,373 | $933 | $978 |
| Missouri | 12,716 | 17,217 | 17,467 | 15,551 | Q3 | Q1 | 1.37 | 1.37 | 23 | 15,738 | $799 | $883 |
| Indiana | 14,554 | 19,739 | 19,925 | 17,632 | Q3 | Q1 | 1.37 | 1.37 | 24 | 17,962 | $829 | $904 |
| Alaska | 1,017 | 1,163 | 1,378 | 1,134 | Q3 | Q1 | 1.36 | 1.36 | 25 | 1,173 | $730 | $1,032 |
| Kansas | 6,523 | 8,780 | 8,789 | 7,849 | Q3 | Q1 | 1.35 | 1.35 | 26 | 7,985 | $848 | $929 |
| New Hampshire | 5,026 | 6,384 | 6,626 | 5,957 | Q3 | Q1 | 1.32 | 1.32 | 27 | 5,998 | $928 | $1,041 |
| Delaware | 3,479 | 4,530 | 4,576 | 4,137 | Q3 | Q1 | 1.32 | 1.32 | 28 | 4,180 | $900 | $941 |
| Kentucky | 7,557 | 9,607 | 9,464 | 8,402 | Q2 | Q1 | 1.27 | 1.25 | 29 | 8,757 | $826 | $883 |
| Louisiana | 5,917 | 7,148 | 7,370 | 6,713 | Q3 | Q1 | 1.25 | 1.25 | 30 | 6,787 | $775 | $829 |
| Arkansas | 4,796 | 5,967 | 5,709 | 5,029 | Q2 | Q1 | 1.24 | 1.19 | 31 | 5,375 | $760 | $842 |
| Oklahoma | 6,420 | 7,793 | 7,927 | 7,227 | Q3 | Q1 | 1.23 | 1.23 | 32 | 7,342 | $765 | $859 |
| Maryland | 17,866 | 21,893 | 21,423 | 19,915 | Q2 | Q1 | 1.23 | 1.20 | 33 | 20,274 | $905 | $978 |
| Washington | 17,264 | 20,944 | 21,153 | 19,614 | Q3 | Q1 | 1.23 | 1.23 | 34 | 19,744 | $875 | $999 |
| Virginia | 22,343 | 26,769 | 27,202 | 25,647 | Q3 | Q1 | 1.22 | 1.22 | 35 | 25,490 | $886 | $938 |
| Mississippi | 3,706 | 4,511 | 4,424 | 4,092 | Q2 | Q1 | 1.22 | 1.19 | 36 | 4,183 | $781 | $814 |
| Tennessee | 15,488 | 18,108 | 17,988 | 16,330 | Q2 | Q1 | 1.17 | 1.16 | 37 | 16,978 | $849 | $945 |
| West Virginia | 3,945 | 4,605 | 4,418 | 4,208 | Q2 | Q1 | 1.17 | 1.12 | 38 | 4,294 | $896 | $909 |
| Oregon | 11,594 | 13,242 | 13,497 | 12,774 | Q3 | Q1 | 1.16 | 1.16 | 39 | 12,777 | $924 | $993 |
| Texas | 59,656 | 68,275 | 69,280 | 64,949 | Q3 | Q1 | 1.16 | 1.16 | 40 | 65,540 | $903 | $985 |
| North Carolina | 30,723 | 34,834 | 35,543 | 33,624 | Q3 | Q1 | 1.16 | 1.16 | 41 | 33,681 | $832 | $887 |
| Alabama | 9,271 | 10,680 | 10,677 | 9,898 | Q2 | Q1 | 1.15 | 1.15 | 42 | 10,132 | $845 | $900 |
| South Carolina | 12,298 | 13,969 | 14,128 | 13,206 | Q3 | Q1 | 1.15 | 1.15 | 43 | 13,400 | $869 | $919 |
| New Mexico | 3,016 | 3,360 | 3,386 | 3,181 | Q3 | Q1 | 1.12 | 1.12 | 44 | 3,236 | $731 | $805 |
| Nevada | 10,681 | 11,497 | 11,829 | 11,408 | Q3 | Q1 | 1.11 | 1.11 | 45 | 11,354 | $846 | $923 |
| Georgia | 23,638 | 26,048 | 26,011 | 25,007 | Q2 | Q1 | 1.10 | 1.10 | 46 | 25,176 | $1,008 | $985 |
| Florida | 82,889 | 88,565 | 91,069 | 87,793 | Q3 | Q1 | 1.10 | 1.10 | 47 | 87,579 | $836 | $871 |
| District of Columbia | 269 | 281 | 294 | 274 | Q3 | Q1 | 1.09 | 1.09 | 48 | 279 | $858 | $902 |
| California | 103,393 | 106,907 | 108,477 | 108,052 | Q3 | Q1 | 1.05 | 1.05 | 49 | 106,707 | $979 | $1,052 |
| Arizona | 18,390 | 19,157 | 19,180 | 18,851 | Q3 | Q1 | 1.04 | 1.04 | 50 | 18,894 | $871 | $916 |
| Hawaii | 4,645 | 4,634 | 4,648 | 4,664 | Q4 | Q2 | 1.01 | 1.00 | 51 | 4,648 | $879 | $908 |
Planning, guides, and insurance
A fall cleanup schedule also needs an equipment check: our gas leaf-blower restrictions table separates seasonal use windows from year-round prohibitions.
Translate staffing plans into a site-specific estimate with our guide to how to bid on municipal landscaping contracts.
Seasonal payroll swings affect hiring calendars, cash flow, and workers’ compensation exposure — especially where Q3 employment is 50–90% above Q1. Pair this table with:
- Landscaping business guides by state — licensing and registration lead times
- Landscaping business insurance — liability, WC, and equipment coverage context (not a quote engine on this research page)
- Landscaping industry statistics — annual size / payroll context
- Employer pay & location size by state — annual QCEW pay levels
Related (different question): fuel-cost pressure for landscaping fleets (separate from seasonality) — EIA pump prices and hypothetical fleet gallons, not quarterly employment swings.
Seasonal headcount swings also shape which commercial accounts you can staff in peak months — see how to get commercial landscaping contracts for qualifying territory, equipment, and seasonal scope before you bid.
Methods and limitations
Data vintage and filters
BLS QCEW open CSV industry slices for 561730, years/quarters 2024 Q1–Q4 (primary) and 2023 Q1/Q3 (stability). Private ownership (own_code=5), all size classes (size_code=0), state aggregation (agglvl_code=58). Quarterly employment = average of the three monthly employment fields. Peak/trough uses the max and min of the four quarterly averages. Files archived under sources/ with SHA-256 checksums.
What this is not
- Not Google search interest (see startup seasonality).
- Not annual average pay ranks (see employer pay).
- Not nonemployer / sole-proprietor landscaping work.
- Not receipts, profit, or a best-state score.
- Establishments are payroll locations, not unique companies. Suppressions are never treated as zero (none in this 2024 state×561730 pull).
Hypothesis note
SUPPORTED on measurement/timing grounds; state search ranks unavailable. National search for starting a landscaping business peaks in April (2.4× Nov trough), while UI-covered landscaping employment typically peaks in Q3 and troughs in Q1. Cold-winter states dominate employment-amplitude ranks; warm year-round states stay near-flat — a payroll geography that is not the same object as national spring search interest.
FAQ
Are landscaping jobs seasonal?
Yes for UI-covered landscaping payroll in most states. In 2024, 50 jurisdictions trough in Q1 (winter) and 41 peak in Q3 (summer). National private landscaping employment moved from ~762k in Q1 to ~982k in Q3 (about 1.29×). Warm-climate states can be nearly flat.
What can landscapers do in the winter?
This QCEW page measures payroll headcount by quarter, not task lists. Nationally, Q1 is the trough (~762k jobs in 2024) and Q4 (~898k) sits between summer peak and winter low — showing employment does not disappear everywhere, especially where peak/trough ratios stay near 1.0–1.1× (e.g., Hawaii ~1.01×).
Which states swing most for landscaping summer vs winter employment?
Rhode Island leads 2024 peak-to-trough at about 1.97× (Q3 vs Q1). Illinois, North Dakota, Massachusetts, and Minnesota follow in the ~1.7–1.9× band. Hawaii (~1.01×), Arizona, California, D.C., and Florida stay near 1.04–1.10×. Median across states is ~1.35×.
Download
Download CSV — landscaping seasonal employment by state (2024). Columns include Q1–Q4 employment, peak/trough and Q3/Q1 ratios, average weekly wages, establishment counts, and ranks.
Official BLS QCEW program page: bls.gov/cew. Open CSV pattern: https://data.bls.gov/cew/data/api/2024/{quarter}/industry/561730.csv.