Original research · Modeled scenario from BEA, EIA, BLS and Census data · Last updated October 6, 2026
Data through: EIA gas prices for the week of September 28, 2026. State spending: BEA 2025 (latest). Households: ACS 2024. CPI: August 2026. Refreshed every week.
Gas costs 44.1% more than it did on average in 2025. Regular gas averaged $4.46 a gallon the week of September 28, 2026, against $3.10 across 2025, according to EIA. Households spent $389.8 billion on motor fuel in 2025 (BEA). At today’s price, the same driving would cost about $170.8 billion more a year. That is equal to 13.6% of what Americans spend at restaurants and bars. Nebraska households face the biggest hit, about $1,923 each.
Key findings
- About $170.8 billion a year in extra gas spending. That is 2025 motor fuel spending in the 50 states and DC ($389.8 billion) scaled up by the change in the regular gas price, from a 2025 average of $3.10 to $4.46 the week of September 28, 2026. Modeled
- Already about $68.5 billion so far in 2026. Using each week’s actual price over the 39 weeks of 2026 through Sep 28, 2026, households have paid that much more than they would have at 2025 prices for the same driving. Modeled
- Nebraska households take the biggest hit. About $1,923 a year per household, then Missouri ($1,871) and Idaho ($1,818). Hawaii is lowest at $633. The U.S. figure is $1,287. Modeled
- In Iowa, the extra gas money equals 27.1% of restaurant and bar spending. Nationally it is 13.6%. In Hawaii it is 5.3%. Places where people drive a lot and eat out less feel the squeeze on local spending the most. Modeled
- The biggest dollar totals are in the biggest states. California ($17.4 billion), Texas ($17.1 billion) and Florida ($10.6 billion) together account for 26.4% of the national total. Modeled
- The official inflation numbers agree on direction. The BLS consumer price index for gasoline was up 27.4% in August 2026 from a year earlier. By region it rose most in the Northeast (+30.5%) and least in the West (+24.4%). EIA’s weekly pump price has risen another 10.0% since its August 2026 average.
Extra gas spending per household, by state
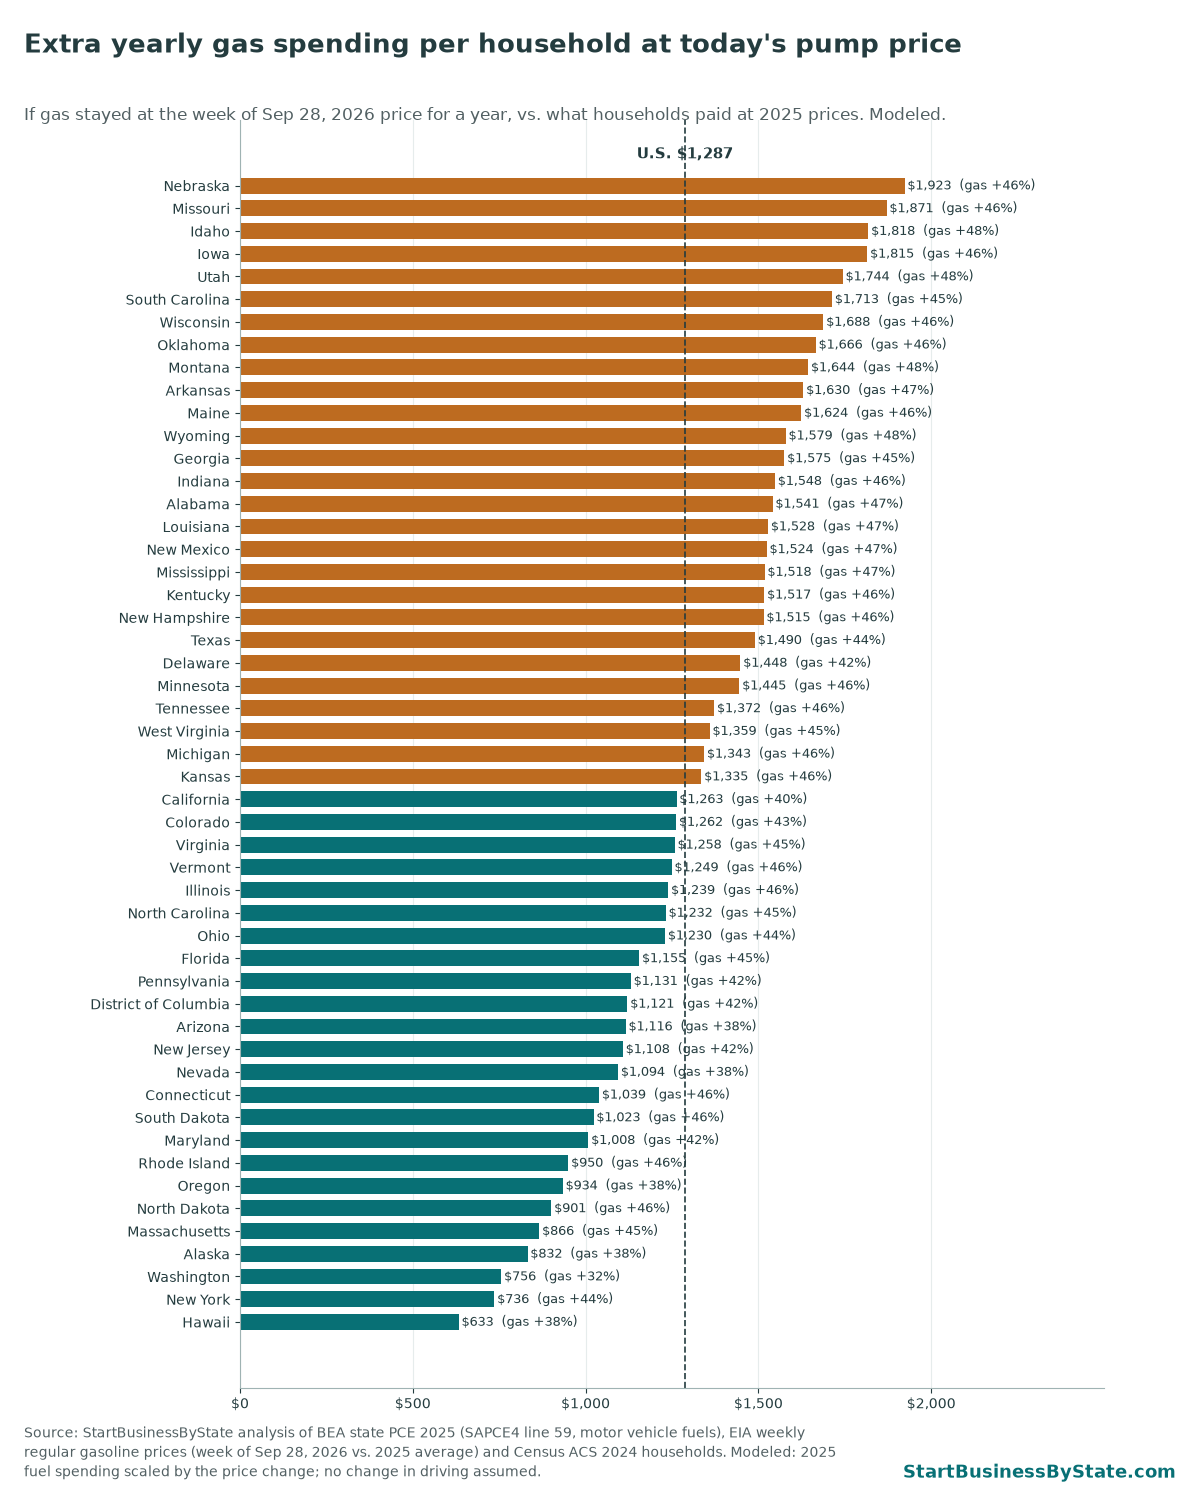
Two things set a state’s number: how much its households already spend on fuel, and how much its pump price has risen. Rural states with long drives spend more per household on gas to begin with, so the same percentage increase costs them more dollars. Gas rose most in the Rocky Mountain region (+48.5% vs. the 2025 average) and least in Washington (+32.0%).
Restaurant spending is the comparison we use for “Main Street” because it’s the biggest category of local, discretionary spending BEA reports by state. The extra gas money isn’t all taken from restaurants. Some comes from savings, some from other purchases, and some people drive less. The percentage shows how big the squeeze is next to a budget local owners care about.
Gas prices and Main Street spending for every state
Click a column header to sort. EIA publishes regular gas prices for 9 states and for regions; other states show their region’s price.
| Rank | State | EIA price area | 2025 avg gas price | Week of Sep 28, 2026 | Change | Motor fuel spending, 2025 | Extra per year Modeled | Extra per household Modeled | Extra as % of restaurant & bar spending | Extra so far in 2026 Modeled |
|---|---|---|---|---|---|---|---|---|---|---|
| 50 states + DC | U.S. average | $3.10 | $4.46 | +44.1% | $389.8 billion | $170.8 billion | $1,287 | 13.6% | $68.5 billion | |
| 1 | Nebraska | Midwest (PADD 2) (region) | $2.94 | $4.29 | +45.7% | $3,464 million | $1,585 million | $1,923 | 24.8% | $598 million |
| 2 | Missouri | Midwest (PADD 2) (region) | $2.94 | $4.29 | +45.7% | $10,483 million | $4,796 million | $1,871 | 22.6% | $1,809 million |
| 3 | Idaho | Rocky Mountain (PADD 4) (region) | $3.02 | $4.49 | +48.5% | $2,819 million | $1,366 million | $1,818 | 26.3% | $508 million |
| 4 | Iowa | Midwest (PADD 2) (region) | $2.94 | $4.29 | +45.7% | $5,331 million | $2,439 million | $1,815 | 27.1% | $920 million |
| 5 | Utah | Rocky Mountain (PADD 4) (region) | $3.02 | $4.49 | +48.5% | $4,264 million | $2,066 million | $1,744 | 21.3% | $768 million |
| 6 | South Carolina | Lower Atlantic (PADD 1C) (region) | $2.89 | $4.20 | +45.1% | $8,447 million | $3,807 million | $1,713 | 20.7% | $1,501 million |
| 7 | Wisconsin | Midwest (PADD 2) (region) | $2.94 | $4.29 | +45.7% | $9,357 million | $4,280 million | $1,688 | 23.3% | $1,614 million |
| 8 | Oklahoma | Midwest (PADD 2) (region) | $2.94 | $4.29 | +45.7% | $5,840 million | $2,672 million | $1,666 | 21.5% | $1,008 million |
| 9 | Montana | Rocky Mountain (PADD 4) (region) | $3.02 | $4.49 | +48.5% | $1,591 million | $771 million | $1,644 | 21.3% | $287 million |
| 10 | Arkansas | Gulf Coast (PADD 3) (region) | $2.68 | $3.92 | +46.6% | $4,362 million | $2,032 million | $1,630 | 24.2% | $856 million |
| 11 | Maine | New England (PADD 1A) (region) | $2.99 | $4.37 | +46.2% | $2,161 million | $999 million | $1,624 | 18.6% | $426 million |
| 12 | Wyoming | Rocky Mountain (PADD 4) (region) | $3.02 | $4.49 | +48.5% | $835 million | $405 million | $1,579 | 19.0% | $150 million |
| 13 | Georgia | Lower Atlantic (PADD 1C) (region) | $2.89 | $4.20 | +45.1% | $14,746 million | $6,646 million | $1,575 | 16.8% | $2,621 million |
| 14 | Indiana | Midwest (PADD 2) (region) | $2.94 | $4.29 | +45.7% | $9,394 million | $4,298 million | $1,548 | 20.2% | $1,621 million |
| 15 | Alabama | Gulf Coast (PADD 3) (region) | $2.68 | $3.92 | +46.6% | $6,812 million | $3,173 million | $1,541 | 20.9% | $1,337 million |
| 16 | Louisiana | Gulf Coast (PADD 3) (region) | $2.68 | $3.92 | +46.6% | $6,064 million | $2,824 million | $1,528 | 18.2% | $1,190 million |
| 17 | New Mexico | Gulf Coast (PADD 3) (region) | $2.68 | $3.92 | +46.6% | $2,803 million | $1,306 million | $1,524 | 18.8% | $550 million |
| 18 | Mississippi | Gulf Coast (PADD 3) (region) | $2.68 | $3.92 | +46.6% | $3,835 million | $1,786 million | $1,518 | 20.6% | $753 million |
| 19 | Kentucky | Midwest (PADD 2) (region) | $2.94 | $4.29 | +45.7% | $6,186 million | $2,830 million | $1,517 | 20.3% | $1,067 million |
| 20 | New Hampshire | New England (PADD 1A) (region) | $2.99 | $4.37 | +46.2% | $1,871 million | $865 million | $1,515 | 15.5% | $369 million |
| 21 | Texas | Texas | $2.66 | $3.84 | +44.4% | $38,431 million | $17,063 million | $1,490 | 14.7% | $7,404 million |
| 22 | Delaware | Central Atlantic (PADD 1B) (region) | $3.12 | $4.41 | +41.5% | $1,439 million | $597 million | $1,448 | 14.6% | $254 million |
| 23 | Minnesota | Minnesota | $2.96 | $4.32 | +45.6% | $7,485 million | $3,416 million | $1,445 | 18.4% | $1,217 million |
| 24 | Tennessee | Midwest (PADD 2) (region) | $2.94 | $4.29 | +45.7% | $8,786 million | $4,019 million | $1,372 | 15.7% | $1,516 million |
| 25 | West Virginia | Lower Atlantic (PADD 1C) (region) | $2.89 | $4.20 | +45.1% | $2,233 million | $1,007 million | $1,359 | 22.4% | $397 million |
| 26 | Michigan | Midwest (PADD 2) (region) | $2.94 | $4.29 | +45.7% | $12,132 million | $5,550 million | $1,343 | 18.3% | $2,093 million |
| 27 | Kansas | Midwest (PADD 2) (region) | $2.94 | $4.29 | +45.7% | $3,516 million | $1,608 million | $1,335 | 17.4% | $607 million |
| 28 | California | California | $4.41 | $6.19 | +40.4% | $43,197 million | $17,430 million | $1,263 | 9.7% | $6,477 million |
| 29 | Colorado | Colorado | $2.87 | $4.09 | +42.8% | $7,321 million | $3,130 million | $1,262 | 11.3% | $1,502 million |
| 30 | Virginia | Lower Atlantic (PADD 1C) (region) | $2.89 | $4.20 | +45.1% | $9,624 million | $4,338 million | $1,258 | 13.4% | $1,711 million |
| 31 | Vermont | New England (PADD 1A) (region) | $2.99 | $4.37 | +46.2% | $772 million | $357 million | $1,249 | 17.2% | $152 million |
| 32 | Illinois | Midwest (PADD 2) (region) | $2.94 | $4.29 | +45.7% | $13,830 million | $6,327 million | $1,239 | 12.7% | $2,386 million |
| 33 | North Carolina | Lower Atlantic (PADD 1C) (region) | $2.89 | $4.20 | +45.1% | $12,295 million | $5,542 million | $1,232 | 14.4% | $2,185 million |
| 34 | Ohio | Ohio | $2.96 | $4.26 | +44.0% | $13,768 million | $6,061 million | $1,230 | 16.1% | $2,594 million |
| 35 | Florida | Florida | $2.96 | $4.28 | +44.8% | $23,545 million | $10,555 million | $1,155 | 10.7% | $4,084 million |
| 36 | Pennsylvania | Central Atlantic (PADD 1B) (region) | $3.12 | $4.41 | +41.5% | $14,614 million | $6,062 million | $1,131 | 14.8% | $2,576 million |
| 37 | District of Columbia | Central Atlantic (PADD 1B) (region) | $3.12 | $4.41 | +41.5% | $891 million | $370 million | $1,121 | 10.9% | $157 million |
| 38 | Arizona | West Coast except California (region) | $3.75 | $5.15 | +37.5% | $8,882 million | $3,327 million | $1,116 | 12.3% | $1,364 million |
| 39 | New Jersey | Central Atlantic (PADD 1B) (region) | $3.12 | $4.41 | +41.5% | $9,467 million | $3,927 million | $1,108 | 10.8% | $1,669 million |
| 40 | Nevada | West Coast except California (region) | $3.75 | $5.15 | +37.5% | $3,617 million | $1,355 million | $1,094 | 12.6% | $555 million |
| 41 | Connecticut | New England (PADD 1A) (region) | $2.99 | $4.37 | +46.2% | $3,271 million | $1,512 million | $1,039 | 11.0% | $645 million |
| 42 | South Dakota | Midwest (PADD 2) (region) | $2.94 | $4.29 | +45.7% | $855 million | $391 million | $1,023 | 13.0% | $147 million |
| 43 | Maryland | Central Atlantic (PADD 1B) (region) | $3.12 | $4.41 | +41.5% | $5,838 million | $2,421 million | $1,008 | 11.1% | $1,029 million |
| 44 | Rhode Island | New England (PADD 1A) (region) | $2.99 | $4.37 | +46.2% | $921 million | $426 million | $950 | 8.6% | $182 million |
| 45 | Oregon | West Coast except California (region) | $3.75 | $5.15 | +37.5% | $4,347 million | $1,629 million | $934 | 10.2% | $668 million |
| 46 | North Dakota | Midwest (PADD 2) (region) | $2.94 | $4.29 | +45.7% | $689 million | $315 million | $901 | 13.4% | $119 million |
| 47 | Massachusetts | Massachusetts | $2.97 | $4.32 | +45.3% | $5,405 million | $2,450 million | $866 | 7.8% | $1,068 million |
| 48 | Alaska | West Coast except California (region) | $3.75 | $5.15 | +37.5% | $609 million | $228 million | $832 | 7.2% | $94 million |
| 49 | Washington | Washington | $4.13 | $5.45 | +32.0% | $7,487 million | $2,395 million | $756 | 8.2% | $1,055 million |
| 50 | New York | New York | $3.06 | $4.41 | +44.2% | $13,052 million | $5,764 million | $736 | 6.8% | $2,483 million |
| 51 | Hawaii | West Coast except California (region) | $3.75 | $5.15 | +37.5% | $833 million | $312 million | $633 | 5.3% | $128 million |
Rank = extra per household, highest first. Motor fuel spending = BEA personal consumption expenditures on motor vehicle fuels, lubricants and fluids by residents of each state. Restaurant & bar spending = BEA “purchased meals and beverages.” Households = ACS 2024 1-year estimates. Prices are regular gasoline, dollars per gallon, including taxes.
Download the data (CSV)Gas prices this year vs. the 2025 average
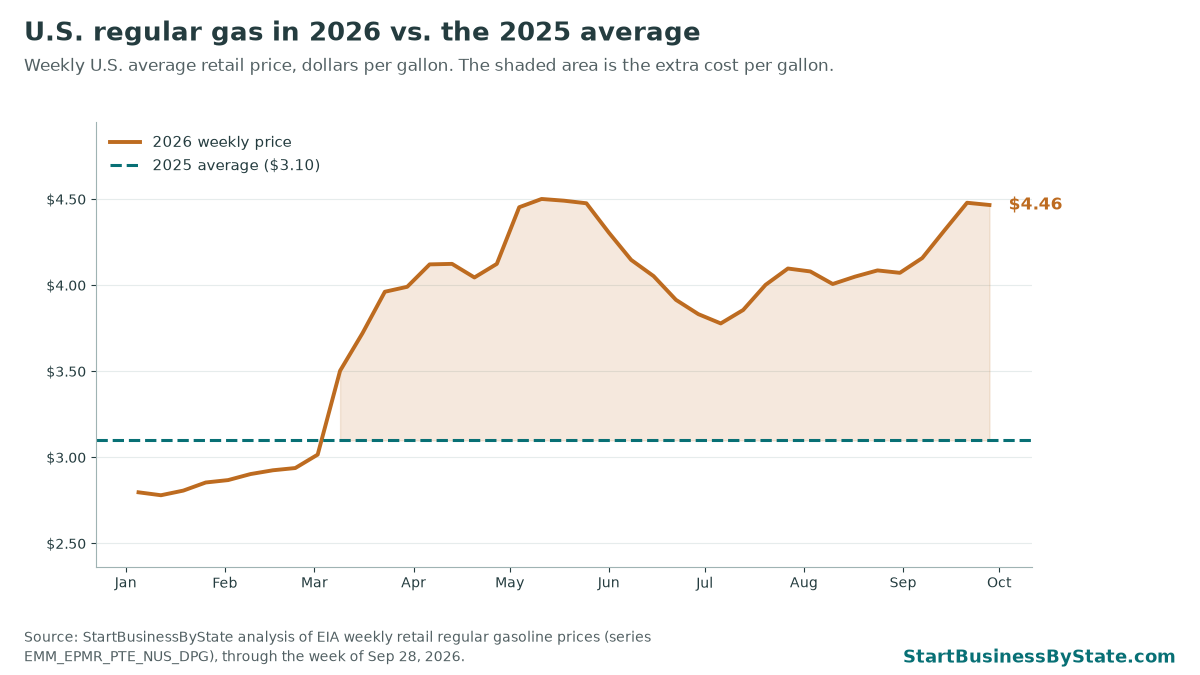
The yearly number at the top assumes this week’s price holds for 12 months. Prices move every week, so we also show a figure based on what households actually paid each week this year. That “so far in 2026” total, $68.5 billion, is the safer number to quote for money already spent. For diesel and gas prices by region every week, see our diesel and gas price tracker.
How this hits your business
When gas jumps, your customers don’t get a raise to cover it. The money comes out of other spending, and small, local, “nice to have” purchases are often first to go. If you’re starting a business that depends on people spending freely, plan for a tighter year.
- Restaurants, cafes and food trucks. Expect more price-checking and smaller orders. A visible value item can keep regulars coming. Food truck owners can test event prices with our food truck event profit calculator. To see how much dining-out money each state’s shops share, see dining-out dollars per shop.
- Salons and barbers. Clients may stretch the time between visits. Pre-booking the next appointment at checkout helps. Run your numbers with the salon break-even calculator using a few fewer visits a month than you hope for.
- Home services: cleaning, lawn care, HVAC. You’re hit from both sides. Customers have less to spend, and your own vans cost more to run. Put a fuel line or trip charge in your quotes. See fuel costs for mobile service businesses and how to price a commercial cleaning contract.
- Your launch budget. Keep a few extra months of cash before opening. Sales can ramp slower when household budgets are squeezed. Interest costs are up too: see how the Fed’s rate hike hits small-business loans.
If you’re still choosing what to start, ask how easily a customer could skip buying from you for a month. The harder it is to put off, the less a gas spike should cut into your sales.
How we did this
- Spending. U.S. Bureau of Economic Analysis, Regional API, table SAPCE4 (personal consumption expenditures by state by function), line 59 motor vehicle fuels, lubricants and fluids; line 102 purchased meals and beverages; line 1 total PCE. 2025, millions of current dollars. Pulled October 6, 2026.
- Gas prices. EIA Open Data API v2, route petroleum/pri/gnd, product EPMR (regular gasoline, all formulations), series EMM_EPMR_PTE_[area]_DPG. Weekly, January 2025 through the week of September 28, 2026. The 2025 average is the simple average of 2025’s weekly prices.
- States and regions. States EIA publishes (California, Colorado, Florida, Massachusetts, Minnesota, New York, Ohio, Texas, Washington) use their own price. Other states use their EIA region: New England, Central Atlantic, Lower Atlantic, Midwest, Gulf Coast, Rocky Mountain, or West Coast except California.
- Households. Census Bureau American Community Survey 2024 1-year estimates, table B11001.
- CPI cross-check. BLS consumer price index, gasoline (all types), U.S. city average and the four Census regions, not seasonally adjusted, series CUUR0000SETB01, CUUR0100SETB01, CUUR0200SETB01, CUUR0300SETB01, CUUR0400SETB01, August 2026 vs. a year earlier.
- Extra per year = 2025 motor fuel spending × (this week’s regular gas price ÷ the 2025 average price − 1).
- Extra so far in 2026 = 2025 motor fuel spending ÷ 52, times each week’s price change, added up over the 39 weeks of 2026 so far.
- We assume people drive the same amount as in 2025. In reality some cut back when gas is expensive, so actual extra spending is likely somewhat smaller.
- BEA’s motor fuel line includes a small amount of diesel and lubricants. We apply the regular gasoline price change to all of it.
- The restaurant comparison is for scale. It does not mean every extra gas dollar comes out of restaurant spending.
Caveats
- BEA counts spending by state of residence. Gas bought by visitors and businesses is not in these numbers.
- A region’s gas price is an average. Real prices differ by town and station, and some states in a region pay more or less because of state gas taxes. State gas-tax suspensions (Indiana since spring 2026, Georgia from Sep 29 and Ohio from Oct 4) show up only as far as they move EIA’s state and regional prices. Weeks before a suspension started do not include it (Ohio’s holiday began after the latest week in this edition).
- BEA revises state spending each year. Dollar figures are not adjusted for inflation.
BEA, EIA, BLS and Census data are public domain. This page has no ads or affiliate links. Cite as: StartBusinessByState, “The Gas-Price Drain on Main Street, by State,” updated October 6, 2026, https://startbusinessbystate.com/gas-prices-main-street-spending-by-state/
Related research
- Diesel and gas prices by state: this week’s EIA prices for every region.
- Dining-out dollars per food-service shop, by state.
- Personal income vs. business formation: where incomes and new businesses grew.
- Service business openings, closings and churn.
- Commercial natural gas prices by state: what restaurants and laundromats pay for gas.
- Diesel shock cost by state: the extra diesel bill in every state.
- Small businesses paying higher prices, by state: Census survey data on rising costs.
- Small Business Saturday by state: how many small stores each state has.
FAQ
How much more are Americans spending on gas in 2026?
If prices stayed at the week of Sep 28, 2026 level for a year, households would spend about $170.8 billion more on motor fuel than at 2025 prices, about $1,287 per household. Using actual weekly prices so far in 2026, the extra comes to about $68.5 billion. Both are StartBusinessByState estimates from BEA, EIA and Census data.
Which state is hit hardest by high gas prices?
Per household, Nebraska ($1,923 a year), Missouri ($1,871) and Idaho ($1,818). In total dollars, California is highest at $17.4 billion.
Do high gas prices hurt small businesses?
They take money out of the same budgets people use for eating out, haircuts and home services. Nationally, the extra gas spending in our estimate equals 13.6% of what people spend at restaurants and bars. Businesses that drive to customers also pay more for their own fuel.
How did you estimate this?
We took each state’s 2025 spending on motor vehicle fuels from the Bureau of Economic Analysis and scaled it by how much the regular gas price in that state or its EIA region has changed since the 2025 average. We assume people drive the same amount, so the result shows the size of the squeeze, not a forecast.
Why doesn’t my state have its own gas price?
EIA publishes weekly regular gas prices for 9 states and for regions. Other states use their region’s price, labeled “region” in the table. State spending and household counts are specific to each state.
How often is this updated?
Gas prices update every week after EIA’s Monday release. State spending updates once a year when BEA publishes new state consumer spending data. This version uses 2025 spending and prices through the week of September 28, 2026.
Last updated October 6, 2026. Gas prices through the week of September 28, 2026. EIA posts new weekly prices on Mondays (Tuesdays after a federal holiday), and we refresh after each release.