By StartBusinessByStatePublisher: Robert SmithResearch process
Fixed edition analyzed September 16, 2026. BEA Regional SAINC1 personal income and per capita personal income for 2021–2025 (API note: last updated April 9, 2026 — new 2025; revised 2020–2024), current dollars. Census Business Formation Statistics business applications (BA, not seasonally adjusted) summed to calendar years 2021–2025. Correlation check only — not a ranking and not causation.
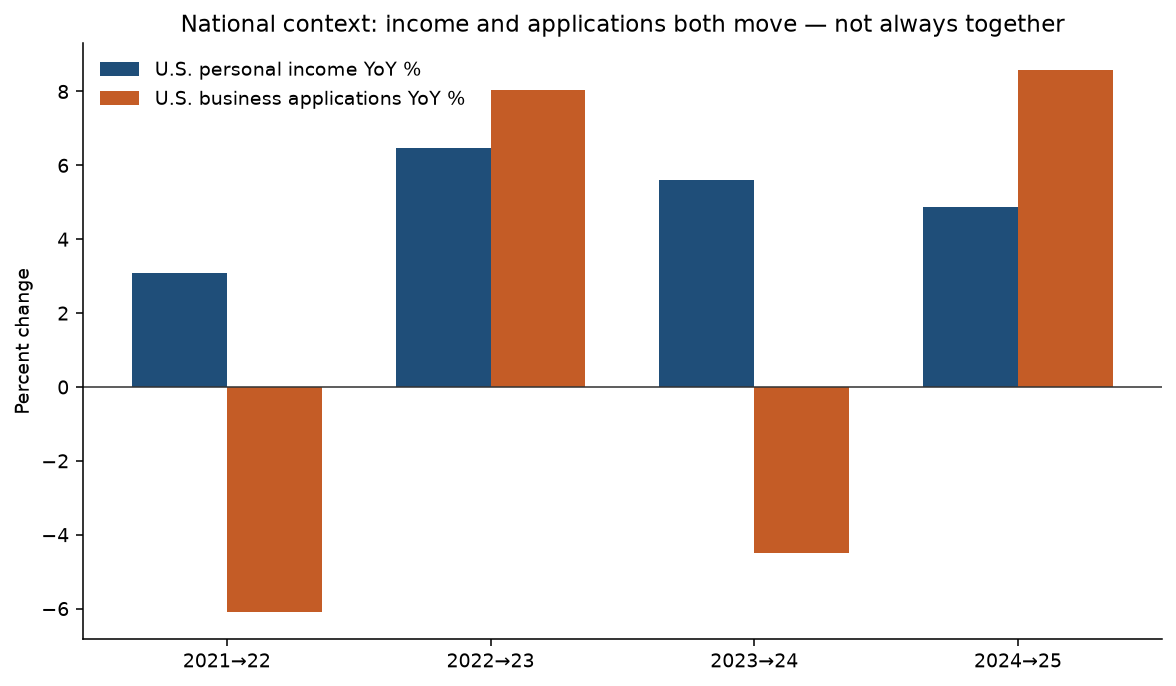
U.S. personal income rose +4.9% from 2024 to 2025, while Americans filed 5,671,836 business applications in calendar 2025 (+8.6% from 2024). Do the states with the fastest income growth also post the fastest application growth?
Mostly no. Across 50 states and D.C., the 2024→2025 Pearson correlation between personal-income growth and business-application growth is +0.09 (Spearman +0.05). That is a near-zero association — the same humble framing as our state migration vs business formation study. Income growth and application filings can both rise nationally without lining up state by state.
Ready to set up your own business?
Move from comparing markets to the filing steps, records and formation services for your company.
What we compared
- Income: BEA table SAINC1 line 1 (personal income, millions of current dollars) and line 3 (per capita personal income). Not inflation-adjusted; see Methods for the optional real-income check on earlier years.
- Applications: Census BFS monthly BA, non-seasonally adjusted, summed to calendar years so the clock matches annual income — the same CY approach as the migration study, not the January–August 2026 state window or separate 2025 county reporting year on our business formation statistics page.
- Metric: Year-over-year percent change, then scatter and rank correlation. We also report results without Wyoming and Delaware, whose extreme per-capita application rates are discussed on the formation page.
The latest year barely agrees
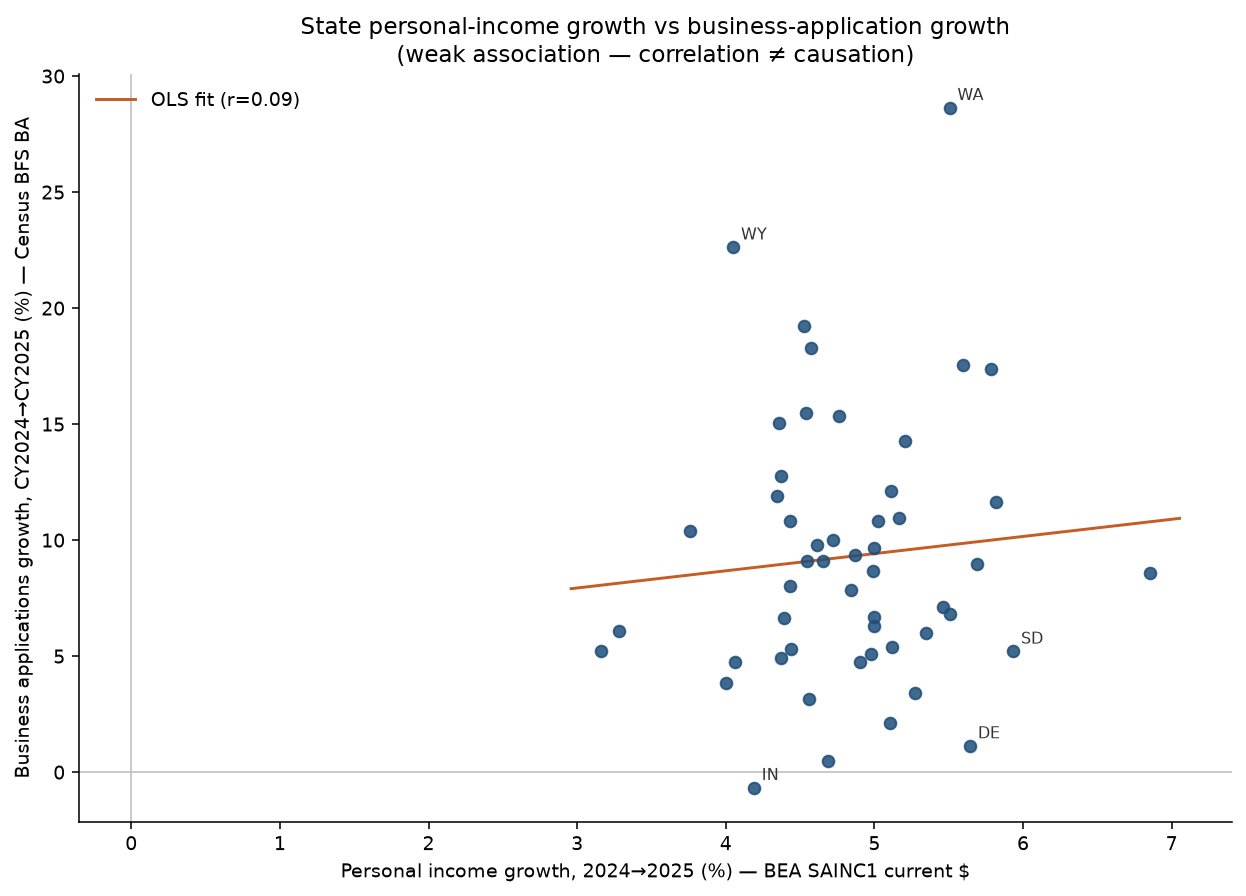
Removing Wyoming and Delaware still leaves a weak link (r = +0.20, ρ = +0.15, n = 49). Per capita personal income growth is no better as a predictor of application growth (r = +0.11).
In 2024→2025, 50 of 51 jurisdictions saw both income and applications rise. Only Indiana posted rising income with falling applications (-0.7% apps). Shared national direction is not the same as aligned state rankings.
The association is unstable across years
| Window | Pearson r (ΔPI vs Δapps) | Spearman ρ | Pearson r (ΔPCPI vs Δapps) | n |
|---|---|---|---|---|
| 2021→2022 | +0.61 | +0.60 | +0.66 | 51 |
| 2022→2023 | -0.21 | -0.22 | -0.22 | 51 |
| 2023→2024 | +0.04 | -0.06 | +0.07 | 51 |
| 2024→2025 | +0.09 | +0.05 | +0.11 | 51 |
| Pooled panel | +0.33 | +0.23 | — | 204 |
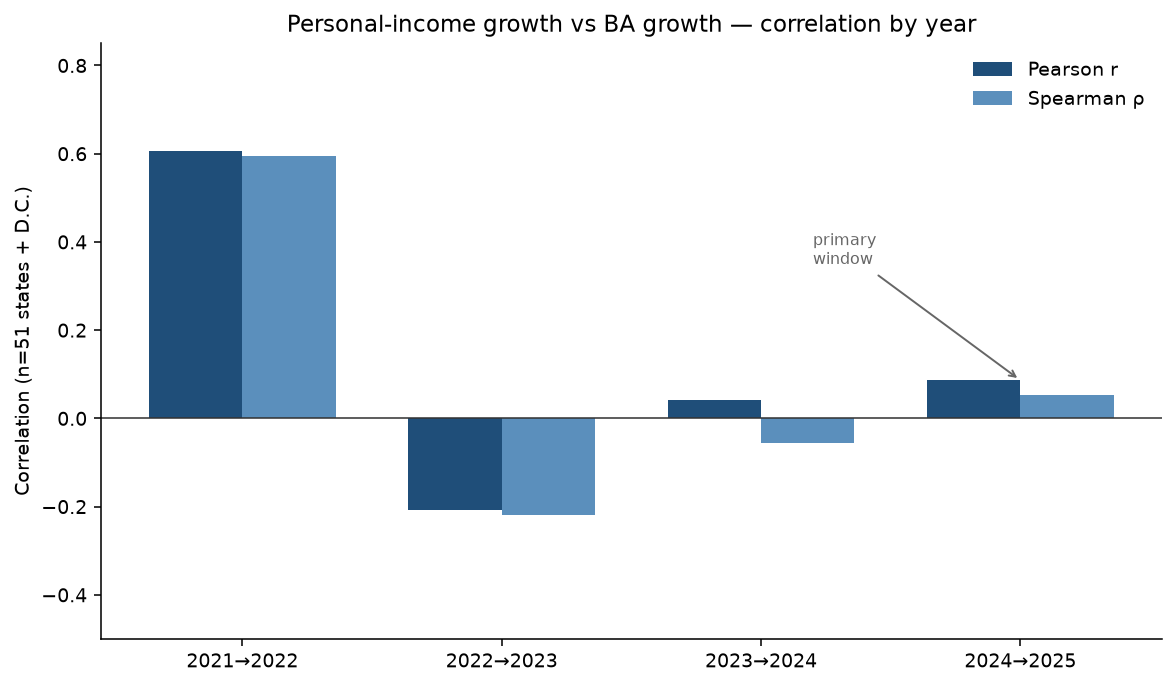
2021→2022 shows a moderate positive association; 2022→2023 flips mildly negative; the two most recent windows sit near zero. A pooled panel average (r ≈ 0.33) still does not justify treating income growth as a formation ranking signal.
Where the rankings diverge
| State | PI growth | PI rank | Apps growth | Apps rank | Rank gap |
|---|---|---|---|---|---|
| Wyoming | +4.1% | #47 | +22.6% | #2 | -45 |
| Delaware | +5.6% | #6 | +1.1% | #49 | +43 |
| South Dakota | +5.9% | #2 | +5.2% | #40 | +38 |
| Nevada | +5.3% | #12 | +3.4% | #46 | +34 |
| Wisconsin | +4.4% | #43 | +15.1% | #9 | -34 |
| Missouri | +4.5% | #36 | +19.2% | #3 | -33 |
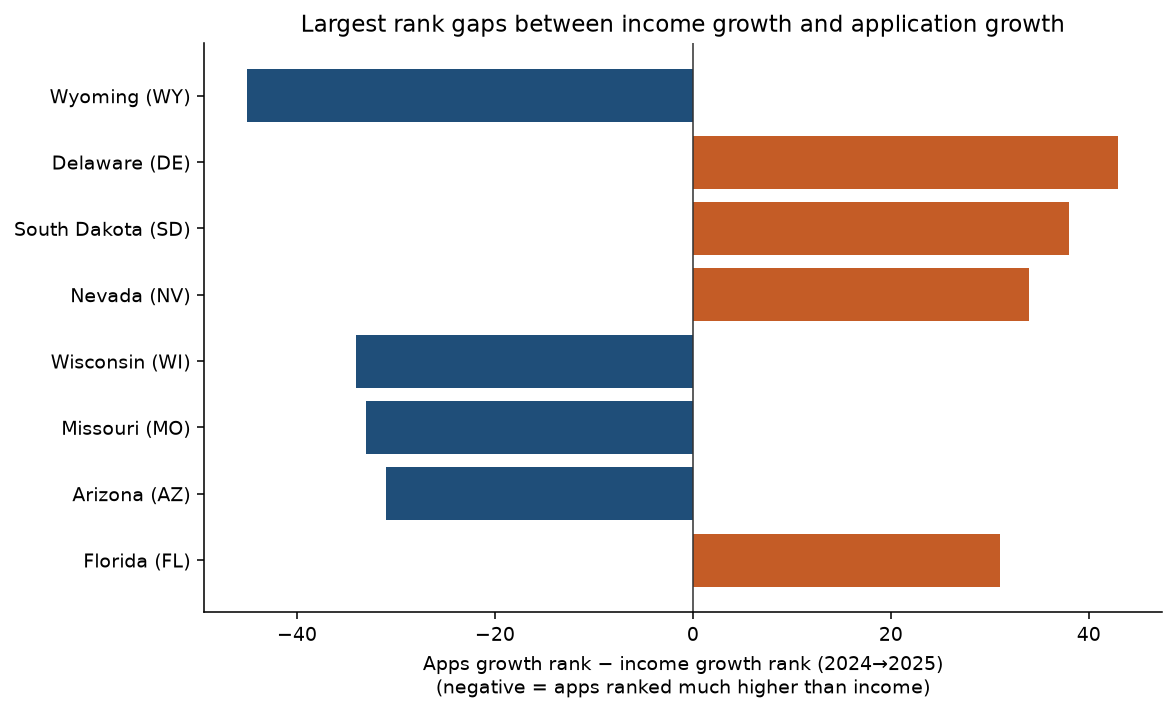
Wyoming’s application surge alongside middling income growth — and Delaware’s stronger income growth alongside soft application growth — fit the measurement caveats on our formation statistics page: BFS counts applications, not local employer births.
All 50 states and D.C. (2024→2025)
Download the CSV: personal-income-vs-business-formation-2024-2025.csv.
| State | PI 2024 ($M) | PI 2025 ($M) | PI YoY | PCPI YoY | Apps 2024 | Apps 2025 | Apps YoY | Rank gap |
|---|---|---|---|---|---|---|---|---|
| Hawaii | 102,703.8 | 109,742.4 | +6.8% | +7.0% | 18,014 | 19,558 | +8.6% | 26 |
| South Dakota | 69,996.3 | 74,150.0 | +5.9% | +5.0% | 11,494 | 12,092 | +5.2% | 38 |
| North Carolina | 724,994.6 | 767,182.6 | +5.8% | +4.4% | 163,580 | 182,653 | +11.7% | 11 |
| Kansas | 195,633.0 | 206,945.7 | +5.8% | +5.4% | 31,982 | 37,534 | +17.4% | 2 |
| South Carolina | 332,982.7 | 351,926.0 | +5.7% | +4.2% | 86,364 | 94,104 | +9.0% | 20 |
| Delaware | 71,594.2 | 75,635.2 | +5.6% | +4.7% | 59,463 | 60,132 | +1.1% | 43 |
| New Mexico | 124,086.2 | 131,026.8 | +5.6% | +5.7% | 34,673 | 40,758 | +17.6% | -2 |
| Idaho | 124,746.7 | 131,619.9 | +5.5% | +4.0% | 31,144 | 33,267 | +6.8% | 23 |
| Washington | 677,934.6 | 715,263.1 | +5.5% | +4.5% | 110,542 | 142,196 | +28.6% | -8 |
| California | 3,400,237.3 | 3,585,890.9 | +5.5% | +5.5% | 517,133 | 553,931 | +7.1% | 20 |
| Oklahoma | 260,910.2 | 274,858.0 | +5.3% | +4.7% | 53,645 | 56,855 | +6.0% | 25 |
| Nevada | 228,086.6 | 240,111.7 | +5.3% | +4.3% | 62,655 | 64,781 | +3.4% | 34 |
| Tennessee | 480,671.2 | 505,698.3 | +5.2% | +4.3% | 90,327 | 103,220 | +14.3% | -3 |
| Montana | 78,741.6 | 82,807.2 | +5.2% | +4.5% | 26,939 | 29,887 | +10.9% | 1 |
| North Dakota | 57,153.4 | 60,077.4 | +5.1% | +4.3% | 8,455 | 8,912 | +5.4% | 22 |
| Florida | 1,706,305.7 | 1,793,464.1 | +5.1% | +4.2% | 634,356 | 647,734 | +2.1% | 31 |
| Mississippi | 153,256.4 | 161,093.5 | +5.1% | +5.0% | 46,805 | 52,467 | +12.1% | -4 |
| Texas | 2,184,833.3 | 2,294,646.6 | +5.0% | +3.7% | 490,959 | 544,146 | +10.8% | -2 |
| Nebraska | 145,798.5 | 153,082.3 | +5.0% | +4.3% | 20,862 | 22,876 | +9.7% | 1 |
| New Hampshire | 117,220.3 | 123,076.5 | +5.0% | +4.5% | 15,977 | 17,046 | +6.7% | 13 |
| Utah | 235,907.4 | 247,691.4 | +5.0% | +3.9% | 68,471 | 72,787 | +6.3% | 13 |
| Arkansas | 183,201.8 | 192,345.6 | +5.0% | +4.4% | 36,365 | 39,512 | +8.7% | 4 |
| Rhode Island | 78,553.7 | 82,465.2 | +5.0% | +4.6% | 11,226 | 11,800 | +5.1% | 18 |
| Georgia | 704,463.9 | 738,993.1 | +4.9% | +4.0% | 243,084 | 254,582 | +4.7% | 20 |
| Pennsylvania | 924,379.6 | 969,412.5 | +4.9% | +4.8% | 147,457 | 161,275 | +9.4% | -3 |
| Alabama | 295,590.5 | 309,906.4 | +4.8% | +4.2% | 65,324 | 70,466 | +7.9% | 3 |
| Alaska | 56,423.1 | 59,110.5 | +4.8% | +4.7% | 9,130 | 10,531 | +15.3% | -19 |
| Colorado | 494,798.6 | 518,167.9 | +4.7% | +4.3% | 130,718 | 143,807 | +10.0% | -9 |
| Maine | 96,850.3 | 101,392.7 | +4.7% | +4.2% | 14,118 | 14,186 | +0.5% | 21 |
| Iowa | 211,425.4 | 221,266.3 | +4.7% | +4.4% | 32,113 | 35,038 | +9.1% | -7 |
| Virginia | 681,552.2 | 712,992.6 | +4.6% | +3.9% | 126,386 | 138,762 | +9.8% | -11 |
| Kentucky | 267,297.9 | 279,513.8 | +4.6% | +4.0% | 54,138 | 64,042 | +18.3% | -28 |
| New York | 1,699,680.0 | 1,777,164.5 | +4.6% | +4.5% | 291,884 | 301,047 | +3.1% | 14 |
| Minnesota | 437,981.9 | 457,907.5 | +4.5% | +4.0% | 67,673 | 73,825 | +9.1% | -10 |
| Ohio | 766,045.8 | 800,799.1 | +4.5% | +4.2% | 145,662 | 168,207 | +15.5% | -28 |
| Missouri | 405,457.2 | 423,808.7 | +4.5% | +4.1% | 85,028 | 101,393 | +19.2% | -33 |
| Illinois | 947,182.8 | 989,192.4 | +4.4% | +4.3% | 171,362 | 189,879 | +10.8% | -21 |
| New Jersey | 806,558.7 | 842,372.2 | +4.4% | +4.0% | 153,020 | 161,138 | +5.3% | 1 |
| West Virginia | 97,970.7 | 102,315.6 | +4.4% | +4.5% | 15,167 | 16,387 | +8.0% | -11 |
| Connecticut | 349,377.1 | 364,716.0 | +4.4% | +4.0% | 46,736 | 49,834 | +6.6% | -7 |
| Massachusetts | 667,993.0 | 697,205.3 | +4.4% | +4.2% | 75,426 | 79,139 | +4.9% | 1 |
| Michigan | 645,846.8 | 674,070.6 | +4.4% | +4.1% | 134,838 | 152,060 | +12.8% | -31 |
| Wisconsin | 403,888.3 | 421,498.1 | +4.4% | +4.1% | 62,118 | 71,475 | +15.1% | -34 |
| Arizona | 498,903.6 | 520,574.1 | +4.3% | +3.4% | 121,271 | 135,679 | +11.9% | -31 |
| Indiana | 443,688.8 | 462,278.6 | +4.2% | +3.6% | 90,375 | 89,768 | -0.7% | 6 |
| Oregon | 302,582.3 | 314,868.7 | +4.1% | +3.9% | 59,813 | 62,652 | +4.8% | -3 |
| Wyoming | 50,815.4 | 52,873.5 | +4.0% | +3.7% | 64,444 | 79,023 | +22.6% | -45 |
| Vermont | 46,229.3 | 48,079.2 | +4.0% | +4.3% | 7,295 | 7,575 | +3.8% | -3 |
| Louisiana | 284,587.2 | 295,288.3 | +3.8% | +3.7% | 68,514 | 75,620 | +10.4% | -31 |
| Maryland | 496,413.9 | 512,715.9 | +3.3% | +3.0% | 95,446 | 101,253 | +6.1% | -15 |
| District of Columbia | 78,079.5 | 80,546.6 | +3.2% | +2.8% | 14,205 | 14,945 | +5.2% | -12 |
What this can and cannot tell you
Once you have chosen a market for your own business, use the LLC setup guide for the filing process and startup financing options to compare ways to fund the opening budget.
- Correlation is not cause. Coefficients are reported with sample size. A value near 0.1 is a weak association, not a mechanism.
- Current dollars. SAINC1 personal income is not inflation-adjusted. Real personal income (BEA SARPI) was available through 2024 in this pull and does not change the weak-link conclusion for those earlier windows.
- Applications ≠ employers or LLCs. BFS BA is EIN filing intent. Most applications never become employer businesses; see business formation statistics for conversion context and business survival rates by state for later outcomes.
- Different question than migration. Household moves (IRS) and personal-income growth (BEA) are related but not the same. Both pair weakly with application growth in their respective matched windows.
- Labor market sibling. For whether unemployment changes track service payroll hiring, see unemployment vs service hiring by state.
- Price-level sibling. For BEA SARPP regional price parities vs OEWS wages and NDCP daycare prices (purchasing-power check), see regional price parities vs wages and daycare.
Industry context: cleaning, landscaping, HVAC, and daycare industry statistics.
Income is only half of a household budget. For the cost side, see how gas prices eat into household spending by state.
Methods (short)
BEA API Regional / SAINC1 lines 1 and 3 for years 2021–2025; percent changes matched to Census BFS calendar-year BA sums (NSA series filters matching prior SBL BFS pulls; CY2023 U.S. total 5,469,302 matches the migration study). Primary window 2024→2025; panel also 2021→2022 through 2023→2024. Full documentation: methods notes in the study work folder.
Sources
| Data | Source | Vintage |
|---|---|---|
| State personal income & PCPI | BEA Regional SAINC1 (API) | 2021–2025; API note Apr 9, 2026 |
| Real personal income (optional) | BEA Regional SARPI | 2021–2024 in this pull |
| Business applications (BA) | U.S. Census Bureau, Business Formation Statistics | CY2021–CY2025 monthly NSA sums |
Your next step: plan your LLC formation
Dataset license and reuse
Reuse terms, version September 27, 2026. You may quote our original findings and summary statistics with credit to StartBusinessByState.com and a link to this page. Keep the source names, data years, units and relevant limitations with quoted figures.
This permission covers our original contributions to this dataset. It does not relicense underlying source data or grant blanket permission to redistribute third-party datasets. Source data retains its provider’s terms, and public-domain material remains public domain. Any additional reuse permissions stated elsewhere on this page still apply. For other reuse of our original material, contact us.