Original research · EIA Natural Gas Monthly + BLS establishment counts · Last updated October 7, 2026
Data through: EIA state commercial prices for July 2026 (state data runs about two months behind). Restaurant and laundry counts: BLS QCEW, 2026 Q1. Refreshed monthly.
Commercial natural gas prices rose in 42 of 46 states we could compare. North Carolina (+36.4%), Hawaii (+24.5%) and Delaware (+23.7%) had the biggest increases in the average price businesses paid over the last 12 months. Nevada fell the most (−39.5%). For a restaurant that uses as much gas as the average U.S. food-service building, the national increase adds about $814 a year. In North Carolina it adds about $2,743.
Key findings
- Businesses paid 10.6% more for natural gas. The U.S. commercial price averaged $11.77 per Mcf from August 2025 through July 2026, against $10.64 in the previous 12 months. In July 2026 alone it was $13.03, up 2.0% from July 2025.
- North Carolina had the biggest increase. Its 12-month average rose from $10.49 to $14.31 (+36.4%). Hawaii (+24.5%) and Delaware (+23.7%) were next. Three states rose 20% or more.
- Prices fell in 4 states. Nevada dropped 39.5%, to $5.39, the lowest commercial price in the country. Rhode Island fell 7.3%.
- Most of the increase came from the gas itself. The city gate price, what utilities pay for gas before it moves through local pipes, rose from $4.58 to $5.40 per Mcf (+17.8%). That covers $0.81 of the $1.13 rise in the business price. Delivery and utility charges, the gap between the two, grew by $0.32.
- Hawaii pays the most by far. Its 12-month average was $44.79 per Mcf, followed by Massachusetts ($19.06) and California ($16.70). The lowest were Nevada ($5.39) and New Mexico ($5.97).
- 632,336 restaurant locations are exposed. That is the BLS count of private full-service and limited-service restaurant establishments in 2026 Q1. California (81,044), Texas (53,362) and Florida (43,592) have the most. There are also 10,091 coin-operated laundry and dry-cleaner locations with employees.
Where commercial natural gas prices rose the most
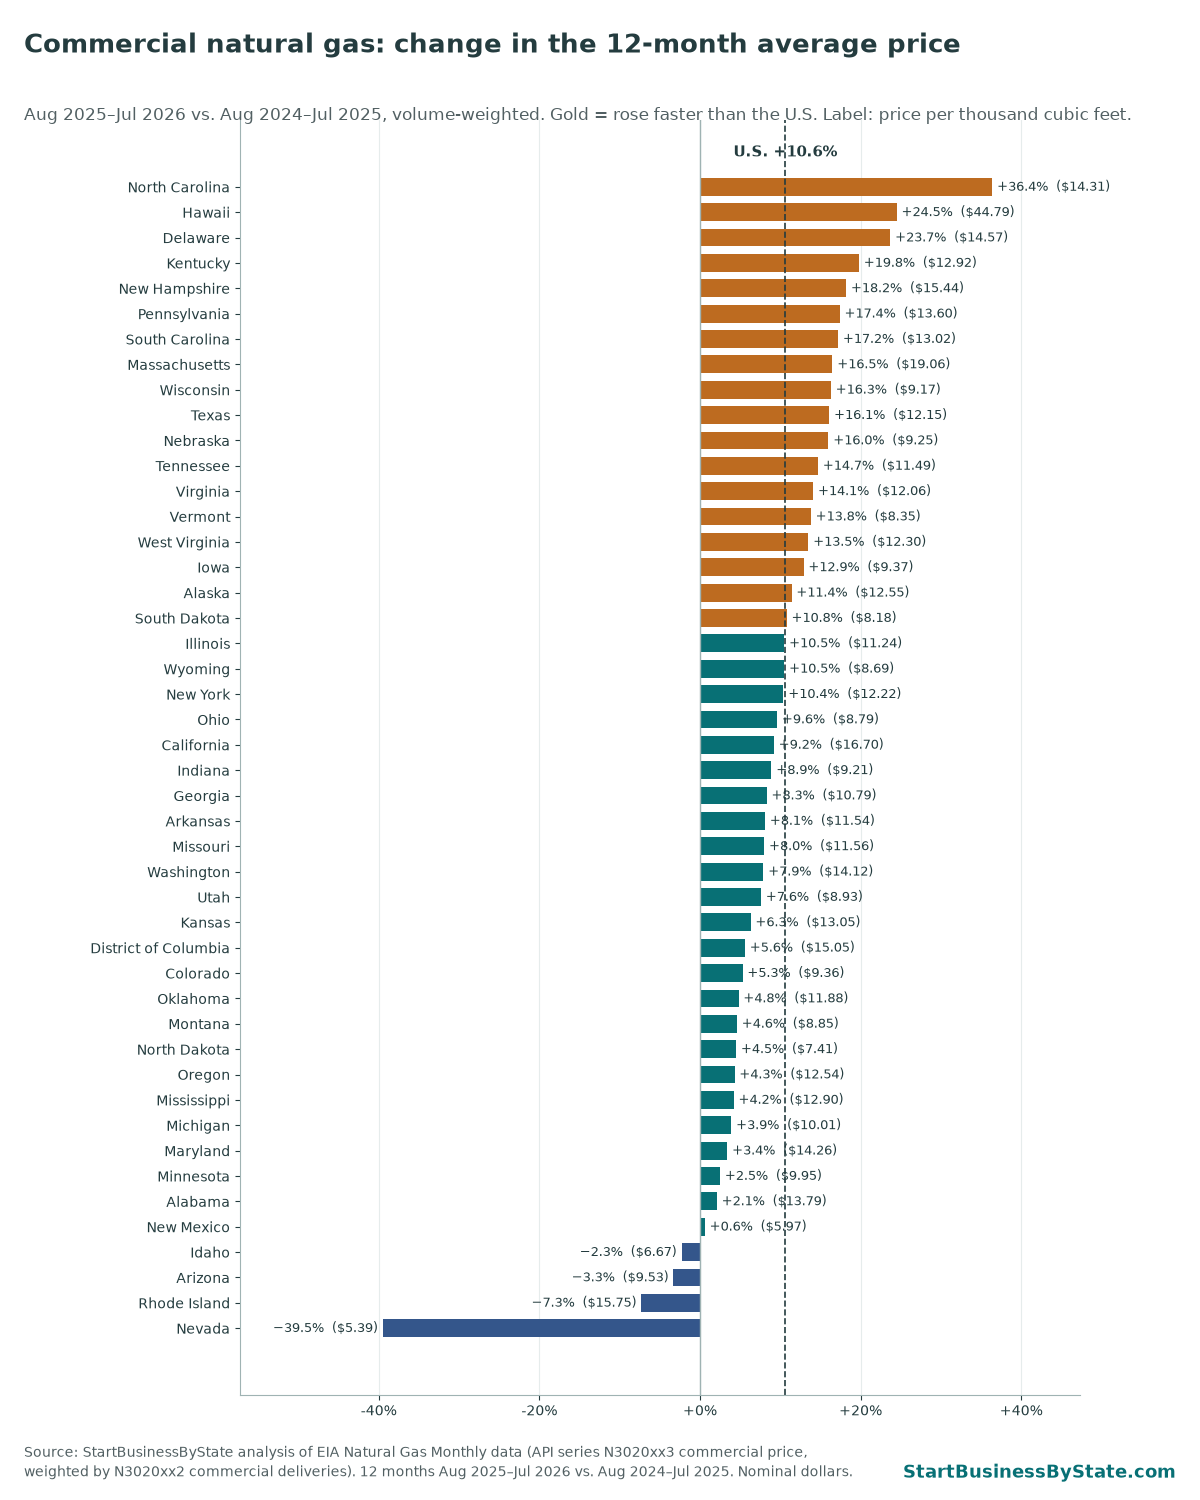
We compare 12-month averages instead of one month because businesses use most of their gas in winter. A July price covers only a small amount of gas, so a summer jump can look scary on paper and barely move a yearly bill. Weighting each month by how much gas businesses actually used keeps the comparison honest.
Big percentage changes often come from utility rate cases and fuel-cost adjustments, which state regulators approve on their own schedules. That’s why neighbors can move in opposite directions. North Carolina’s commercial price stepped up 34.5% in March 2025 and has stayed near the higher level, which is what drives its 12-month increase. Its July 2026 price was up only 7.5% from July 2025, because the step up came more than a year ago. In Nevada, prices were lower than a year earlier in 12 of 12 months.
Commercial natural gas prices for every state
Click a column header to sort. The 12-month prices are volume-weighted averages of EIA’s monthly commercial prices. The restaurant bill column is our estimate, explained below.
| Rank | State | 12-mo avg price, Aug 2025–Jul 2026 ($/Mcf) | Prior 12 months | Change | Jul 2026 price | Restaurant gas bill, change per year Modeled | Restaurants (2026 Q1) | Laundries & dry cleaners (2026 Q1) | Share of commercial gas in EIA price |
|---|---|---|---|---|---|---|---|---|---|
| United States | $11.77 | $10.64 | +10.6% | $13.03 | +$814 | 632,336 | 10,091 | ||
| 1 | North Carolina | $14.31 | $10.49 | +36.4% | $15.46 | +$2,743 | 20,893 | 220 | 100.0% |
| 2 | Hawaii | $44.79 | $35.97 | +24.5% | $50.11 | +$6,338 | 4,050 | 30 | 100.0% |
| 3 | Delaware | $14.57 | $11.78 | +23.7% | $19.32 | +$2,007 | 2,115 | 27 | 100.0% |
| 4 | Kentucky | $12.92 | $10.79 | +19.8% | $19.39 | +$1,533 | 8,122 | 105 | 98.9% |
| 5 | New Hampshire | $15.44 | $13.06 | +18.2% | withheld | +$1,707 | 3,038 | 47 | n/a |
| 6 | Pennsylvania | $13.60 | $11.59 | +17.4% | $18.15 | +$1,447 | 22,482 | 270 | 88.1% |
| 7 | South Carolina | $13.02 | $11.12 | +17.2% | $13.97 | +$1,372 | 10,275 | 100 | 100.0% |
| 8 | Massachusetts | $19.06 | $16.36 | +16.5% | $16.63 | +$1,939 | 13,871 | 245 | 98.5% |
| 9 | Wisconsin | $9.17 | $7.88 | +16.3% | $9.60 | +$926 | 9,973 | 116 | 100.0% |
| 10 | Texas | $12.15 | $10.46 | +16.1% | $12.60 | +$1,210 | 53,362 | 799 | 98.3% |
| 11 | Nebraska | $9.25 | $7.97 | +16.0% | $10.32 | +$915 | 3,567 | 42 | 90.7% |
| 12 | Tennessee | $11.49 | $10.01 | +14.7% | $11.13 | +$1,060 | 13,521 | 109 | 100.0% |
| 13 | Virginia | $12.06 | $10.56 | +14.1% | $13.30 | +$1,074 | 16,461 | 229 | 86.8% |
| 14 | Vermont | $8.35 | $7.33 | +13.8% | $6.14 | +$730 | 1,148 | withheld | 100.0% |
| 15 | West Virginia | $12.30 | $10.83 | +13.5% | $15.93 | +$1,055 | 3,037 | 22 | 100.0% |
| 16 | Iowa | $9.37 | $8.30 | +12.9% | $11.81 | +$771 | 5,325 | 64 | 100.0% |
| 17 | Alaska | $12.55 | $11.27 | +11.4% | $14.30 | +$924 | 1,252 | withheld | 100.0% |
| 18 | South Dakota | $8.18 | $7.38 | +10.8% | $8.84 | +$574 | 1,568 | withheld | 100.0% |
| 19 | Illinois | $11.24 | $10.17 | +10.5% | $18.94 | +$765 | 22,190 | 363 | 90.3% |
| 20 | Wyoming | $8.69 | $7.86 | +10.5% | $10.09 | +$596 | 1,117 | withheld | 69.3% |
| 21 | New York | $12.22 | $11.07 | +10.4% | $11.21 | +$830 | 42,343 | 1,945 | 100.0% |
| 22 | Ohio | $8.79 | $8.02 | +9.6% | withheld | +$554 | 21,146 | 253 | n/a |
| 23 | California | $16.70 | $15.29 | +9.2% | $15.20 | +$1,013 | 81,044 | 1,248 | 95.4% |
| 24 | Indiana | $9.21 | $8.46 | +8.9% | $11.70 | +$540 | 11,854 | 180 | 96.8% |
| 25 | Georgia | $10.79 | $9.96 | +8.3% | $10.78 | +$598 | 21,987 | 240 | 100.0% |
| 26 | Arkansas | $11.54 | $10.67 | +8.1% | $10.15 | +$623 | 5,542 | 57 | 100.0% |
| 27 | Missouri | $11.56 | $10.71 | +8.0% | $15.28 | +$612 | 11,098 | 159 | 100.0% |
| 28 | Washington | $14.12 | $13.08 | +7.9% | $17.92 | +$746 | 14,877 | 99 | 100.0% |
| 29 | Utah | $8.93 | $8.30 | +7.6% | $8.57 | +$454 | 5,868 | 41 | 100.0% |
| 30 | Kansas | $13.05 | $12.28 | +6.3% | $17.19 | +$556 | 4,964 | 64 | n/a |
| 31 | District of Columbia | $15.05 | $14.26 | +5.6% | $18.31 | +$572 | 2,261 | withheld | 70.5% |
| 32 | Colorado | $9.36 | $8.88 | +5.3% | $11.33 | +$342 | 11,396 | 145 | 100.0% |
| 33 | Oklahoma | $11.88 | $11.33 | +4.8% | $20.36 | +$395 | 6,909 | 106 | 100.0% |
| 34 | Montana | $8.85 | $8.46 | +4.6% | $13.30 | +$279 | 2,212 | 29 | 99.8% |
| 35 | North Dakota | $7.41 | $7.09 | +4.5% | $7.15 | +$228 | 1,356 | 16 | 100.0% |
| 36 | Oregon | $12.54 | $12.03 | +4.3% | $13.79 | +$370 | 9,376 | 61 | 100.0% |
| 37 | Mississippi | $12.90 | $12.38 | +4.2% | $13.53 | +$371 | 5,690 | 54 | 100.0% |
| 38 | Michigan | $10.01 | $9.63 | +3.9% | $13.37 | +$273 | 16,161 | 258 | 96.9% |
| 39 | Maryland | $14.26 | $13.79 | +3.4% | withheld | +$334 | 10,388 | 188 | 91.4% |
| 40 | Minnesota | $9.95 | $9.71 | +2.5% | $11.23 | +$176 | 9,215 | 102 | 100.0% |
| 41 | Alabama | $13.79 | $13.50 | +2.1% | $14.25 | +$206 | 9,618 | 88 | 100.0% |
| 42 | New Mexico | $5.97 | $5.94 | +0.6% | $3.95 | +$25 | 3,240 | 48 | n/a |
| 43 | Idaho | $6.67 | $6.82 | −2.3% | $7.98 | −$111 | 3,652 | 35 | 100.0% |
| 44 | Arizona | $9.53 | $9.85 | −3.3% | $8.91 | −$231 | 10,790 | 110 | 100.0% |
| 45 | Rhode Island | $15.75 | $17.00 | −7.3% | $12.50 | −$897 | 2,596 | 85 | 100.0% |
| 46 | Nevada | $5.39 | $8.92 | −39.5% | $5.75 | −$2,534 | 6,418 | 51 | 100.0% |
| – | Connecticut * | $11.67 | $10.23 | +14.1% | withheld | +$1,039 | 8,004 | 147 | n/a |
| – | Florida * | n/a | n/a | n/a | withheld | n/a | 43,592 | 689 | n/a |
| – | Louisiana * | n/a | n/a | n/a | withheld | n/a | 10,039 | 84 | n/a |
| – | Maine * | $16.11 | $14.57 | +10.6% | $20.81 | +$1,107 | 3,050 | 59 | 100.0% |
| – | New Jersey * | $15.28 | $13.56 | +12.7% | $15.47 | +$1,235 | 18,283 | 573 | 98.1% |
Rank = 12-month price change, highest first. States marked * are shown but not ranked because EIA withheld 3 to 6 months of their 2025–2026 data: Connecticut, Maine and New Jersey. EIA withheld too many recent months to compare Florida and Louisiana. “Withheld” = EIA or BLS did not publish the number. Restaurants = NAICS 7225 private establishments; laundries & dry cleaners = NAICS 812310 coin-operated laundries and drycleaners with employees. Last column: the share of commercial gas deliveries that EIA’s price covers in July 2026. Where it is well below 100%, many businesses buy gas from marketers and the price mainly reflects utility sales.
Download the data (CSV)How much of a business gas bill is the gas itself
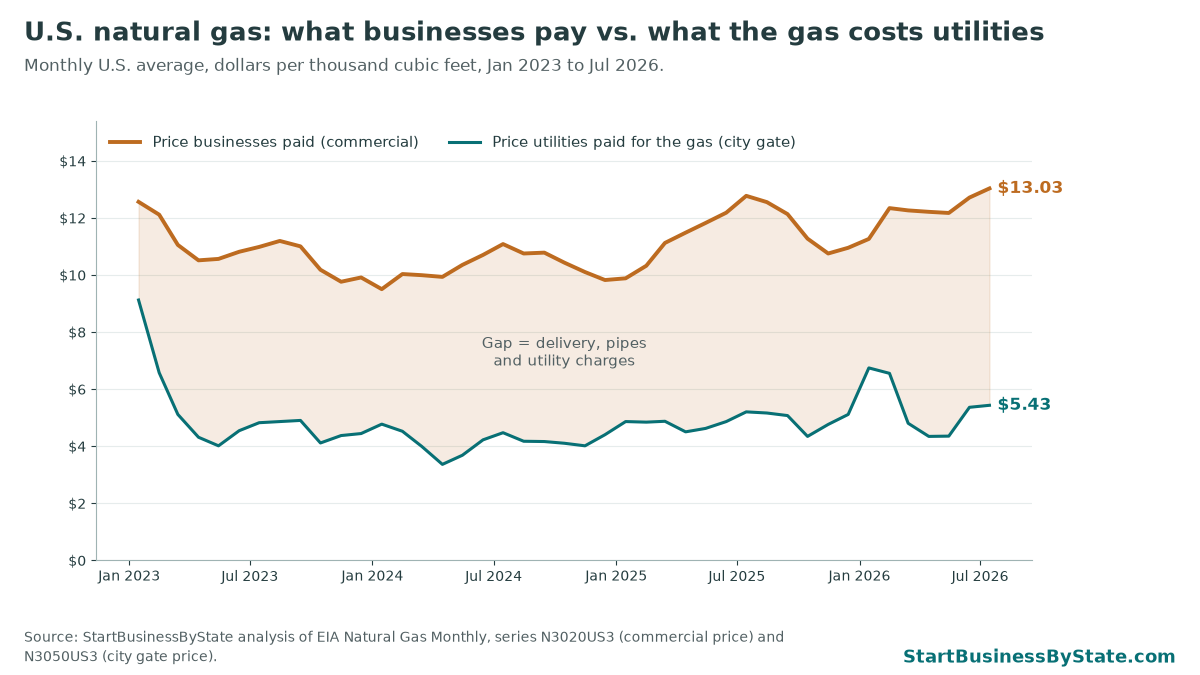
The city gate price is what local gas utilities pay when gas arrives from interstate pipelines. Everything above it on a business bill pays for local pipes, delivery and the utility’s other costs. Over the last 12 months the U.S. city gate price averaged $5.40 per Mcf, +17.8% from the year before, while the business price rose +10.6%. Delivery and utility charges still make up 54.1% of the average business price, or $6.37 per Mcf.
The wholesale Henry Hub spot price averaged $3.60 per million Btu over the same 12 months, against $3.07 a year earlier. Most of that gap came from January 2026, when the spot price averaged $7.72. Natural gas has risen far less than diesel, which hit a record $6.53 a gallon in EIA’s weekly U.S. series the week of September 21, 2026 (see our diesel and gas price tracker). The U.S. produces most of its own gas, and over the past year the biggest wholesale move was a short winter spike, not a steady climb.
EIA’s Short-Term Energy Outlook released October 6, 2026 projects the U.S. commercial price will average about $9.80 per thousand cubic feet for Nov 2026–Mar 2027, lower than the $11.51 average for Nov 2025–Mar 2026. That is a national forecast. EIA does not forecast state commercial prices, and your utility’s rate decisions can move your bill either way.
What this adds to a restaurant’s or laundromat’s gas bill
At the U.S. price, a typical gas-using restaurant would pay about $8,461 for a year of gas, $814 more than at the prior year’s price. A typical service building would pay about $414 more. In North Carolina, the restaurant increase is about $2,743 a year. Hawaii has the largest dollar increase, about $6,338, because its price per Mcf is far above every other state’s.
These are averages across very different buildings. A busy restaurant with a big fryer line, a char-grill and gas water heaters can use several times the average. A laundromat with gas dryers and water heaters sits on the heavy end of the service group. Use your own bills: find the Mcf (or therms) used over the last 12 months and multiply by the price change for your state. One Mcf is roughly 10.4 therms, so divide a per-Mcf price by about 10.4 to compare with a bill priced in therms.
How this hits your business
If you’re opening a restaurant, food truck commissary, laundromat, salon or daycare, gas will be one of the bills you can’t skip. Here’s how to plan for it.
- Ask for 12 months of bills before you sign a lease. The landlord or the last tenant can usually share them, or the utility can give a usage history for the address. Winter months tell you the most.
- Budget for winter, not the average. Most gas use falls between November and March. A month that costs $300 in July can cost three or four times that in January if the space is heated with gas.
- Look at the whole bill. Commercial bills have a fixed monthly customer charge plus delivery charges, and those make up about half the average business price (54.1% nationally). They change through rate cases your utility files with the state. Your utility’s tariff page lists them.
- See if you can choose your supplier. In states where a large share of business gas is sold by marketers, you may be able to lock a fixed supply price. Read the term, the exit fee and what happens when the contract ends.
- Price your menu or services for this year’s costs. If gas went up 10.6% and your other costs rose too, last year’s prices may no longer cover them. Food truck owners can test prices with our food truck event profit calculator, and salon owners with the salon break-even calculator.
Electricity is the other half of the energy bill. See commercial electricity costs for service businesses and where business electricity costs rose the most. If your business drives to customers, see fuel costs for mobile service businesses.
How we did this
- Prices. EIA Natural Gas Monthly via the EIA Open Data API v2, route natural-gas/pri/sum: price of natural gas delivered to commercial consumers (process PCS, series N3020xx3 where xx is the state), city gate price (PG1, series N3050xx3) and the percent of commercial deliveries included in the price (VRX). Monthly, August 2024 through July 2026. Pulled October 7, 2026.
- Weights. EIA commercial deliveries (route natural-gas/cons/sum, process VCS, series N3020xx2, million cubic feet), multiplied by the VRX share so each month’s weight matches the gas the price covers. Winter months carry most of the weight.
- 12-month comparison. Each month from August 2025 to July 2026 is paired with the same month a year earlier. A month counts only if EIA published the price in both years. Each pair is weighted by the average of the two months’ covered deliveries, and both 12-month averages use the same months and weights, so the change reflects price only. States are ranked when at least 10 of 12 month pairs are available; states with 6 to 9 are shown but not ranked.
- Henry Hub. EIA route natural-gas/pri/fut, series RNGWHHD, simple average of monthly spot prices, dollars per million Btu.
- Forecast. EIA Short-Term Energy Outlook released October 6, 2026, series NGCCUUS (U.S. commercial price), simple average of the monthly forecasts for Nov 2026–Mar 2027. Last winter’s figure is the simple average of the actual monthly U.S. prices for Nov 2025–Mar 2026.
- Businesses. BLS Quarterly Census of Employment and Wages, 2026 Q1, private ownership, NAICS 7225 (restaurants and other eating places) and 812310 (coin-operated laundries and drycleaners). Establishments are locations with employees, not firms.
- Gas use per building. EIA CBECS 2018, Table C24, natural gas consumption per building: food service 719 Mcf, service 366 Mcf.
Caveats
- EIA’s commercial price is an average of revenue per Mcf. It includes delivery and fixed charges spread over the gas sold, so it is not a utility tariff or a quote.
- In some states a large share of businesses buy gas from marketers, and EIA’s price covers only the rest. Check the last column of the table.
- Recent months are preliminary and EIA revises them.
- Prices are not adjusted for inflation.
EIA and BLS data are public domain. This page has no ads or affiliate links. Cite as: StartBusinessByState, “Commercial Natural Gas Prices by State,” updated October 7, 2026, https://startbusinessbystate.com/commercial-natural-gas-prices-by-state/
Related research
- Diesel and gas prices by state: this week’s EIA fuel prices and what a year of fuel costs one work truck.
- Commercial electricity costs for service businesses: EIA commercial power prices by state, with a usage calculator.
- Where business electricity costs rose the most.
- Dining-out dollars per food-service shop, by state: how much restaurant spending each state’s shops share.
- How the Fed’s rate hike hits small-business loans.
- The gas-price drain on Main Street, by state: how much more households spend on gas in each state.
- Food truck costs 2026: fuel, food and menu price changes for mobile food businesses.
FAQ
How much do businesses pay for natural gas?
The U.S. average commercial price was $11.77 per thousand cubic feet (Mcf) over the 12 months through July 2026, according to EIA data, and $13.03 in July 2026. State 12-month averages ran from $5.39 in Nevada to $44.79 in Hawaii.
Which state has the highest commercial natural gas price?
Hawaii, at an average of $44.79 per Mcf over the last 12 months. Among the other states, Massachusetts ($19.06) and California ($16.70) were highest.
Where did business natural gas prices rise the most?
North Carolina, where the 12-month average rose 36.4%, then Hawaii (+24.5%) and Delaware (+23.7%). The U.S. average rose 10.6%.
How much natural gas does a restaurant use?
The average U.S. food-service building that uses natural gas burned about 719 thousand cubic feet a year, according to EIA’s 2018 Commercial Buildings Energy Consumption Survey, the latest available. At the last 12 months’ U.S. price, that much gas costs about $8,461 a year. Your own use depends on your size, menu, equipment and climate.
Why is my gas bill so much higher than the wholesale price on the news?
News reports usually quote the Henry Hub wholesale price, which averaged $3.60 per million Btu over the last 12 months. A business bill also pays for interstate pipelines, local delivery and the utility’s fixed costs. Over the same period, U.S. businesses paid $11.77 per Mcf on average, and $6.37 of that was above the city gate price utilities paid for the gas.
How often is this page updated?
Monthly, after EIA publishes its Natural Gas Monthly near the end of each month. State prices run about two months behind. This version uses data through July 2026.
Last updated October 7, 2026. State prices through July 2026; the next EIA Natural Gas Monthly comes out near the end of next month.