Original research · EIA fuel prices + BLS price indexes and business counts · Last updated October 6, 2026
Data through: EIA diesel and gas, week of September 28, 2026. CPI and PPI: August 2026. Propane spot: August 2026. Business counts: BLS QCEW 2026 Q1. Refreshed monthly.
Running a food truck costs more in 2026 mainly because of fuel. Pump diesel is up 70.0% and regular gas 43.2% from a year ago. Wholesale food prices are close to flat (+0.1% for processed foods and feeds), and menu prices are up 3.4%. Propane, which many trucks cook with, has barely moved. Meanwhile the number of mobile food businesses with employees grew 8.4% to 13,075 in 2026 Q1, faster than restaurants (+1.8%).
Key findings
- Diesel is the biggest cost jump. The U.S. average retail diesel price was $6.38 a gallon the week of September 28, 2026, against $3.75 the same week of 2025 (+70.0%). It hit a record $6.53 the week of September 21, 2026, above the old high of $5.81 set the week of June 20, 2022. Wholesale diesel (BLS PPI) was up 77.8% in August 2026.
- Menu prices have not kept up with fuel. The consumer price index for food away from home rose 3.4% over the year to August 2026. Limited-service meals, the category closest to food-truck food, rose 3.2%.
- Food ingredient costs are mostly steady. Wholesale processed foods and feeds were +0.1% from a year earlier. Beef and veal were +3.1%, cooking oil +6.0% and paper packaging +4.4%. Poultry was −12.5%. At the grocery store, ground beef cost 7.2% more.
- Propane has stayed cheap. The Mont Belvieu, Texas, propane spot price averaged $0.69 a gallon in August 2026, +2.7% from a year earlier, even as diesel climbed. Trucks that cook and power their generators on propane are less exposed on the kitchen side, though driving still costs more with gas up 43.2%.
- Freight costs are up 13.9%. That is the BLS producer price index for long-distance truckload freight in August 2026. Food distributors pay those rates to move supplies, so they are worth watching in the next round of supplier price lists.
- More food trucks are opening anyway. BLS counted 13,075 mobile food businesses with employees in 2026 Q1, 1,009 more than a year earlier (+8.4%). Restaurants grew 1.8%. Florida (1,545), California (1,373) and Texas (1,115) have the most, 30.8% of the U.S. total.
What a food truck pays vs. what it charges
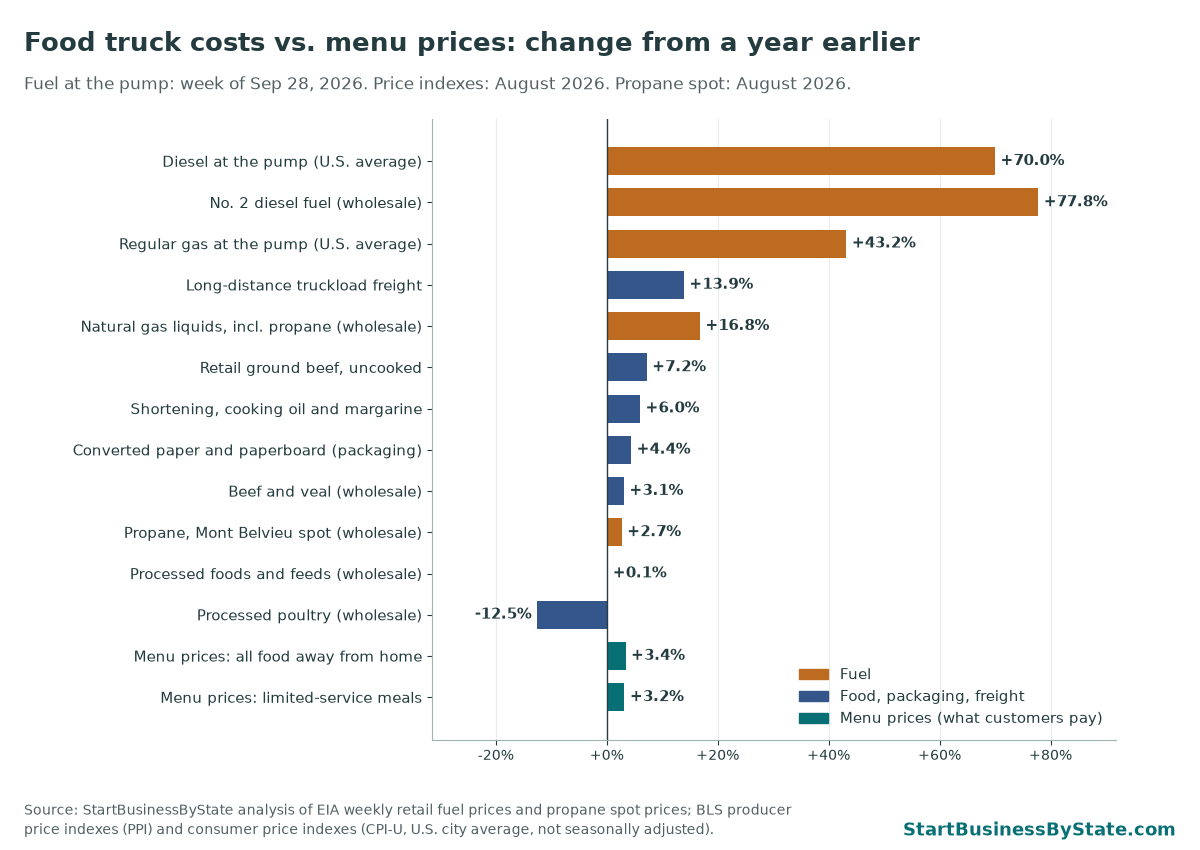
A food truck buys two kinds of things: what goes into the food, and what keeps the truck running. This year those moved very differently. Most food and packaging costs rose about as fast as menu prices or slower. Fuel did not. Diesel trucks and diesel generators took the biggest hit, while trucks that cook on propane saw almost no change in that bill.
| Cost item | Change from a year earlier | Latest vs. year earlier | Source and series | Period |
|---|---|---|---|---|
| Diesel at the pump (U.S. average) | +70.0% | $6.38 vs. $3.75 | EIA weekly retail No. 2 diesel, EMD_EPD2D_PTE_NUS_DPG | week of 2026-09-28 vs 2025-09-29 |
| Regular gas at the pump (U.S. average) | +43.2% | $4.46 vs. $3.12 | EIA weekly retail regular gasoline, EMM_EPMR_PTE_NUS_DPG | week of 2026-09-28 vs year earlier |
| Propane, Mont Belvieu spot (wholesale) | +2.7% | $0.69 vs. $0.67 | EIA spot price, EER_EPLLPA_PF4_Y44MB_DPG | 2026-08 vs 2025-08 |
| No. 2 diesel fuel (wholesale) | +77.8% | 546.0 vs. 307.2 | BLS PPI, WPU057303 | 2026-08 vs 2025-08 (preliminary) |
| Gasoline (wholesale) | +46.5% | 319.6 vs. 218.1 | BLS PPI, WPU0571 | 2026-08 vs 2025-08 (preliminary) |
| Natural gas liquids, incl. propane (wholesale) | +16.8% | 152.4 vs. 130.5 | BLS PPI, WPU0532 | 2026-08 vs 2025-08 (preliminary) |
| Long-distance truckload freight | +13.9% | 207.6 vs. 182.3 | BLS PPI, PCU484121484121 | 2026-08 vs 2025-08 (preliminary) |
| Shortening, cooking oil and margarine | +6.0% | 380.4 vs. 358.9 | BLS PPI, WPU0278 | 2026-08 vs 2025-08 (preliminary) |
| Converted paper and paperboard (packaging) | +4.4% | 330.9 vs. 317.1 | BLS PPI, WPU0915 | 2026-08 vs 2025-08 (preliminary) |
| Beef and veal (wholesale) | +3.1% | 366.0 vs. 355.0 | BLS PPI, WPU022101 | 2026-08 vs 2025-08 (preliminary) |
| Meats (wholesale) | −2.6% | 275.9 vs. 283.3 | BLS PPI, WPU0221 | 2026-08 vs 2025-08 (preliminary) |
| Processed foods and feeds (wholesale) | +0.1% | 277.5 vs. 277.1 | BLS PPI, WPU02 | 2026-08 vs 2025-08 (preliminary) |
| Processed poultry (wholesale) | −12.5% | 169.8 vs. 194.2 | BLS PPI, WPU0222 | 2026-08 vs 2025-08 (preliminary) |
| Menu prices: all food away from home | +3.4% | 397.9 vs. 384.9 | BLS CPI-U, CUUR0000SEFV | 2026-08 vs 2025-08 |
| Menu prices: limited-service meals | +3.2% | 259.7 vs. 251.7 | BLS CPI-U, CUUR0000SEFV02 | 2026-08 vs 2025-08 |
| Menu prices: full-service meals | +3.5% | 246.2 vs. 237.9 | BLS CPI-U, CUUR0000SEFV01 | 2026-08 vs 2025-08 |
| Grocery prices: food at home | +2.2% | 321.5 vs. 314.6 | BLS CPI-U, CUUR0000SAF11 | 2026-08 vs 2025-08 |
| Retail ground beef, uncooked | +7.2% | 447.9 vs. 417.7 | BLS CPI-U, CUUR0000SEFC01 | 2026-08 vs 2025-08 |
Fuel prices are dollars per gallon, including taxes for retail prices. Index values are BLS indexes (base period varies by series), not dollars. PPI values for the latest months are preliminary and can be revised. All CPI series are U.S. city average, all urban consumers, not seasonally adjusted.
Download the cost table (CSV)Check your own numbers
Type what you spent last month on each item. The calculator applies each item’s price change from the table above and shows how much more the same purchases cost now than a year ago. Your suppliers and region will differ, so treat it as a rough check.
| Item | Your monthly spend ($) | Price change used |
|---|---|---|
| +0.1% (PPI processed foods and feeds) | ||
| −2.6% (PPI meats) | ||
| +6.0% (PPI shortening and cooking oil) | ||
| +4.4% (PPI converted paper) | ||
| +70.0% (EIA retail diesel) | ||
| +43.2% (EIA retail regular gas) | ||
| +2.7% (EIA propane spot (wholesale)) |
Enter what you spent last month on each item.
Food trucks and diesel prices in every state
Click a column header to sort. Counts are private mobile food businesses with employees (food trucks, carts and similar). State names link to our guide to starting a food truck in that state.
| Rank | State | Mobile food businesses, 2026 Q1 | Change from a year earlier | Per 100,000 residents | Jobs (March) | Avg. weekly wage | EIA diesel region | Diesel, week of Sep 28, 2026 | Diesel change | Extra cost per 100 gal. Modeled |
|---|---|---|---|---|---|---|---|---|---|---|
| United States | 13,075 | +8.4% | 3.8 | 42,986 | $523 | U.S. average | $6.38 | +70.0% | $263 | |
| 1 | Florida | 1,545 | +22.6% | 6.6 | 3,895 | $553 | Lower Atlantic (PADD 1C) | $5.95 | +62.1% | $228 |
| 2 | California | 1,373 | +8.3% | 3.5 | 5,475 | $622 | California | $8.18 | +64.2% | $320 |
| 3 | Texas | 1,115 | +5.3% | 3.6 | 4,681 | $497 | Gulf Coast (PADD 3) | $5.96 | +74.5% | $254 |
| 4 | Washington | 496 | +4.6% | 6.2 | 1,539 | $497 | West Coast except California | $6.64 | +60.3% | $250 |
| 5 | Oregon | 478 | +6.7% | 11.2 | 1,593 | $518 | West Coast except California | $6.64 | +60.3% | $250 |
| 6 | New York | 451 | −2.4% | 2.3 | 1,285 | $1,183 | Central Atlantic (PADD 1B) | $6.53 | +67.4% | $263 |
| 7 | North Carolina | 410 | +21.7% | 3.7 | 1,142 | $406 | Lower Atlantic (PADD 1C) | $5.95 | +62.1% | $228 |
| 8 | Ohio | 397 | +3.9% | 3.3 | 1,540 | $442 | Midwest (PADD 2) | $6.53 | +74.9% | $280 |
| 9 | Colorado | 386 | +5.2% | 6.5 | 1,156 | $560 | Rocky Mountain (PADD 4) | $6.41 | +71.7% | $268 |
| 10 | Pennsylvania | 362 | +6.5% | 2.8 | 1,110 | $432 | Central Atlantic (PADD 1B) | $6.53 | +67.4% | $263 |
| 11 | Idaho | 315 | −8.2% | 15.7 | 780 | $399 | Rocky Mountain (PADD 4) | $6.41 | +71.7% | $268 |
| 12 | Michigan | 303 | +1.3% | 3.0 | 742 | $403 | Midwest (PADD 2) | $6.53 | +74.9% | $280 |
| 13 | Tennessee | 301 | +19.9% | 4.2 | 1,218 | $427 | Midwest (PADD 2) | $6.53 | +74.9% | $280 |
| 14 | Illinois | 282 | +20.5% | 2.2 | 769 | $493 | Midwest (PADD 2) | $6.53 | +74.9% | $280 |
| 15 | Arizona | 276 | −8.9% | 3.6 | 1,051 | $482 | West Coast except California | $6.64 | +60.3% | $250 |
| 16 | Hawaii | 273 | +11.9% | 18.9 | 1,048 | $609 | West Coast except California | $6.64 | +60.3% | $250 |
| 17 | Virginia | 272 | +10.6% | 3.1 | 1,212 | $471 | Lower Atlantic (PADD 1C) | $5.95 | +62.1% | $228 |
| 18 | Minnesota | 269 | +3.1% | 4.6 | 471 | $493 | Midwest (PADD 2) | $6.53 | +74.9% | $280 |
| 19 | Missouri | 225 | +7.1% | 3.6 | 869 | $495 | Midwest (PADD 2) | $6.53 | +74.9% | $280 |
| 20 | Utah | 211 | +2.9% | 6.0 | 788 | $501 | Rocky Mountain (PADD 4) | $6.41 | +71.7% | $268 |
| 21 | Indiana | 198 | +7.0% | 2.9 | 621 | $512 | Midwest (PADD 2) | $6.53 | +74.9% | $280 |
| 22 | Arkansas | 197 | +1.0% | 6.4 | 506 | $442 | Gulf Coast (PADD 3) | $5.96 | +74.5% | $254 |
| 23 | Alabama | 188 | +11.9% | 3.6 | 706 | $338 | Gulf Coast (PADD 3) | $5.96 | +74.5% | $254 |
| 24 | South Carolina | 186 | +10.1% | 3.4 | 638 | $425 | Lower Atlantic (PADD 1C) | $5.95 | +62.1% | $228 |
| 25 | Georgia | 182 | +9.0% | 1.6 | 680 | $430 | Lower Atlantic (PADD 1C) | $5.95 | +62.1% | $228 |
| 26 | Maryland | 177 | +3.5% | 2.8 | 565 | $546 | Central Atlantic (PADD 1B) | $6.53 | +67.4% | $263 |
| 27 | Wisconsin | 171 | +14.8% | 2.9 | 355 | $439 | Midwest (PADD 2) | $6.53 | +74.9% | $280 |
| 28 | Louisiana | 160 | +8.8% | 3.5 | 470 | $314 | Gulf Coast (PADD 3) | $5.96 | +74.5% | $254 |
| 29 | Kentucky | 148 | +5.7% | 3.2 | 636 | $577 | Midwest (PADD 2) | $6.53 | +74.9% | $280 |
| 30 | Massachusetts | 143 | +8.3% | 2.0 | 725 | $518 | New England (PADD 1A) | $6.51 | +64.3% | $255 |
| 31 | Nevada | 127 | +11.4% | 3.9 | 561 | $451 | West Coast except California | $6.64 | +60.3% | $250 |
| 32 | Connecticut | 121 | +3.4% | 3.3 | 316 | $515 | New England (PADD 1A) | $6.51 | +64.3% | $255 |
| 33 | Oklahoma | 119 | +6.2% | 2.9 | 324 | $489 | Midwest (PADD 2) | $6.53 | +74.9% | $280 |
| 34 | Alaska | 116 | n/a | 15.7 | 295 | $446 | West Coast except California | $6.64 | +60.3% | $250 |
| 35 | Montana | 112 | +5.7% | 9.8 | 250 | $449 | Rocky Mountain (PADD 4) | $6.41 | +71.7% | $268 |
| 36 | New Jersey | 112 | +20.4% | 1.2 | 450 | $620 | Central Atlantic (PADD 1B) | $6.53 | +67.4% | $263 |
| 37 | Maine | 96 | n/a | 6.8 | 162 | $608 | New England (PADD 1A) | $6.51 | +64.3% | $255 |
| 38 | Kansas | 95 | +20.3% | 3.2 | 268 | $479 | Midwest (PADD 2) | $6.53 | +74.9% | $280 |
| 39 | Iowa | 93 | +9.4% | 2.9 | 309 | $273 | Midwest (PADD 2) | $6.53 | +74.9% | $280 |
| 40 | New Mexico | 90 | +16.9% | 4.2 | 320 | $408 | Gulf Coast (PADD 3) | $5.96 | +74.5% | $254 |
| 41 | Mississippi | 71 | +12.7% | 2.4 | 286 | $293 | Gulf Coast (PADD 3) | $5.96 | +74.5% | $254 |
| 42 | Wyoming | 66 | +20.0% | 11.2 | 162 | $414 | Rocky Mountain (PADD 4) | $6.41 | +71.7% | $268 |
| 43 | Nebraska | 63 | +1.6% | 3.1 | 156 | $358 | Midwest (PADD 2) | $6.53 | +74.9% | $280 |
| 44 | New Hampshire | 48 | n/a | 3.4 | 85 | $421 | New England (PADD 1A) | $6.51 | +64.3% | $255 |
| 45 | West Virginia | 42 | n/a | 2.4 | 88 | $351 | Lower Atlantic (PADD 1C) | $5.95 | +62.1% | $228 |
| 46 | Rhode Island | 41 | +2.5% | 3.7 | 104 | $426 | New England (PADD 1A) | $6.51 | +64.3% | $255 |
| 47 | Delaware | 41 | n/a | 3.9 | 49 | $456 | Central Atlantic (PADD 1B) | $6.53 | +67.4% | $263 |
| 48 | South Dakota | 37 | n/a | 4.0 | 192 | $428 | Midwest (PADD 2) | $6.53 | +74.9% | $280 |
| 49 | North Dakota | 37 | n/a | 4.6 | 75 | $354 | Midwest (PADD 2) | $6.53 | +74.9% | $280 |
| 50 | Vermont | 37 | −7.5% | 5.7 | 146 | $539 | New England (PADD 1A) | $6.51 | +64.3% | $255 |
| 51 | District of Columbia | 21 | n/a | 3.0 | 122 | $681 | Central Atlantic (PADD 1B) | $6.53 | +67.4% | $263 |
Rank = number of mobile food businesses, highest first. “Withheld” = BLS did not publish the number to protect confidentiality. Diesel prices are EIA weekly retail No. 2 diesel for the state’s EIA region (California has its own series). Extra cost per 100 gallons = 100 × (this week’s regional price − the price a year earlier).
Download the state data (CSV)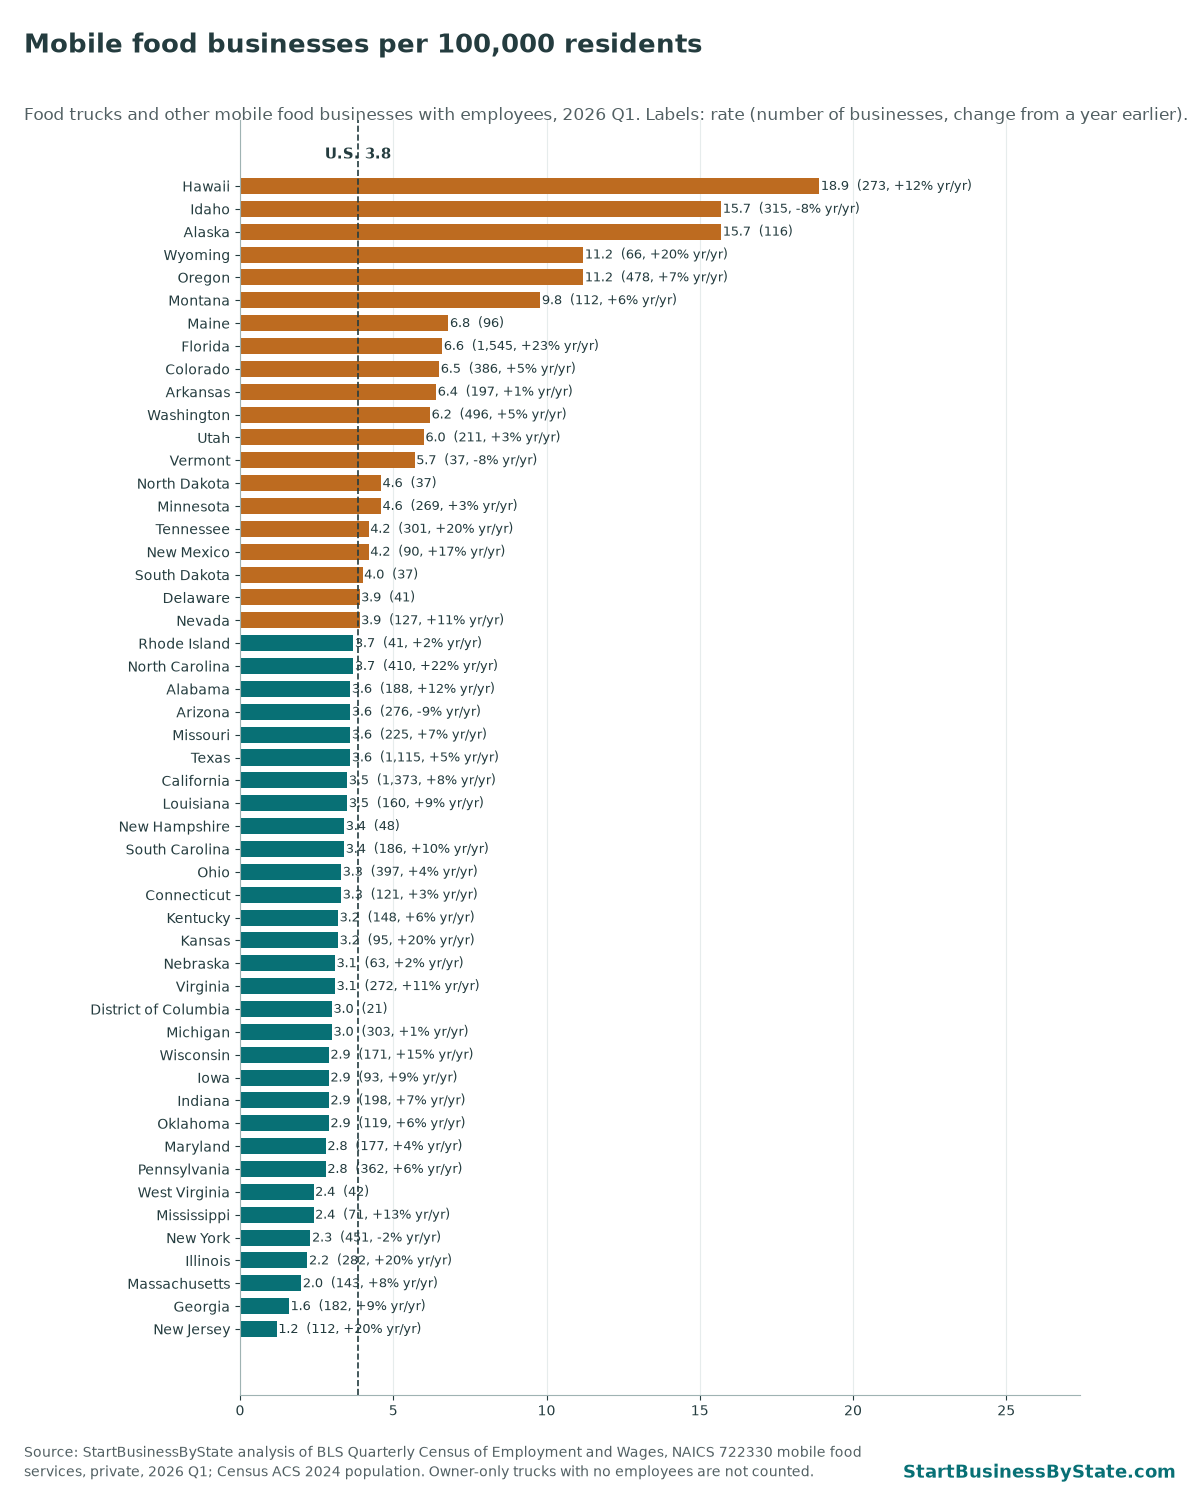
Hawaii has the most mobile food businesses for its size, 18.9 per 100,000 residents, followed by Idaho (15.7) and Alaska (15.7). Among states with at least 200 trucks, the count grew fastest in Florida (+22.6%), North Carolina (+21.7%) and Illinois (+20.5%). The count fell in New York, Idaho and Arizona.
Diesel rose most in the Midwest region (+74.9%, about $280 more per 100 gallons) and least in the West Coast outside California (+60.3%). For the full weekly series, see our diesel and gas price tracker.
These counts come from the BLS Quarterly Census of Employment and Wages and are newer than the Census Bureau counts on our food truck industry statistics page, so the two will not match exactly.
How this hits your business
If you’re starting a food truck, the price of diesel matters more this year than the price of beef. Here’s what to plan for.
- Budget fuel at today’s price. Look at your truck’s mileage and your generator’s fuel use, then price them at this week’s diesel or gas price, not last year’s. If your truck runs on diesel and so does your generator, you’re paying the higher price twice.
- Consider a propane setup. Propane has stayed close to last year’s price. If you’re buying or building a truck, a propane cooking line and a propane generator keep more of your fuel costs off the pump.
- Plan your stops. Fewer, longer stops at busy spots burn less fuel than chasing several small events in a day. Check the drive time before you say yes to an event, and use our food truck event profit calculator to see if it pays after fuel and fees.
- Add a travel fee to catering. For private events and catering, a mileage or travel charge is normal and easy to explain. Put it on the quote as its own line.
- Raise prices carefully. Menu prices nationally are up about 3.4%. Small, round increases on your best sellers are easier for regulars to accept than a jump across the whole menu.
- Know your state’s rules first. Permits, commissary rules and inspections vary by state and city. Start with our food truck guide, then your state’s page in the table above. If you’ll cross county or state lines, check inspection reciprocity by state, and review food truck insurance before your first event.
Many new trucks are opening even with high fuel prices: BLS counted 1,009 more mobile food businesses with employees than a year earlier. That means more competition for the best spots and events, so a clear plan for where you’ll park matters as much as your menu.
How we did this
- Retail fuel. EIA Open Data API v2, route petroleum/pri/gnd, weekly. No. 2 diesel (product EPD2D, series EMD_EPD2D_PTE_[area]_DPG) for the U.S., PADD subregions and California; regular gasoline (EMM_EPMR_PTE_NUS_DPG) for the U.S. The year-earlier price is the week closest to 52 weeks before (September 29, 2025).
- Propane. EIA spot prices, Mont Belvieu, Texas propane, series EER_EPLLPA_PF4_Y44MB_DPG, monthly average, August 2026 vs. a year earlier. This is a wholesale price. Retail tank and cylinder prices are higher because they include delivery and dealer costs.
- Input prices. BLS producer price indexes, not seasonally adjusted: WPU057303 (no. 2 diesel fuel), WPU0571 (gasoline), WPU0532 (natural gas liquids, incl. propane), PCU484121484121 (long-distance truckload freight), WPU0278 (shortening, cooking oil and margarine), WPU0915 (converted paper and paperboard), WPU022101 (beef and veal), WPU0221 (meats), WPU02 (processed foods and feeds), WPU0222 (processed poultry). August 2026 vs. a year earlier.
- Menu and grocery prices. BLS CPI-U, U.S. city average, not seasonally adjusted: CUUR0000SEFV (menu prices: all food away from home), CUUR0000SEFV02 (menu prices: limited-service meals), CUUR0000SEFV01 (menu prices: full-service meals), CUUR0000SAF11 (grocery prices: food at home), CUUR0000SEFC01 (retail ground beef, uncooked). August 2026 vs. a year earlier.
- Business counts. BLS Quarterly Census of Employment and Wages (QCEW), 2026 Q1, NAICS 722330 mobile food services and NAICS 7225 restaurants and other eating places, private ownership, state totals. Change is BLS’s over-the-year change from the same quarter a year earlier. Jobs are third-month employment.
- Population. Census Bureau American Community Survey 2024 1-year estimates, table B01003.
- “Extra cost per 100 gallons” = 100 × (latest weekly diesel price − the price 52 weeks earlier) for the state’s EIA region. 100 gallons is a round number for comparison, not an estimate of how much a typical truck uses.
- The calculator applies national price changes to the amounts you enter. Your own costs depend on your suppliers, menu and region.
Caveats
- QCEW counts only businesses with employees. Owner-operated trucks with no payroll are left out, and some businesses with several trucks report as one establishment.
- CPI and PPI are national. BLS does not publish them by state.
- Diesel prices are regional averages. Prices at your station can be higher or lower, and state fuel-tax holidays change them week to week.
- PPI figures for the latest four months are preliminary and are revised.
EIA, BLS and Census data are public domain. This page has no ads or affiliate links. Cite as: StartBusinessByState, “Food Truck Costs 2026: Fuel, Food and Menu Prices,” updated October 6, 2026, https://startbusinessbystate.com/food-truck-costs-2026/
Related research
- Diesel and gas prices by state: this week’s EIA prices for every region.
- Food truck industry statistics: Census Bureau counts and industry background.
- Best states to start a food truck.
- Food truck inspection reciprocity by state.
- Dining-out dollars per food-service shop, by state.
- Commercial natural gas prices by state: what restaurants pay for gas in each state.
- The gas-price drain on Main Street, by state: how pump prices eat into customers’ spending money.
- Diesel shock cost by state: the extra diesel bill in every state.
- food truck rules by city: permit fees, commissary rules and distance-from-restaurant limits.
- tariffs on restaurant food by item: tariff rates on imported food and takeout packaging.
FAQ
How much have food truck costs gone up in 2026?
Fuel is the big one. Retail diesel was up 70.0% and regular gas up 43.2% from a year earlier as of the week of September 28, 2026 (EIA). Wholesale processed foods and feeds changed +0.1% and paper packaging +4.4% in August 2026 (BLS PPI). The propane spot price changed +2.7%.
How much more does diesel cost a food truck now?
At the U.S. average, 100 gallons of diesel cost about $638 the week of September 28, 2026, against $375 a year earlier, or $263 more. Prices differ by region. The table shows the change for each state’s EIA price region.
Are food trucks raising their prices?
There is no official price index for food trucks alone. The closest is the BLS index for limited-service meals, which rose 3.2% over the year to August 2026. All food away from home rose 3.4%.
How many food trucks are there in the U.S.?
BLS counted 13,075 private mobile food businesses with employees in 2026 Q1 (NAICS 722330), up 8.4% from a year earlier. Trucks run only by their owners, with no payroll, are not in this count, so the true number of trucks is higher.
Which state has the most food trucks?
Florida has the most mobile food businesses with employees (1,545), then California (1,373) and Texas (1,115). Per resident, Hawaii leads with 18.9 per 100,000 people.
How often is this page updated?
Monthly, after BLS publishes the consumer and producer price indexes. The diesel figures update weekly from EIA, and the state business counts update each quarter when BLS releases new QCEW data.
Last updated October 6, 2026. Diesel through the week of September 28, 2026; price indexes through August 2026; business counts for 2026 Q1.