Census import data through August 2026 + BLS consumer prices through August 2026 · National data · Updated by StartBusinessByState
Short answer: By August 2026, tariff rates on imported tea, coffee, pepper and chili spices and bananas had fallen to about 1% or less, from 9% to 13% a year earlier. Rates on wine, rice, pasta, cheese, olive oil and seafood were about 7% to 12%. Aluminum foil (51%) and steel kitchenware (26%) were much higher. Menu prices kept rising: the BLS index for food away from home was up 3.4% from a year earlier, compared with 2.2% for groceries. Tariffs are one cost among many. Weather, harvests, labor, energy and exchange rates also move food prices, and this data can’t separate them.
Key facts for reporters
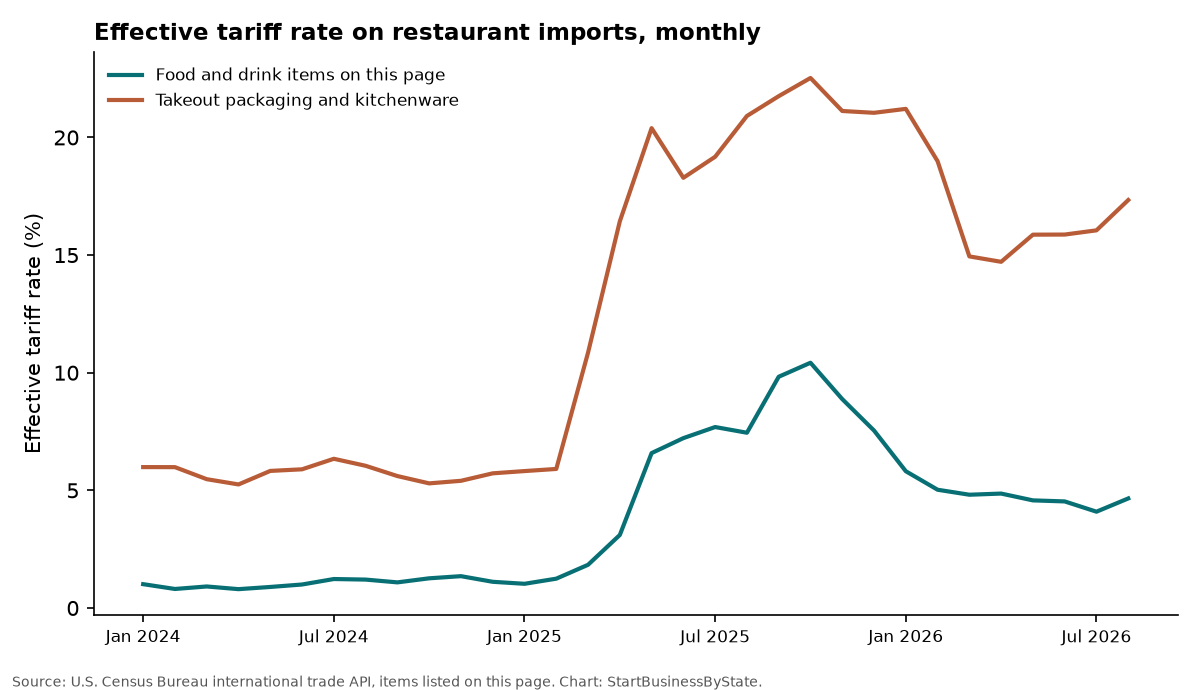
- Effective tariff rate (calculated duties ÷ imports for consumption) on the 23 food and drink items on this page: 4.7% in August 2026, 7.4% in August 2025, 1.2% in August 2024 (Census trade API).
- Same items, March–Aug 2026 (after the Supreme Court’s Feb. 20, 2026 ruling on IEEPA tariffs): 4.6%, compared with 5.6% in March–Aug 2025.
- Biggest drops in rate, Aug 2025 to Aug 2026: tea (12.7% to 1.1%), coffee (10.3% to 0.0%), pepper and chili spices (11.2% to 1.2%), bananas (9.2% to 0.0%), beef, frozen (15.2% to 7.0%).
- Highest rates in August 2026: aluminum foil (50.9%), cane and beet sugar (32.1%), steel pots, pans and kitchenware (26.0%), butter (20.2%), plastic containers and lids (12.0%).
- Imports of these food items, Jan–Aug 2026: $65.2B (-1.5% from a year earlier), with $3.11B in calculated duties.
- Consumer prices, August 2026 vs. a year earlier (BLS CPI): food away from home +3.4%, full-service meals +3.5%, limited-service meals +3.2%, beef +5.9%, coffee +6.1%, cheese -3.8%.
Tariff rate by restaurant item
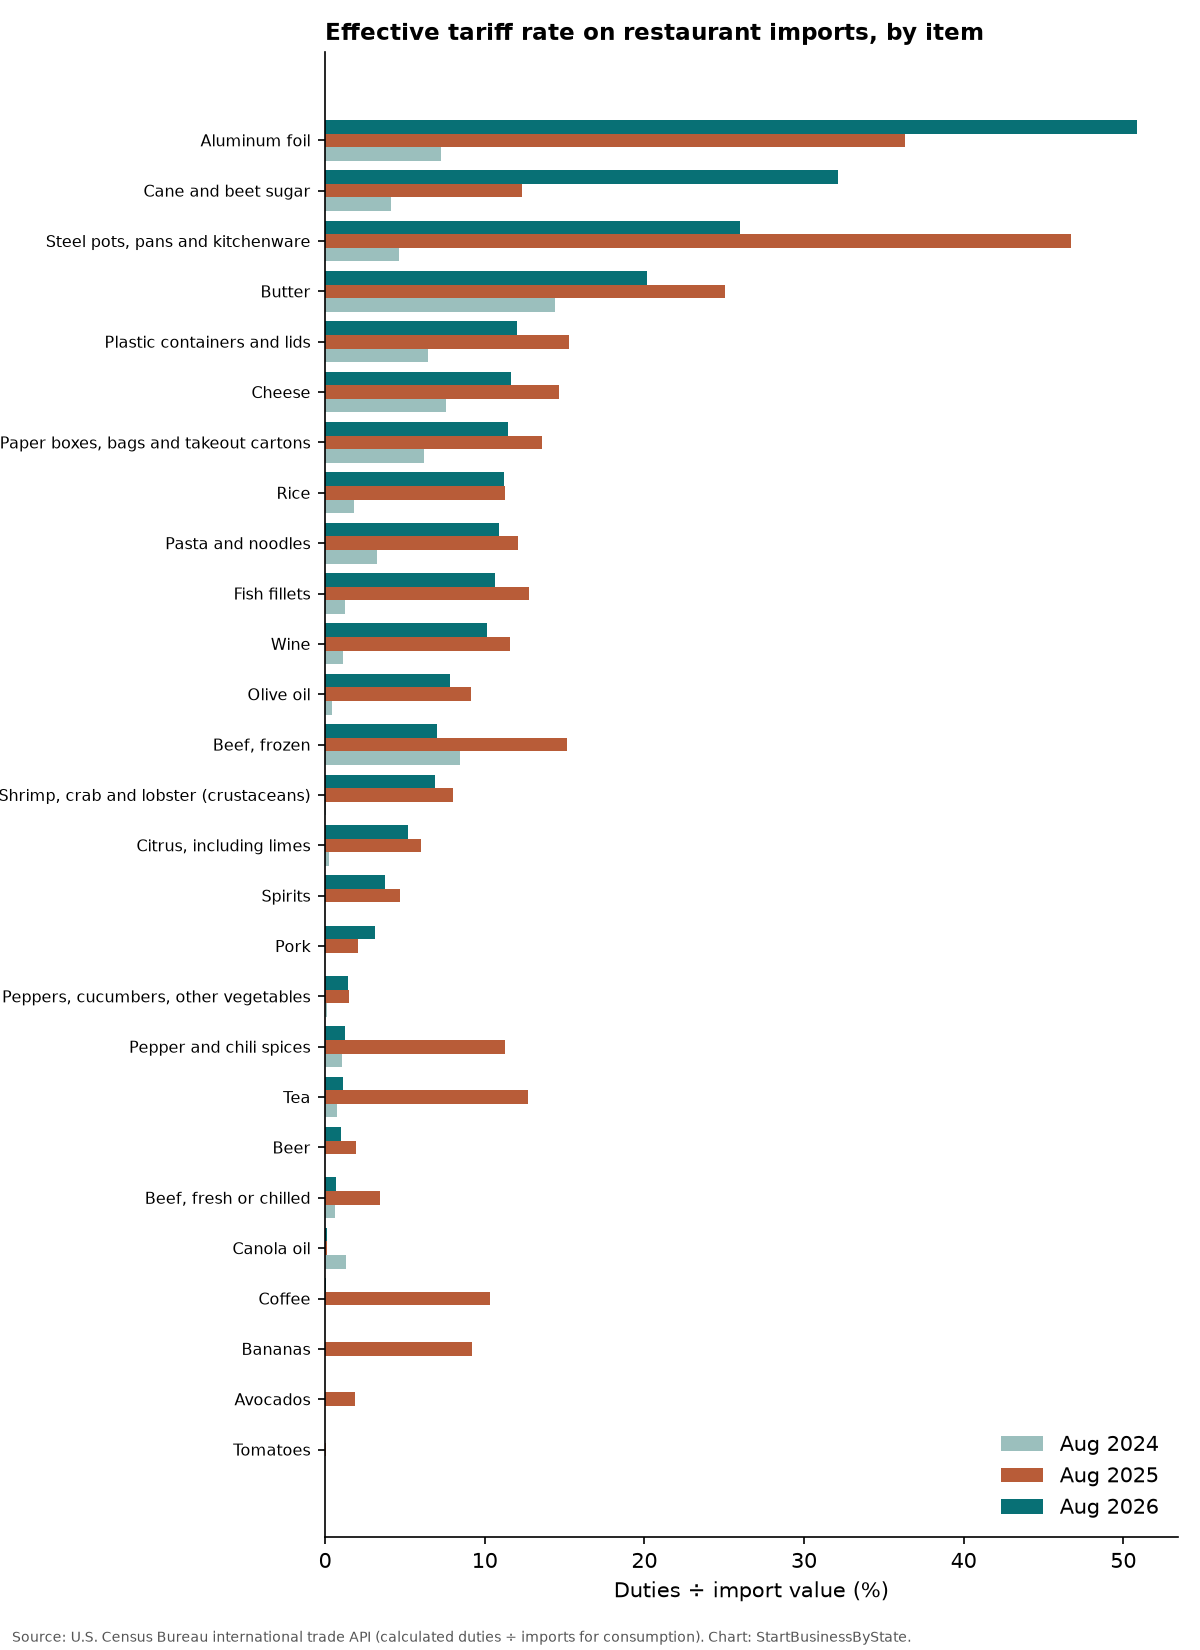
The “effective tariff rate” is the duty the Census Bureau calculates on an item divided by the value imported. It’s lower than the headline rate when some imports are exempt, come in under trade agreements, or come from countries with lower rates. Coffee is an example: its rate was 10.3% in August 2025 and 0.03% in August 2026. Aluminum foil was 36.3% a year ago and 50.9% in August 2026. For tools and equipment, see tariff rates on trade tools and equipment.
Monthly trend
Timeline of the main tariff actions
These are the official actions that line up with the changes in the data. We list them without judging them.
- June 4, 2025: Section 232 tariffs on steel and aluminum, including many products made from them, went from 25% to 50% (Proclamation 10947). Aluminum foil (HS chapter 76) is among the covered aluminum products.
- 2025: “Reciprocal” and other tariffs imposed under the International Emergency Economic Powers Act (IEEPA) applied to imports from most countries, including many foods. Goods that qualified under the U.S.-Mexico-Canada Agreement were generally exempt.
- November 2025: Executive Order 14360 exempted beef, many fruits, coffee, tea and spices from the reciprocal tariffs.
- Feb. 20, 2026: The Supreme Court ruled in Learning Resources v. Trump that IEEPA doesn’t authorize these tariffs (opinion; CRS summary). The Section 232 metal tariffs weren’t part of that case. For refunds, see tariff refunds by state.
- Feb. 24 – July 24, 2026: A temporary 10% import surcharge under Section 122 applied for 150 days, with exclusions that included many farm products.
- Aug. 22 and Sept. 2026: New U.S. tariffs on some Canadian goods and Canadian counter-tariffs took effect (CRS). Most of that falls after the August 2026 data on this page. See Canada trade war exposure by state.
Rates on some items in August 2026 stayed close to their March–July levels. This page reports the rates in the data and doesn’t assign each item’s rate to a specific tariff action. Census duty figures are estimated at the time of import, so they don’t reflect any refunds paid later.
Tariff rates by item
Effective tariff rate = calculated duties ÷ import value. Import value is for January–Aug 2026. Click a column to sort.
| Item | HS code | Imports, Jan–Aug 2026 | Change vs. year before | Aug 2024 | Aug 2025 | Aug 2026 | Mar–Aug 2025 | Mar–Aug 2026 | Top sources (share of imports) |
|---|---|---|---|---|---|---|---|---|---|
| Beef, fresh or chilled | 0201 | $5.35B | +27% | 0.6% | 3.5% | 0.7% | 3.0% | 1.0% | Canada 33%; Mexico 31%; Australia 24% |
| Beef, frozen | 0202 | $6.28B | +33% | 8.4% | 15.2% | 7.0% | 15.6% | 7.7% | Australia 30%; Brazil 21%; New Zealand 19% |
| Pork | 0203 | $994M | +4% | 0.0% | 2.1% | 3.2% | 1.5% | 2.6% | Canada 62%; Mexico 13%; Denmark 7% |
| Shrimp, crab and lobster (crustaceans) | 0306 | $5.75B | -0% | 0.0% | 8.0% | 6.9% | 3.7% | 5.7% | Canada 33%; Ecuador 24%; India 19% |
| Fish fillets | 0304 | $4.92B | -4% | 1.3% | 12.8% | 10.7% | 8.9% | 9.5% | Chile 33%; Norway 11%; China 11% |
| Cheese | 0406 | $1.21B | +9% | 7.6% | 14.7% | 11.6% | 12.3% | 15.9% | Italy 30%; France 15%; Spain 7% |
| Butter | 0405 | $492M | +48% | 14.4% | 25.0% | 20.2% | 18.1% | 26.7% | Ireland 58%; New Zealand 29%; France 6% |
| Tomatoes | 0702 | $2.11B | +3% | 0.0% | 0.1% | 0.0% | 0.3% | 0.0% | Mexico 77%; Canada 21%; Guatemala 1% |
| Peppers, cucumbers, other vegetables | 0709 | $2.79B | -1% | 0.1% | 1.5% | 1.4% | 1.2% | 0.9% | Mexico 72%; Canada 20%; Peru 5% |
| Avocados | 080440 | $2.14B | -23% | 0.0% | 1.9% | 0.0% | 1.6% | 0.0% | Mexico 92%; Peru 6%; Dominican Republic 2% |
| Bananas | 0803 | $2.18B | +13% | 0.0% | 9.2% | 0.0% | 6.9% | 0.0% | Guatemala 38%; Ecuador 23%; Colombia 11% |
| Citrus, including limes | 0805 | $1.31B | +0% | 0.2% | 6.0% | 5.2% | 4.5% | 3.2% | Mexico 50%; Chile 17%; Colombia 7% |
| Coffee | 0901 | $8.01B | -10% | 0.0% | 10.3% | 0.0% | 6.4% | 0.0% | Colombia 19%; Brazil 15%; Honduras 11% |
| Tea | 0902 | $439M | +14% | 0.7% | 12.7% | 1.1% | 8.7% | 1.1% | Japan 41%; India 8%; Argentina 8% |
| Olive oil | 1509 | $1.51B | -15% | 0.4% | 9.1% | 7.8% | 6.0% | 9.9% | Spain 32%; Italy 29%; Tunisia 26% |
| Canola oil | 1514 | $2.90B | +54% | 1.3% | 0.1% | 0.1% | 0.4% | 0.1% | Canada 99%; Australia 0%; Netherlands 0% |
| Rice | 1006 | $937M | -11% | 1.8% | 11.3% | 11.2% | 6.8% | 11.0% | Thailand 60%; India 22%; China 3% |
| Pasta and noodles | 1902 | $1.20B | -2% | 3.3% | 12.1% | 10.9% | 9.1% | 10.7% | Italy 38%; Korea, South 23%; Canada 11% |
| Pepper and chili spices | 0904 | $829M | +4% | 1.0% | 11.2% | 1.2% | 7.3% | 1.1% | Vietnam 46%; India 13%; Mexico 11% |
| Cane and beet sugar | 1701 | $985M | -28% | 4.1% | 12.3% | 32.1% | 11.7% | 19.3% | Mexico 21%; Dominican Republic 11%; Guatemala 11% |
| Beer | 2203 | $4.67B | -7% | 0.0% | 1.9% | 1.0% | 1.0% | 0.9% | Mexico 90%; Netherlands 4%; Ireland 2% |
| Wine | 2204 | $3.72B | -16% | 1.1% | 11.6% | 10.2% | 7.4% | 10.5% | France 40%; Italy 32%; New Zealand 8% |
| Spirits | 2208 | $4.44B | -29% | 0.0% | 4.7% | 3.7% | 3.0% | 4.1% | Mexico 48%; France 17%; United Kingdom 10% |
| Aluminum foil | 7607 | $922M | -8% | 7.2% | 36.3% | 50.9% | 27.1% | 51.1% | Korea, South 15%; Thailand 14%; Germany 11% |
| Paper boxes, bags and takeout cartons | 4819 | $2.17B | +2% | 6.2% | 13.6% | 11.4% | 11.1% | 9.1% | Canada 29%; Mexico 16%; China 13% |
| Plastic containers and lids | 3923 | $6.27B | -0% | 6.4% | 15.2% | 12.0% | 12.8% | 10.4% | Canada 25%; Mexico 19%; China 17% |
| Steel pots, pans and kitchenware | 7323 | $1.44B | -20% | 4.7% | 46.7% | 26.0% | 40.9% | 26.6% | China 64%; India 9%; Vietnam 8% |
Menu and grocery prices
The Consumer Price Index tracks what people pay. Restaurant prices (food away from home) rose 3.4% in the year to August 2026, after 3.9% the year before. Restaurant prices include labor, rent and other costs, not only ingredients. That’s partly why they tend to change more steadily than grocery prices.
| Consumer price index (U.S. city average) | Change, Aug 2025–Aug 2026 | Change, Aug 2024–Aug 2025 |
|---|---|---|
| Food away from home | +3.4% | +3.9% |
| Full service meals and snacks | +3.5% | +4.6% |
| Limited service meals and snacks | +3.2% | +3.2% |
| Food at home | +2.2% | +2.7% |
| Beef and veal | +5.9% | +13.9% |
| Uncooked ground beef | +7.2% | +12.8% |
| Pork | +0.6% | +1.2% |
| Fish and seafood | +6.5% | +2.3% |
| Cheese and cheese products | -3.8% | +2.7% |
| Coffee | +6.1% | +20.9% |
| Bananas | +5.4% | +9.6% |
| Fresh fruits | +3.8% | +1.7% |
| Fresh vegetables | +2.6% | +2.9% |
| Tomatoes | +2.0% | +4.0% |
| Fats and oils | -0.3% | -1.1% |
| Sugar and artificial sweeteners | -0.5% | +2.6% |
| Rice, pasta, cornmeal | +3.4% | -0.8% |
| Alcoholic beverages at home | +0.2% | +0.3% |
| Alcoholic beverages away from home | +3.0% | +3.8% |
| Average retail price | Aug 2024 | Aug 2025 | Aug 2026 | 1-year change |
|---|---|---|---|---|
| Ground beef, 100% beef, per lb | $5.58 | $6.32 | $6.92 | +9.6% |
| Coffee, 100% ground roast, per lb | $6.31 | $8.87 | $9.30 | +4.8% |
| Tomatoes, field grown, per lb | $2.00 | $1.93 | $1.98 | +2.7% |
| Bananas, per lb | $0.61 | $0.67 | $0.65 | -2.1% |
| Cheddar cheese, per lb | $5.76 | $6.12 | $5.98 | -2.3% |
Other things that move food prices
- Supply and weather: the size of the U.S. cattle herd affects beef, global harvests affect coffee and cocoa, and many fresh fruits and vegetables come mainly from imports in winter.
- Exchange rates: a stronger or weaker dollar changes what U.S. buyers pay before any tariff.
- Energy and freight: fuel and shipping costs affect almost every imported item.
- Labor and rent: these are a large share of restaurant costs, and they move menu prices even when ingredient costs don’t change.
For restaurant numbers by state, see the restaurant industry by state. For food trucks, see food truck costs in 2026.
Running a restaurant or food business?
Get a restaurant insurance quote from Simply Business. General liability, property and other policies for food businesses.
If supplier costs are squeezing your cash flow, see funding options from Cardiff. Compare total cost before you borrow.
We may earn a commission if you use this link. It doesn’t change what you pay, and it doesn’t affect the data on this page.
Methods and limits
- Trade data: U.S. Census Bureau international trade API, imports by HS code. CON_VAL_MO is imports for consumption, and CAL_DUT_MO is calculated duty. Effective rate = duty ÷ value, for single months (Aug 2024, Aug 2025, Aug 2026) and for March–Aug in 2025 and 2026. Aggregates are weighted by import value. Items are HS 4-digit headings, except avocados (HS 080440). An HS heading includes products restaurants don’t use, so these figures are broad estimates.
- Countries: top three sources by January–Aug 2026 import value, excluding regional groups.
- Prices: BLS CPI-U, U.S. city average, not seasonally adjusted, and BLS average price series. BLS didn’t publish an October 2025 CPI.
- Not attributed: the data shows duties paid, not which law imposed them. We don’t estimate how much of any price change came from tariffs.
Sources
- U.S. Census Bureau, international trade data (Census API, imports by HS code)
- BLS Consumer Price Index and average prices (BLS API)
- Congressional Research Service, LSB11398 · CRS R49349
Cite this data
Reporters and bloggers may use these numbers and charts. Please credit StartBusinessByState and link to this page.
Source: StartBusinessByState, “Tariffs on Restaurant Food and Supplies, by Item,” https://startbusinessbystate.com/restaurant-food-tariffs-by-item/ (updated October 8, 2026).
FAQ
How much are tariffs on restaurant food?
Across the 23 food and drink items on this page, duties averaged 4.7% of the import value in August 2026, compared with 7.4% in August 2025 and 1.2% in August 2024, based on Census trade data.
Is there a tariff on coffee?
Coffee’s effective tariff rate was 0.03% in August 2026, down from 10.3% in August 2025. Coffee was exempted from the reciprocal tariffs in November 2025. Retail coffee prices were +6.1% from a year earlier (BLS CPI).
Which restaurant imports have the highest tariffs?
In August 2026: aluminum foil (50.9%), cane and beet sugar (32.1%), steel pots, pans and kitchenware (26.0%), butter (20.2%).
Are tariffs why restaurant prices are rising?
Tariffs are one factor. Restaurant prices rose 3.4% in the year to August 2026, while the tariff rate on the foods we track fell. Labor, rent, energy, weather and exchange rates also matter, and this data can’t separate them.
Where does this data come from?
U.S. Census Bureau import data (value and calculated duty by product), and BLS consumer price data, both pulled from official APIs.
Last updated October 8, 2026 by StartBusinessByState.