Census trade data through August 2026 · Updated by StartBusinessByState
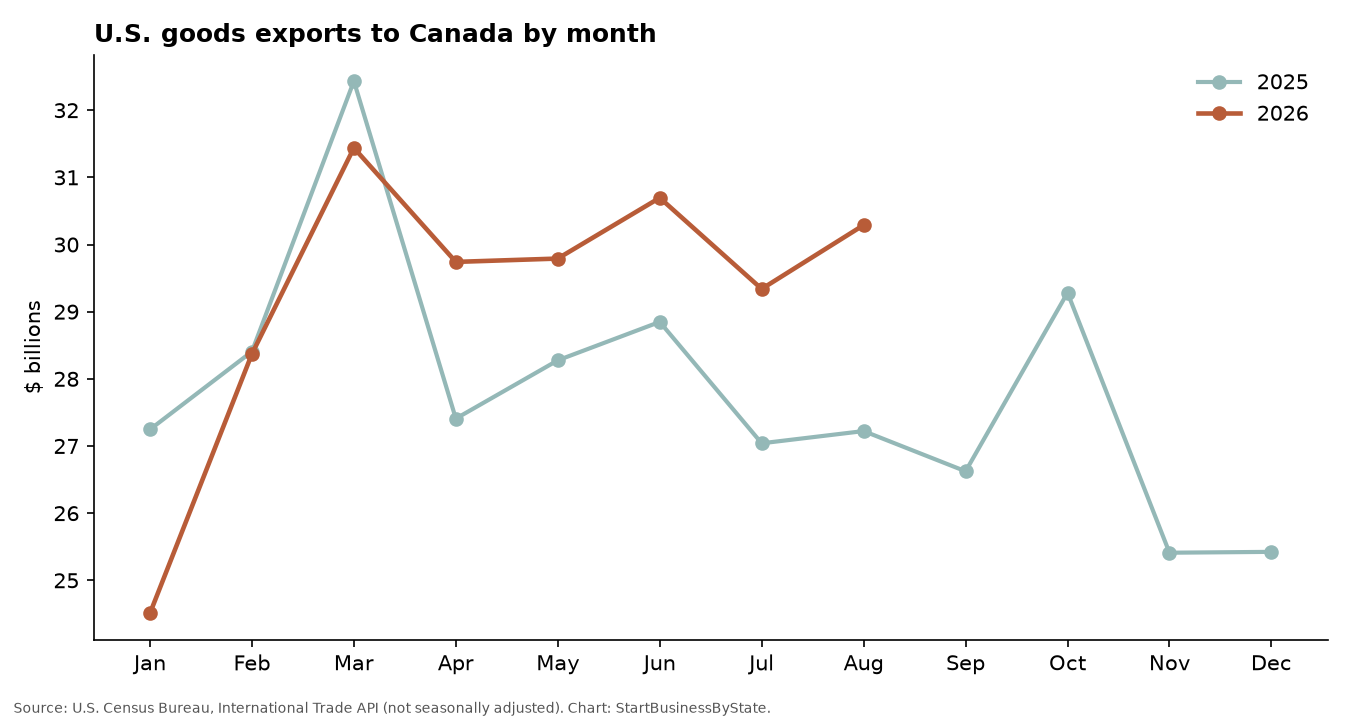
Short answer: If you want to know which states have the most riding on trade with Canada, start with the share of each state’s exports that go there. In January–August 2026, that share ranged from 85.1% in North Dakota to 0.2% in District of Columbia. Exports to Canada fell in 21 states and rose in 30. The U.S. total was up 3.2%, mostly because of fuel and gold. This data runs through August. Canada’s new counter-tariffs started September 8, so they don’t show up here yet.
Key facts for reporters
- U.S. goods exports to Canada: $234.2B in January–August 2026, up 3.2% from $226.9B a year earlier. Exports to all countries rose 14.5%, so Canada’s share of U.S. exports slipped from 15.8% to 14.3%.
- Most dependent on Canada: North Dakota (85.1%), South Dakota (49.3%), Maine (48.8%), West Virginia (47.8%), Montana (40.7%).
- Biggest drops in exports to Canada (states selling at least $500 million there): Alabama (-24.2%), New York (-20.9%), Minnesota (-16.5%), Nebraska (-16.0%), South Carolina (-15.6%).
- Biggest gains (same group): Rhode Island (+96.9%), Alaska (+96.7%), Louisiana (+67.9%), Nevada (+57.2%).
- Product mix matters. The biggest increases nationally were in low-value and other shipments not itemized by product (+$4.4B) and fuel, oil and electricity (+$3.9B). Fuel also includes a price effect: West Texas crude averaged $83.73 a barrel in January–August 2026, vs $67.74 a year earlier. The biggest declines were in machinery and computers ($-2.1B) and vehicles and parts ($-1.2B).
- U.S. imports from Canada: $269.6B, up 4.2%.
- The next state export release, with September data, is scheduled for November 4, 2026 (Census Bureau).
What changed in 2026
Here’s the timeline, using official actions only:
- August 22, 2026: U.S. tariffs of 50% on a list of Canadian products took effect under Section 338 of the Tariff Act of 1930. They apply to goods coming into the U.S. from Canada.
- September 8, 2026: Canada’s counter-tariffs of 15%, 25% or 50% took effect on about C$27.6 billion (US$20 billion) of U.S. goods. These are the ones that hit U.S. exporters directly.
- September 15 and 29, 2026: the U.S. revised its tariff list, then banned imports of certain Canadian dairy products and alcohol.
Sources: Congressional Research Service, U.S. Tariffs on Canadian Imports: Section 338. This page’s export data stops at the end of August, before Canada’s counter-tariffs began. Treat it as a picture of each state’s exposure going in, not a measure of damage done. Monthly changes also depend on things that have nothing to do with tariffs: energy prices, the exchange rate (the Canadian dollar averaged 1.384 per U.S. dollar this year vs 1.400 last year), factory schedules and harvest timing.
The states most exposed to Canada
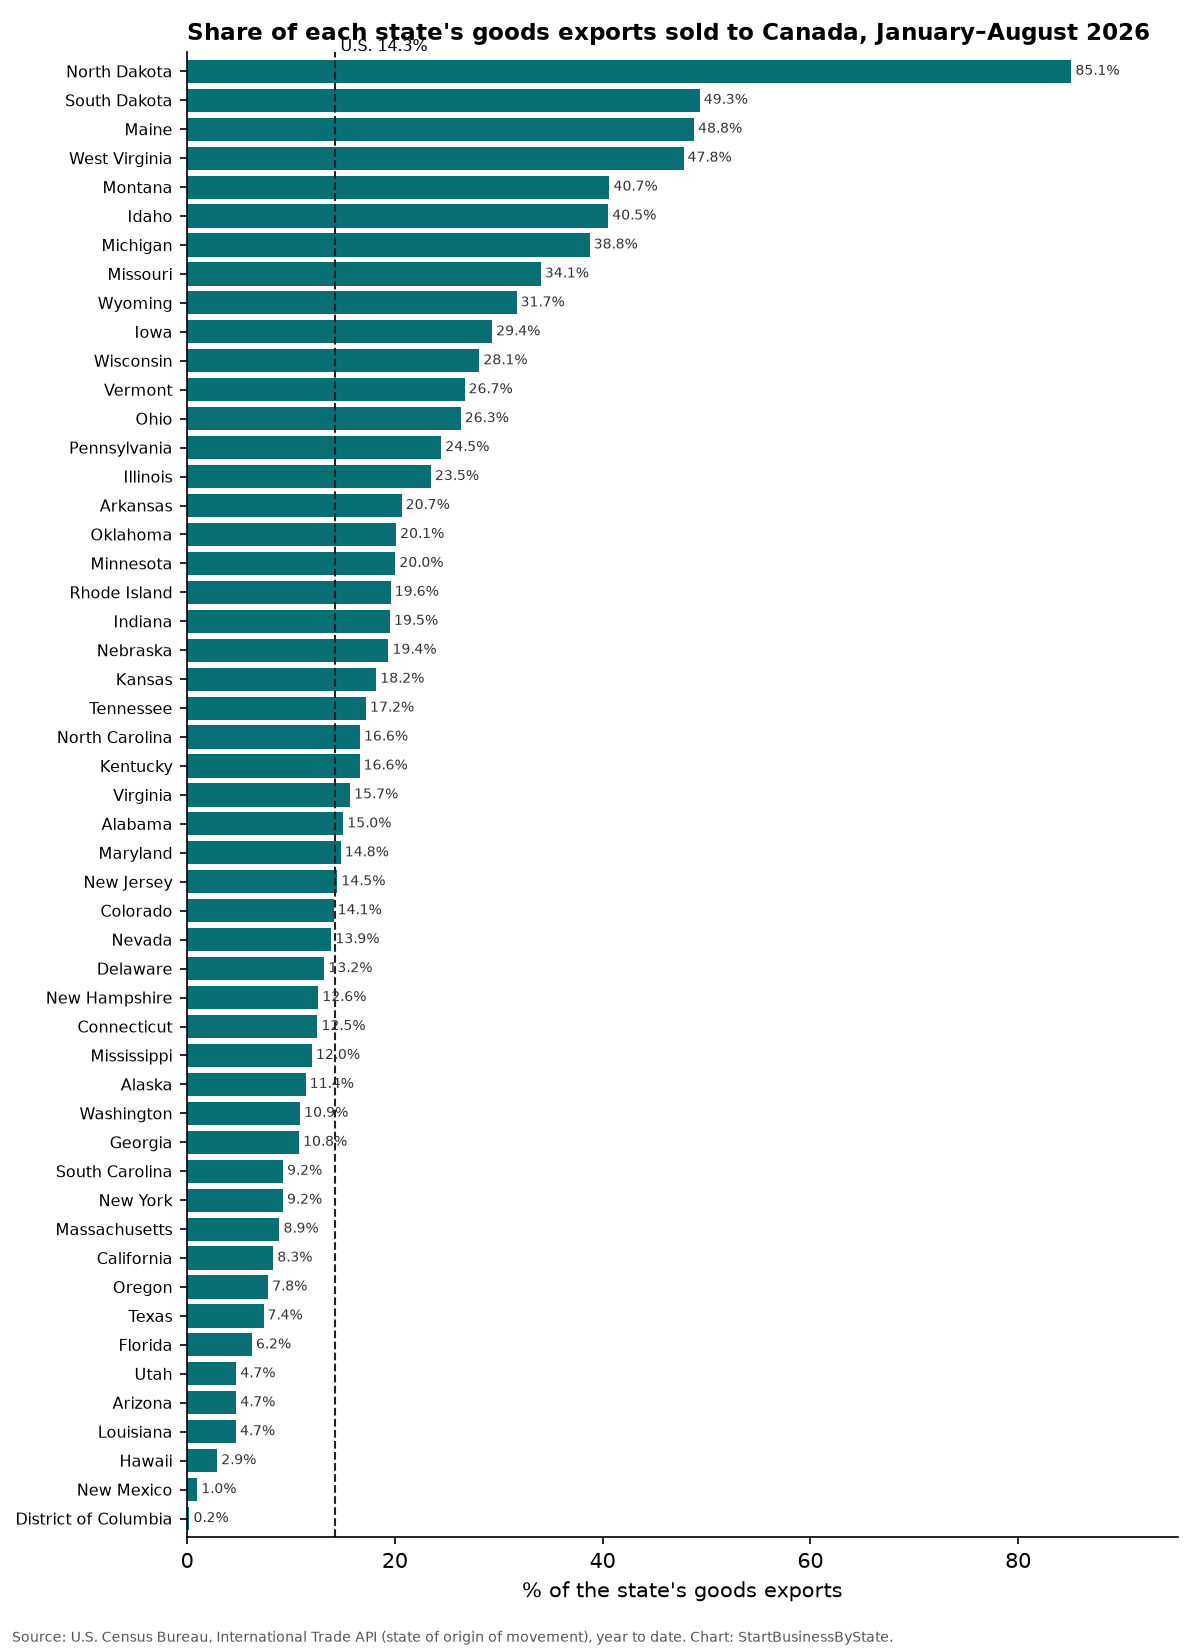
- North Dakota: 85.1% of exports went to Canada ($5.89B)
- South Dakota: 49.3% of exports went to Canada ($622M)
- Maine: 48.8% of exports went to Canada ($994M)
- West Virginia: 47.8% of exports went to Canada ($1.76B)
- Montana: 40.7% of exports went to Canada ($685M)
- Idaho: 40.5% of exports went to Canada ($1.26B)
- Michigan: 38.8% of exports went to Canada ($16.49B)
- Missouri: 34.1% of exports went to Canada ($4.47B)
- Wyoming: 31.7% of exports went to Canada ($413M)
- Iowa: 29.4% of exports went to Canada ($3.30B)
Many of the most exposed states sit on the border, or sell Canada a lot of energy, farm goods or auto parts. Measured per resident, exports to Canada were highest in North Dakota ($7,390), Michigan ($1,626), Kentucky ($1,318), Indiana ($1,278). The U.S. average was $689.
Where exports to Canada are falling
Exports to Canada fell in 21 states in January–August 2026 compared with the same months of 2025. Among states that sell at least $500 million a year to date there, the steepest drops were Alabama (-24.2%), New York (-20.9%), Minnesota (-16.5%), Nebraska (-16.0%), South Carolina (-15.6%), North Carolina (-15.5%). The largest gains were Rhode Island (+96.9%), Alaska (+96.7%), Louisiana (+67.9%), Nevada (+57.2%), Massachusetts (+43.5%).
A falling number doesn’t prove tariffs did it. A single big shipment, a plant shutdown, lower prices for a key product, or a company moving where goods leave from can all shift a state’s total. The state notes below list each state’s top products, which helps explain the swings.
What the U.S. sells Canada, and what moved
The 15 largest product groups, U.S. total, year to date:
| Product group | January–August 2026 | January–August 2025 | Change |
|---|---|---|---|
| Vehicles and parts | $34.64B | $35.81B | -3.3% |
| Machinery and computers | $33.92B | $36.05B | -5.9% |
| Fuel, oil and electricity | $22.44B | $18.53B | +21.1% |
| Electrical equipment and electronics | $17.97B | $18.78B | -4.3% |
| Low-value and other shipments not itemized by product | $10.52B | $6.12B | +72.0% |
| Plastics | $10.01B | $10.04B | -0.3% |
| Gold, silver and gems | $9.51B | $6.09B | +56.2% |
| Medical, optical and measuring instruments | $7.05B | $7.35B | -4.1% |
| Aircraft and parts | $6.70B | $6.80B | -1.4% |
| Medicines | $4.34B | $4.70B | -7.6% |
| Other chemical products | $3.88B | $3.89B | -0.2% |
| Paper and cardboard | $3.75B | $3.82B | -2.0% |
| Iron and steel products | $3.66B | $4.13B | -11.4% |
| Fruit and nuts | $3.21B | $2.95B | +9.1% |
| Furniture and lighting | $2.72B | $3.00B | -9.2% |
Gains in low-value and other shipments not itemized by product, fuel, oil and electricity, gold, silver and gems offset declines in machinery and computers, vehicles and parts, electrical equipment and electronics.
Exports to Canada by state
Click a column header to sort. “Small” marks states that exported less than $500 million to Canada this year to date. Their percent changes can swing a lot.
| State | Exports to Canada, January–August 2026 | Share of state exports, 2026 | Share, 2025 | Change vs. year earlier | Per resident | Imports from Canada, January–August 2026 | Top product group |
|---|---|---|---|---|---|---|---|
| U.S. total | $234.18B | 14.3% | 15.8% | +3.2% | $689 | $269.65B | |
| Alabama | $2.28B | 15.0% | 17.3% | -24.2% | $441 | $2.68B | Vehicles and parts |
| Alaska | $624M | 11.4% | 7.6% | +96.7% | $843 | $960M | Ores |
| Arizona | $1.92B | 4.7% | 6.6% | -4.3% | $253 | $1.90B | Electrical equipment and electronics |
| Arkansas | $920M | 20.7% | 20.6% | +4.1% | $298 | $997M | Machinery and computers |
| California | $10.80B | 8.3% | 9.2% | -6.0% | $274 | $11.98B | Machinery and computers |
| Colorado | $1.02B | 14.1% | 13.8% | -2.9% | $170 | $4.17B | Meat |
| Connecticut | $1.55B | 12.5% | 12.8% | +5.3% | $422 | $3.07B | Fuel, oil and electricity |
| Delaware (small) | $492M | 13.2% | 14.4% | -5.6% | $468 | $562M | Fruit and nuts |
| District of Columbia (small) | $11M | 0.2% | 0.3% | +35.6% | $16 | $46M | Copper |
| Florida | $3.62B | 6.2% | 7.5% | -7.1% | $155 | $4.11B | Machinery and computers |
| Georgia | $4.75B | 10.8% | 12.3% | -1.3% | $425 | $4.54B | Machinery and computers |
| Hawaii (small) | $11M | 2.9% | 3.2% | +3.7% | $8 | $182M | Fruit and nuts |
| Idaho | $1.26B | 40.5% | 40.1% | +5.7% | $631 | $1.10B | Ores |
| Illinois | $13.05B | 23.5% | 23.3% | +5.1% | $1,027 | $41.25B | Machinery and computers |
| Indiana | $8.85B | 19.5% | 19.9% | +2.0% | $1,278 | $7.38B | Vehicles and parts |
| Iowa | $3.30B | 29.4% | 30.3% | -4.0% | $1,018 | $2.28B | Machinery and computers |
| Kansas | $1.98B | 18.2% | 16.8% | +24.8% | $665 | $1.40B | Vehicles and parts |
| Kentucky | $6.05B | 16.6% | 19.0% | -9.8% | $1,318 | $3.78B | Vehicles and parts |
| Louisiana | $3.66B | 4.7% | 3.6% | +67.9% | $796 | $2.51B | Fuel, oil and electricity |
| Maine | $994M | 48.8% | 40.1% | +19.3% | $708 | $3.33B | Aircraft and parts |
| Maryland | $1.70B | 14.8% | 12.9% | +19.9% | $272 | $2.15B | Machinery and computers |
| Massachusetts | $2.67B | 8.9% | 7.5% | +43.5% | $374 | $7.59B | Machinery and computers |
| Michigan | $16.49B | 38.8% | 38.8% | +5.2% | $1,626 | $29.07B | Vehicles and parts |
| Minnesota | $3.36B | 20.0% | 25.2% | -16.5% | $580 | $9.79B | Machinery and computers |
| Mississippi | $1.33B | 12.0% | 13.7% | +5.2% | $453 | $1.04B | Machinery and computers |
| Missouri | $4.47B | 34.1% | 36.5% | -9.2% | $716 | $2.38B | Vehicles and parts |
| Montana | $685M | 40.7% | 41.0% | +25.9% | $602 | $4.12B | Ores |
| Nebraska | $940M | 19.4% | 21.1% | -16.0% | $469 | $739M | Machinery and computers |
| Nevada | $1.53B | 13.9% | 12.9% | +57.2% | $467 | $829M | Ores |
| New Hampshire | $670M | 12.6% | 11.8% | +19.1% | $476 | $1.37B | Aircraft and parts |
| New Jersey | $5.04B | 14.5% | 17.7% | -0.4% | $531 | $7.19B | Gold, silver and gems |
| New Mexico (small) | $135M | 1.0% | 1.3% | +11.3% | $64 | $358M | Electrical equipment and electronics |
| New York | $10.83B | 9.2% | 14.4% | -20.9% | $545 | $12.49B | Gold, silver and gems |
| North Carolina | $5.06B | 16.6% | 20.6% | -15.5% | $458 | $3.56B | Machinery and computers |
| North Dakota | $5.89B | 85.1% | 82.2% | +18.2% | $7,390 | $1.81B | Fuel, oil and electricity |
| Ohio | $11.53B | 26.3% | 34.3% | -8.4% | $970 | $12.16B | Machinery and computers |
| Oklahoma | $1.17B | 20.1% | 21.6% | +4.0% | $285 | $6.24B | Machinery and computers |
| Oregon | $1.69B | 7.8% | 8.3% | +8.9% | $394 | $2.44B | Vehicles and parts |
| Pennsylvania | $8.69B | 24.5% | 27.2% | -9.6% | $664 | $9.43B | Machinery and computers |
| Rhode Island | $717M | 19.6% | 14.5% | +96.9% | $645 | $1.29B | Gold, silver and gems |
| South Carolina | $2.30B | 9.2% | 10.8% | -15.6% | $420 | $2.58B | Rubber and tires |
| South Dakota | $622M | 49.3% | 45.4% | +9.5% | $672 | $421M | Beverages and alcohol |
| Tennessee | $4.48B | 17.2% | 17.9% | -1.0% | $620 | $3.02B | Machinery and computers |
| Texas | $27.19B | 7.4% | 7.8% | +15.9% | $869 | $22.26B | Fuel, oil and electricity |
| Utah | $1.06B | 4.7% | 8.9% | -2.5% | $302 | $3.22B | Machinery and computers |
| Vermont (small) | $336M | 26.7% | 31.2% | -26.3% | $519 | $1.65B | Cocoa and chocolate |
| Virginia | $2.07B | 15.7% | 15.6% | +3.2% | $235 | $2.58B | Vehicles and parts |
| Washington | $5.34B | 10.9% | 11.5% | +9.4% | $671 | $11.54B | Aircraft and parts |
| West Virginia | $1.76B | 47.8% | 44.2% | +28.7% | $995 | $1.43B | Vehicles and parts |
| Wisconsin | $5.24B | 28.1% | 27.6% | +3.0% | $880 | $3.99B | Machinery and computers |
| Wyoming (small) | $413M | 31.7% | 20.4% | +50.6% | $703 | $309M | Fuel, oil and electricity |
State-by-state notes
Alabama
Alabama exported $2.28B of goods to Canada in January–August 2026, 15.0% of everything it exported (rank 27 of 51; U.S. 14.3%). That is down 24.2% from $3.00B in the same months of 2025. Biggest product groups sold to Canada: Vehicles and parts (46%); aircraft and parts (9%); machinery and computers (7%). Goods imported from Canada and bound for Alabama: $2.68B.
Alaska
Alaska exported $624M of goods to Canada in January–August 2026, 11.4% of everything it exported (rank 36 of 51; U.S. 14.3%). That is up 96.7% from $317M in the same months of 2025. Biggest product groups sold to Canada: Ores (77%); fuel, oil and electricity (9%); fish and seafood (5%). Goods imported from Canada and bound for Alaska: $960M.
Arizona
Arizona exported $1.92B of goods to Canada in January–August 2026, 4.7% of everything it exported (rank 47 of 51; U.S. 14.3%). That is down 4.3% from $2.00B in the same months of 2025. Biggest product groups sold to Canada: Electrical equipment and electronics (21%); machinery and computers (16%); vegetables (14%). Goods imported from Canada and bound for Arizona: $1.90B.
Arkansas
Arkansas exported $920M of goods to Canada in January–August 2026, 20.7% of everything it exported (rank 16 of 51; U.S. 14.3%). That is up 4.1% from $883M in the same months of 2025. Biggest product groups sold to Canada: Machinery and computers (15%); electrical equipment and electronics (10%); paper and cardboard (8%). Goods imported from Canada and bound for Arkansas: $997M.
California
California exported $10.80B of goods to Canada in January–August 2026, 8.3% of everything it exported (rank 42 of 51; U.S. 14.3%). That is down 6.0% from $11.49B in the same months of 2025. Biggest product groups sold to Canada: Machinery and computers (19%); electrical equipment and electronics (16%); fruit and nuts (12%). Goods imported from Canada and bound for California: $11.98B.
Colorado
Colorado exported $1.02B of goods to Canada in January–August 2026, 14.1% of everything it exported (rank 30 of 51; U.S. 14.3%). That is down 2.9% from $1.05B in the same months of 2025. Biggest product groups sold to Canada: Meat (24%); machinery and computers (19%); medical, optical and measuring instruments (8%). Goods imported from Canada and bound for Colorado: $4.17B.
Connecticut
Connecticut exported $1.55B of goods to Canada in January–August 2026, 12.5% of everything it exported (rank 34 of 51; U.S. 14.3%). That is up 5.3% from $1.47B in the same months of 2025. Biggest product groups sold to Canada: Fuel, oil and electricity (26%); machinery and computers (16%); aircraft and parts (14%). Goods imported from Canada and bound for Connecticut: $3.07B.
Delaware
Delaware exported $492M of goods to Canada in January–August 2026, 13.2% of everything it exported (rank 32 of 51; U.S. 14.3%). That is down 5.6% from $521M in the same months of 2025 (a small total, so percent changes can swing a lot). Biggest product groups sold to Canada: Fruit and nuts (26%); medicines (17%); plastics (10%). Goods imported from Canada and bound for Delaware: $562M.
District of Columbia
District of Columbia exported $11M of goods to Canada in January–August 2026, 0.2% of everything it exported (rank 51 of 51; U.S. 14.3%). That is up 35.6% from $8M in the same months of 2025 (a small total, so percent changes can swing a lot). Biggest product groups sold to Canada: Copper (35%); fuel, oil and electricity (15%); vehicles and parts (12%). Goods imported from Canada and bound for District of Columbia: $46M.
Florida
Florida exported $3.62B of goods to Canada in January–August 2026, 6.2% of everything it exported (rank 45 of 51; U.S. 14.3%). That is down 7.1% from $3.90B in the same months of 2025. Biggest product groups sold to Canada: Machinery and computers (13%); aircraft and parts (13%); electrical equipment and electronics (9%). Goods imported from Canada and bound for Florida: $4.11B.
Georgia
Georgia exported $4.75B of goods to Canada in January–August 2026, 10.8% of everything it exported (rank 38 of 51; U.S. 14.3%). That is down 1.3% from $4.81B in the same months of 2025. Biggest product groups sold to Canada: Machinery and computers (21%); vehicles and parts (10%); electrical equipment and electronics (8%). Goods imported from Canada and bound for Georgia: $4.54B.
Hawaii
Hawaii exported $11M of goods to Canada in January–August 2026, 2.9% of everything it exported (rank 49 of 51; U.S. 14.3%). That is up 3.7% from $10M in the same months of 2025 (a small total, so percent changes can swing a lot). Biggest product groups sold to Canada: Fruit and nuts (42%); live animals (19%); vegetables (5%). Goods imported from Canada and bound for Hawaii: $182M.
Idaho
Idaho exported $1.26B of goods to Canada in January–August 2026, 40.5% of everything it exported (rank 6 of 51; U.S. 14.3%). That is up 5.7% from $1.20B in the same months of 2025. Biggest product groups sold to Canada: Ores (33%); fertilizer (14%); live animals (13%). Goods imported from Canada and bound for Idaho: $1.10B.
Illinois
Illinois exported $13.05B of goods to Canada in January–August 2026, 23.5% of everything it exported (rank 15 of 51; U.S. 14.3%). That is up 5.1% from $12.42B in the same months of 2025. Biggest product groups sold to Canada: Machinery and computers (20%); vehicles and parts (14%); electrical equipment and electronics (9%). Goods imported from Canada and bound for Illinois: $41.25B.
Indiana
Indiana exported $8.85B of goods to Canada in January–August 2026, 19.5% of everything it exported (rank 20 of 51; U.S. 14.3%). That is up 2.0% from $8.67B in the same months of 2025. Biggest product groups sold to Canada: Vehicles and parts (41%); machinery and computers (13%); electrical equipment and electronics (8%). Goods imported from Canada and bound for Indiana: $7.38B.
Iowa
Iowa exported $3.30B of goods to Canada in January–August 2026, 29.4% of everything it exported (rank 10 of 51; U.S. 14.3%). That is down 4.0% from $3.44B in the same months of 2025. Biggest product groups sold to Canada: Machinery and computers (18%); vehicles and parts (15%); beverages and alcohol (15%). Goods imported from Canada and bound for Iowa: $2.28B.
Kansas
Kansas exported $1.98B of goods to Canada in January–August 2026, 18.2% of everything it exported (rank 22 of 51; U.S. 14.3%). That is up 24.8% from $1.58B in the same months of 2025. Biggest product groups sold to Canada: Vehicles and parts (19%); aircraft and parts (14%); machinery and computers (13%). Goods imported from Canada and bound for Kansas: $1.40B.
Kentucky
Kentucky exported $6.05B of goods to Canada in January–August 2026, 16.6% of everything it exported (rank 25 of 51; U.S. 14.3%). That is down 9.8% from $6.71B in the same months of 2025. Biggest product groups sold to Canada: Vehicles and parts (46%); machinery and computers (13%); aircraft and parts (7%). Goods imported from Canada and bound for Kentucky: $3.78B.
Louisiana
Louisiana exported $3.66B of goods to Canada in January–August 2026, 4.7% of everything it exported (rank 48 of 51; U.S. 14.3%). That is up 67.9% from $2.18B in the same months of 2025. Biggest product groups sold to Canada: Fuel, oil and electricity (58%); plastics (13%); other chemical products (4%). Goods imported from Canada and bound for Louisiana: $2.51B.
Maine
Maine exported $994M of goods to Canada in January–August 2026, 48.8% of everything it exported (rank 3 of 51; U.S. 14.3%). That is up 19.3% from $833M in the same months of 2025. Biggest product groups sold to Canada: Aircraft and parts (20%); fuel, oil and electricity (19%); fish and seafood (13%). Goods imported from Canada and bound for Maine: $3.33B.
Maryland
Maryland exported $1.70B of goods to Canada in January–August 2026, 14.8% of everything it exported (rank 28 of 51; U.S. 14.3%). That is up 19.9% from $1.42B in the same months of 2025. Biggest product groups sold to Canada: Machinery and computers (34%); vehicles and parts (16%); copper (6%). Goods imported from Canada and bound for Maryland: $2.15B.
Massachusetts
Massachusetts exported $2.67B of goods to Canada in January–August 2026, 8.9% of everything it exported (rank 41 of 51; U.S. 14.3%). That is up 43.5% from $1.86B in the same months of 2025. Biggest product groups sold to Canada: Machinery and computers (26%); medical, optical and measuring instruments (13%); medicines (9%). Goods imported from Canada and bound for Massachusetts: $7.59B.
Michigan
Michigan exported $16.49B of goods to Canada in January–August 2026, 38.8% of everything it exported (rank 7 of 51; U.S. 14.3%). That is up 5.2% from $15.67B in the same months of 2025. Biggest product groups sold to Canada: Vehicles and parts (53%); fuel, oil and electricity (13%); machinery and computers (8%). Goods imported from Canada and bound for Michigan: $29.07B.
Minnesota
Minnesota exported $3.36B of goods to Canada in January–August 2026, 20.0% of everything it exported (rank 18 of 51; U.S. 14.3%). That is down 16.5% from $4.02B in the same months of 2025. Biggest product groups sold to Canada: Machinery and computers (16%); vehicles and parts (16%); electrical equipment and electronics (9%). Goods imported from Canada and bound for Minnesota: $9.79B.
Mississippi
Mississippi exported $1.33B of goods to Canada in January–August 2026, 12.0% of everything it exported (rank 35 of 51; U.S. 14.3%). That is up 5.2% from $1.27B in the same months of 2025. Biggest product groups sold to Canada: Machinery and computers (27%); electrical equipment and electronics (23%); vehicles and parts (14%). Goods imported from Canada and bound for Mississippi: $1.04B.
Missouri
Missouri exported $4.47B of goods to Canada in January–August 2026, 34.1% of everything it exported (rank 8 of 51; U.S. 14.3%). That is down 9.2% from $4.93B in the same months of 2025. Biggest product groups sold to Canada: Vehicles and parts (51%); other chemical products (6%); machinery and computers (6%). Goods imported from Canada and bound for Missouri: $2.38B.
Montana
Montana exported $685M of goods to Canada in January–August 2026, 40.7% of everything it exported (rank 5 of 51; U.S. 14.3%). That is up 25.9% from $544M in the same months of 2025. Biggest product groups sold to Canada: Ores (27%); live animals (22%); fuel, oil and electricity (13%). Goods imported from Canada and bound for Montana: $4.12B.
Nebraska
Nebraska exported $940M of goods to Canada in January–August 2026, 19.4% of everything it exported (rank 21 of 51; U.S. 14.3%). That is down 16.0% from $1.12B in the same months of 2025. Biggest product groups sold to Canada: Machinery and computers (26%); fuel, oil and electricity (14%); vehicles and parts (10%). Goods imported from Canada and bound for Nebraska: $739M.
Nevada
Nevada exported $1.53B of goods to Canada in January–August 2026, 13.9% of everything it exported (rank 31 of 51; U.S. 14.3%). That is up 57.2% from $970M in the same months of 2025. Biggest product groups sold to Canada: Ores (29%); gold, silver and gems (24%); machinery and computers (8%). Goods imported from Canada and bound for Nevada: $829M.
New Hampshire
New Hampshire exported $670M of goods to Canada in January–August 2026, 12.6% of everything it exported (rank 33 of 51; U.S. 14.3%). That is up 19.1% from $563M in the same months of 2025. Biggest product groups sold to Canada: Aircraft and parts (28%); machinery and computers (20%); electrical equipment and electronics (12%). Goods imported from Canada and bound for New Hampshire: $1.37B.
New Jersey
New Jersey exported $5.04B of goods to Canada in January–August 2026, 14.5% of everything it exported (rank 29 of 51; U.S. 14.3%). That is down 0.4% from $5.06B in the same months of 2025. Biggest product groups sold to Canada: Gold, silver and gems (21%); machinery and computers (8%); plastics (7%). Goods imported from Canada and bound for New Jersey: $7.19B.
New Mexico
New Mexico exported $135M of goods to Canada in January–August 2026, 1.0% of everything it exported (rank 50 of 51; U.S. 14.3%). That is up 11.3% from $122M in the same months of 2025 (a small total, so percent changes can swing a lot). Biggest product groups sold to Canada: Electrical equipment and electronics (19%); fertilizer (17%); vegetables (11%). Goods imported from Canada and bound for New Mexico: $358M.
New York
New York exported $10.83B of goods to Canada in January–August 2026, 9.2% of everything it exported (rank 40 of 51; U.S. 14.3%). That is down 20.9% from $13.70B in the same months of 2025. Biggest product groups sold to Canada: Gold, silver and gems (25%); low-value and other shipments not itemized by product (20%); machinery and computers (8%). Goods imported from Canada and bound for New York: $12.49B.
North Carolina
North Carolina exported $5.06B of goods to Canada in January–August 2026, 16.6% of everything it exported (rank 24 of 51; U.S. 14.3%). That is down 15.5% from $5.99B in the same months of 2025. Biggest product groups sold to Canada: Machinery and computers (18%); medicines (15%); vehicles and parts (10%). Goods imported from Canada and bound for North Carolina: $3.56B.
North Dakota
North Dakota exported $5.89B of goods to Canada in January–August 2026, 85.1% of everything it exported (rank 1 of 51; U.S. 14.3%). That is up 18.2% from $4.98B in the same months of 2025. Biggest product groups sold to Canada: Fuel, oil and electricity (82%); machinery and computers (4%); beverages and alcohol (3%). Goods imported from Canada and bound for North Dakota: $1.81B.
Ohio
Ohio exported $11.53B of goods to Canada in January–August 2026, 26.3% of everything it exported (rank 13 of 51; U.S. 14.3%). That is down 8.4% from $12.60B in the same months of 2025. Biggest product groups sold to Canada: Machinery and computers (27%); vehicles and parts (17%); plastics (6%). Goods imported from Canada and bound for Ohio: $12.16B.
Oklahoma
Oklahoma exported $1.17B of goods to Canada in January–August 2026, 20.1% of everything it exported (rank 17 of 51; U.S. 14.3%). That is up 4.0% from $1.12B in the same months of 2025. Biggest product groups sold to Canada: Machinery and computers (31%); vehicles and parts (16%); electrical equipment and electronics (11%). Goods imported from Canada and bound for Oklahoma: $6.24B.
Oregon
Oregon exported $1.69B of goods to Canada in January–August 2026, 7.8% of everything it exported (rank 43 of 51; U.S. 14.3%). That is up 8.9% from $1.55B in the same months of 2025. Biggest product groups sold to Canada: Vehicles and parts (11%); fruit and nuts (11%); machinery and computers (10%). Goods imported from Canada and bound for Oregon: $2.44B.
Pennsylvania
Pennsylvania exported $8.69B of goods to Canada in January–August 2026, 24.5% of everything it exported (rank 14 of 51; U.S. 14.3%). That is down 9.6% from $9.61B in the same months of 2025. Biggest product groups sold to Canada: Machinery and computers (15%); electrical equipment and electronics (13%); medicines (8%). Goods imported from Canada and bound for Pennsylvania: $9.43B.
Rhode Island
Rhode Island exported $717M of goods to Canada in January–August 2026, 19.6% of everything it exported (rank 19 of 51; U.S. 14.3%). That is up 96.9% from $364M in the same months of 2025. Biggest product groups sold to Canada: Gold, silver and gems (60%); electrical equipment and electronics (15%); machinery and computers (7%). Goods imported from Canada and bound for Rhode Island: $1.29B.
South Carolina
South Carolina exported $2.30B of goods to Canada in January–August 2026, 9.2% of everything it exported (rank 39 of 51; U.S. 14.3%). That is down 15.6% from $2.73B in the same months of 2025. Biggest product groups sold to Canada: Rubber and tires (20%); machinery and computers (19%); vehicles and parts (14%). Goods imported from Canada and bound for South Carolina: $2.58B.
South Dakota
South Dakota exported $622M of goods to Canada in January–August 2026, 49.3% of everything it exported (rank 2 of 51; U.S. 14.3%). That is up 9.5% from $568M in the same months of 2025. Biggest product groups sold to Canada: Beverages and alcohol (45%); machinery and computers (14%); animal feed (11%). Goods imported from Canada and bound for South Dakota: $421M.
Tennessee
Tennessee exported $4.48B of goods to Canada in January–August 2026, 17.2% of everything it exported (rank 23 of 51; U.S. 14.3%). That is down 1.0% from $4.53B in the same months of 2025. Biggest product groups sold to Canada: Machinery and computers (23%); vehicles and parts (23%); electrical equipment and electronics (15%). Goods imported from Canada and bound for Tennessee: $3.02B.
Texas
Texas exported $27.19B of goods to Canada in January–August 2026, 7.4% of everything it exported (rank 44 of 51; U.S. 14.3%). That is up 15.9% from $23.46B in the same months of 2025. Biggest product groups sold to Canada: Fuel, oil and electricity (33%); machinery and computers (14%); gold, silver and gems (12%). Goods imported from Canada and bound for Texas: $22.26B.
Utah
Utah exported $1.06B of goods to Canada in January–August 2026, 4.7% of everything it exported (rank 46 of 51; U.S. 14.3%). That is down 2.5% from $1.09B in the same months of 2025. Biggest product groups sold to Canada: Machinery and computers (22%); vehicles and parts (10%); plastics (6%). Goods imported from Canada and bound for Utah: $3.22B.
Vermont
Vermont exported $336M of goods to Canada in January–August 2026, 26.7% of everything it exported (rank 12 of 51; U.S. 14.3%). That is down 26.3% from $456M in the same months of 2025 (a small total, so percent changes can swing a lot). Biggest product groups sold to Canada: Cocoa and chocolate (19%); paper and cardboard (15%); machinery and computers (13%). Goods imported from Canada and bound for Vermont: $1.65B.
Virginia
Virginia exported $2.07B of goods to Canada in January–August 2026, 15.7% of everything it exported (rank 26 of 51; U.S. 14.3%). That is up 3.2% from $2.01B in the same months of 2025. Biggest product groups sold to Canada: Vehicles and parts (18%); machinery and computers (12%); electrical equipment and electronics (10%). Goods imported from Canada and bound for Virginia: $2.58B.
Washington
Washington exported $5.34B of goods to Canada in January–August 2026, 10.9% of everything it exported (rank 37 of 51; U.S. 14.3%). That is up 9.4% from $4.88B in the same months of 2025. Biggest product groups sold to Canada: Aircraft and parts (23%); machinery and computers (11%); vehicles and parts (6%). Goods imported from Canada and bound for Washington: $11.54B.
West Virginia
West Virginia exported $1.76B of goods to Canada in January–August 2026, 47.8% of everything it exported (rank 4 of 51; U.S. 14.3%). That is up 28.7% from $1.37B in the same months of 2025. Biggest product groups sold to Canada: Vehicles and parts (48%); machinery and computers (24%); soap and cleaning products (5%). Goods imported from Canada and bound for West Virginia: $1.43B.
Wisconsin
Wisconsin exported $5.24B of goods to Canada in January–August 2026, 28.1% of everything it exported (rank 11 of 51; U.S. 14.3%). That is up 3.0% from $5.09B in the same months of 2025. Biggest product groups sold to Canada: Machinery and computers (22%); electrical equipment and electronics (11%); plastics (8%). Goods imported from Canada and bound for Wisconsin: $3.99B.
Wyoming
Wyoming exported $413M of goods to Canada in January–August 2026, 31.7% of everything it exported (rank 9 of 51; U.S. 14.3%). That is up 50.6% from $274M in the same months of 2025 (a small total, so percent changes can swing a lot). Biggest product groups sold to Canada: Fuel, oil and electricity (39%); fertilizer (13%); machinery and computers (8%). Goods imported from Canada and bound for Wyoming: $309M.
What this means for small businesses
If you sell to Canadian customers, or buy parts or supplies from Canada, now is a good time to check which of your products are on either country’s tariff list. Talk to your customs broker or freight forwarder, and keep an eye on cash flow if orders slow or duties go up. For the U.S. side of the tariff story, see tariff exposure for trades by state, tariff rates on trade tools and equipment, tariff refunds by state and tariffs on restaurant food by item.
Need working capital while trade is unsettled?
Established businesses with steady sales can compare funding offers. See business funding options from Cardiff. This isn’t a fit for startups with no revenue yet.
We may earn a commission if you use this link. It doesn’t change what you pay, and it doesn’t affect the data on this page.
Methods and limits
- Source: U.S. Census Bureau International Trade API: state exports by HS code (
exports/statehs) and state imports (imports/statehs), country code 1220 (Canada). Values are year to date through August 2026, in current dollars, not seasonally adjusted. - Which state gets credit: exports are counted by the “state of origin of movement,” which is where the goods started their trip to the border. That’s often, but not always, where they were made or grown. Exporters with no reported state ($31.1B to Canada this year) aren’t included in any state. Imports are counted by the state where the goods were headed.
- Goods only. Services such as tourism aren’t included.
- Comparisons: we compare the same months a year apart, which takes care of seasonal patterns. Small totals can swing a lot.
- Product groups are 2-digit Harmonized System chapters, with labels shortened into plain English.
- Context data: exchange rate DEXCAUS and WTI crude oil price DCOILWTICO from the Federal Reserve Bank of St. Louis (FRED), averaged over the same months.
Sources
- U.S. Census Bureau, State Exports and Imports (data via the International Trade API)
- Congressional Research Service, U.S. Tariffs on Canadian Imports: Section 338 of the Tariff Act of 1930
- FRED, Canadian Dollars to U.S. Dollar Spot Exchange Rate (DEXCAUS); FRED, WTI Crude Oil (DCOILWTICO)
Cite this data
Reporters and bloggers may use these numbers and charts. Please credit StartBusinessByState and link to this page.
Source: StartBusinessByState, “Canada Trade War Exposure by State: Who Sells the Most to Canada (2026),” https://startbusinessbystate.com/canada-trade-war-exposure-by-state/ (updated October 8, 2026).
FAQ
Which state depends most on trade with Canada?
North Dakota. Canada bought 85.1% of its goods exports in January–August 2026. Next: South Dakota (49.3%) and Maine (48.8%).
Are U.S. exports to Canada falling?
Not overall, at least through August 2026. They were up 3.2% from a year earlier, mostly because of fuel and gold, but they fell in 21 states. Exports to the rest of the world grew faster (14.5%), so Canada’s share of U.S. exports went down.
Does this data show the effect of Canada's counter-tariffs?
Not yet. Canada’s counter-tariffs started September 8, 2026, and this data runs through August. The September numbers are due November 4, 2026.
How much does the U.S. export to Canada?
$234.2B of goods in January–August 2026, which is 14.3% of all U.S. goods exports.
Where does this data come from?
The U.S. Census Bureau’s official trade statistics, pulled from its International Trade API. Exports are credited to the state where the shipment began its journey.
Last updated October 8, 2026 by StartBusinessByState.