U.S. Census Bureau 2025 state import data · CBP refund guidance · USTR Section 301 notice (July 2026) · Last updated October 2, 2026
The Supreme Court struck down the IEEPA tariffs on February 20, 2026, and importers can claim refunds. But a new tariff took their place. Since July 24, most imports from 60 economies pay an extra 10% or 12.5%. In 2025, 38% of U.S. imports came from economies now in the 12.5% tier. In Hawaii it was 65%.
Key findings
- The IEEPA tariffs were ruled illegal. In Learning Resources, Inc. v. Trump, decided February 20, 2026, the Supreme Court held 6 to 3 that IEEPA does not let the President impose tariffs.
- Refunds are flowing. In a September 15 court filing, CBP reported about $134.7 billion in refunds accepted into its CAPE system, with about $122 billion (including interest) certified and sent to the Treasury for payment, as summarized by C.H. Robinson. About $1.3 billion was on hold because importers had not given CBP bank details.
- Phase 3 opens October 6, 2026, but only for importers who sued at the Court of International Trade and whose older, finally liquidated entries the court ordered reliquidated.
- The new tariffs reach most imports. The 10% and 12.5% Section 301 tariffs replaced the temporary 10% Section 122 tariff on July 24. Of 2025 U.S. imports, 38.3% came from the 12.5% tier, 34.2% from the 10% tier outside Canada and Mexico, and 26.8% from Canada and Mexico, where goods that qualify under USMCA are exempt.
- Six states got half or more of their 2025 imports from the 12.5% tier: Hawaii (65%), Nebraska (59%), New York (58%), Louisiana (56%), California (53%) and Alaska (50%).
- Northern border states lean on Canada. Montana got 92% of its imports from Canada and Mexico, Vermont 76% and Michigan 73%. For them, USMCA paperwork decides a lot.
- Most importers are small. Of 240,535 importing companies in 2024, 97.3% had fewer than 500 employees. They brought in 30% of the import value Census could match to a company.
How to get an IEEPA tariff refund
- Only the importer of record gets the refund. That is the company on the customs entry, or its customs broker filing for it.
- Set up an ACE Portal account and add your bank account for ACH refunds. CBP will not send most refunds by paper check.
- File a CAPE Declaration. It is a CSV list of your entry numbers, uploaded in the ACE Portal. Each declaration can hold up to 9,999 entries, and you can file more than one.
- Which entries qualify now: unliquidated entries and entries liquidated within the last 80 days (phase 1, since April 20, 2026), plus some entries flagged for reconciliation (phase 2, since June 29). Phase 3, from October 6, covers older entries only for importers with a court order.
- Timing: CBP says valid refunds generally go out 60 to 90 days after a declaration is accepted. After an entry is liquidated, most refunds reach the bank in 3 to 5 weeks.
- Watch for scams. CBP charges no fee.
Where the new tariffs hit hardest
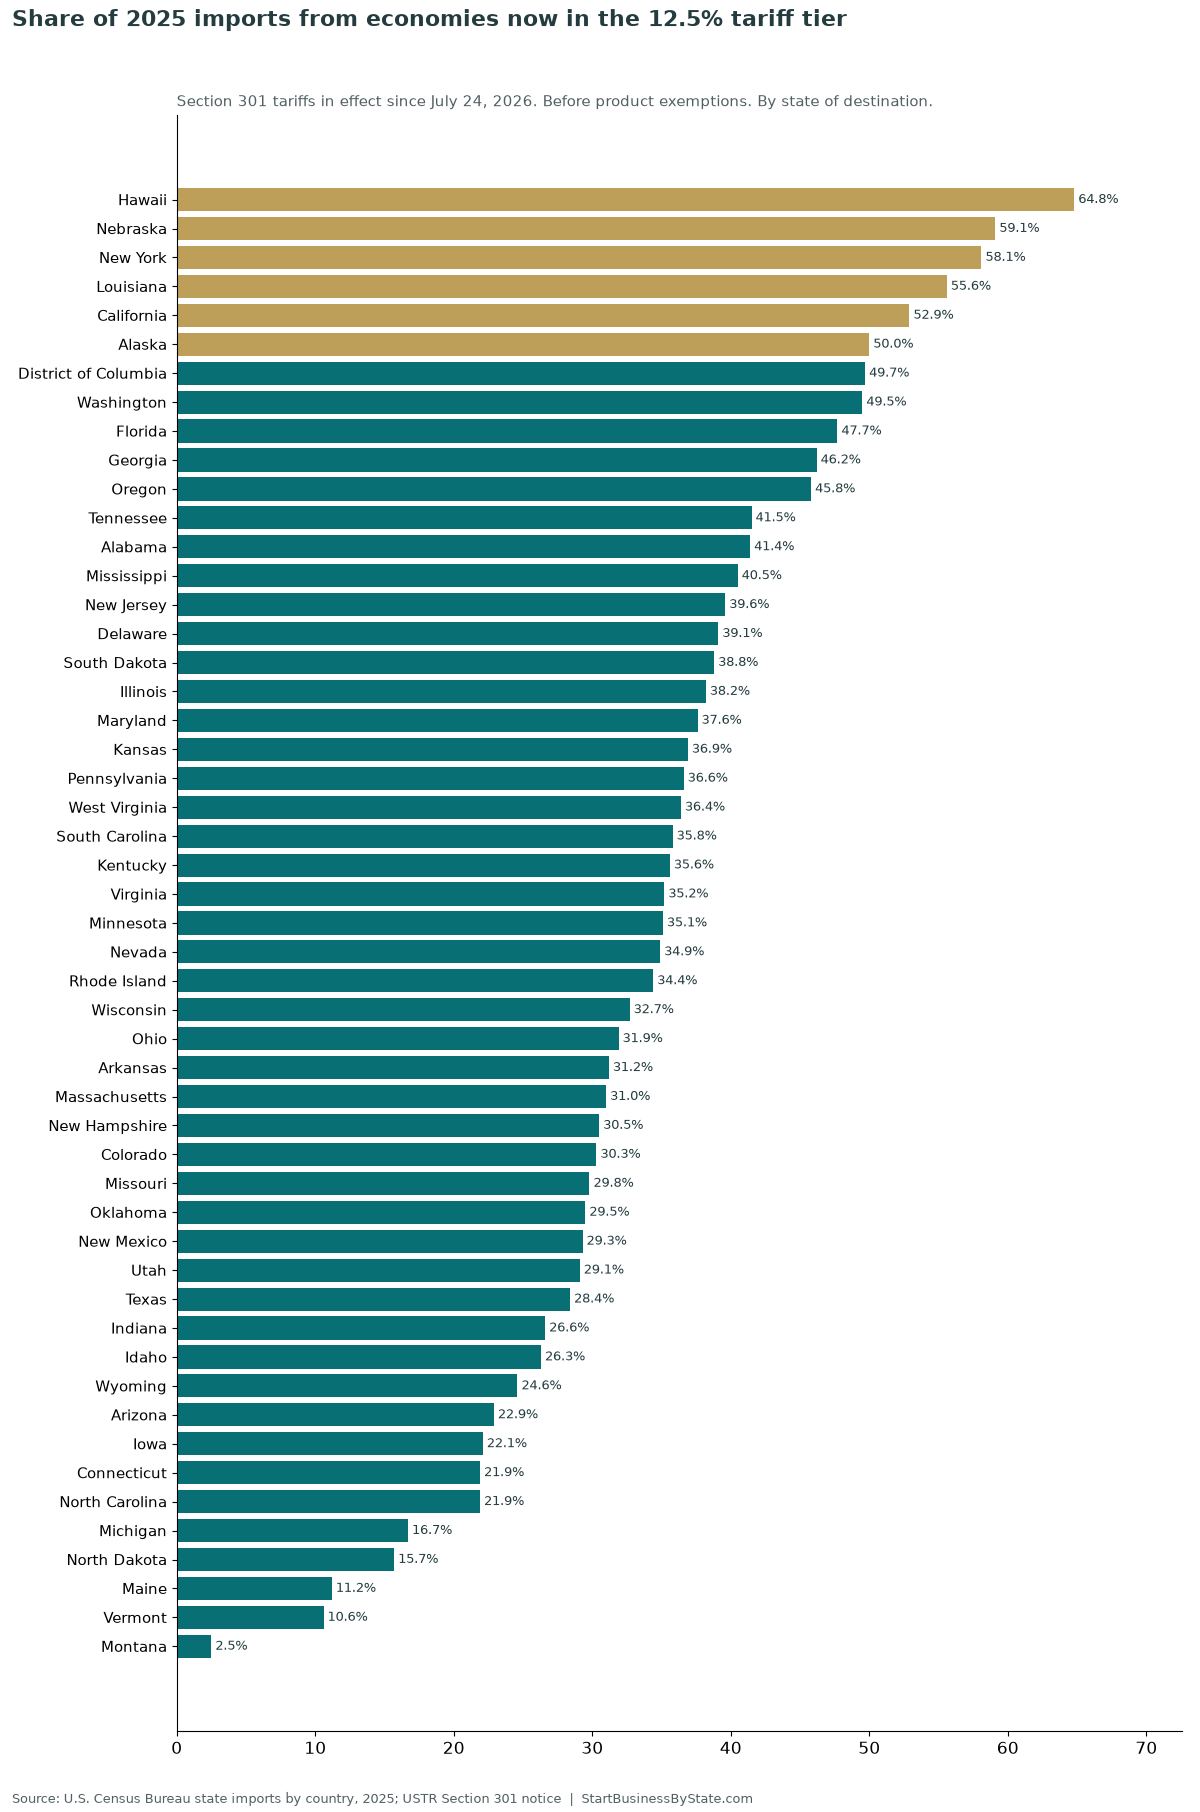
The 12.5% tier includes China, Vietnam, Thailand, Brazil, Australia, Singapore and others, plus Japan, South Korea and Switzerland, where the 12.5% works as a floor that counts the normal duty. The 10% tier includes Canada, Mexico, India, the United Kingdom and others, plus the European Union and Taiwan with a 10% floor.
Importers by state
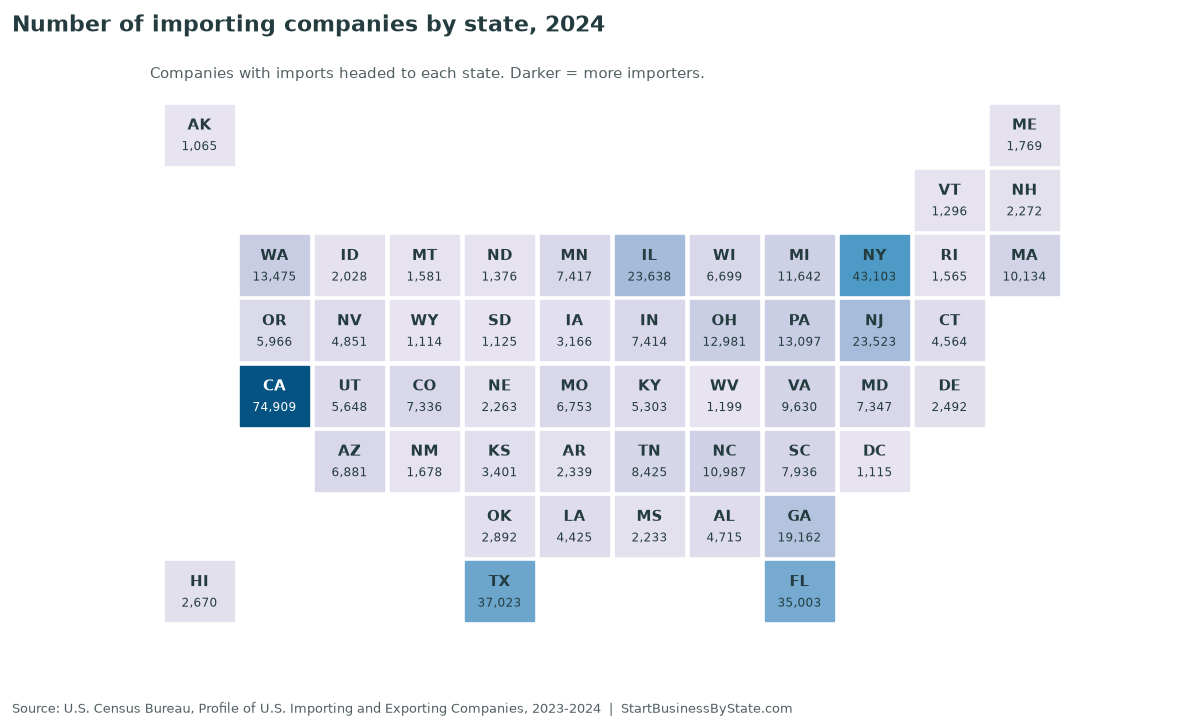
All 50 states and D.C.
Click a column heading to sort. The state is where the goods were headed when they cleared customs. That is not always where they were sold or used.
| State | 2025 imports | From 12.5% tier | From 10% tier (not Canada or Mexico) | From Canada and Mexico | From China | Top source | Importing companies (2024) | Small and midsize share of importers | Small and midsize share of import value |
|---|---|---|---|---|---|---|---|---|---|
| United States | $3,414.5B | 38.3% | 34.2% | 26.8% | 9.0% | Mexico (16%) | 240,535 | 97.3% | 30.2% |
| Alabama | $35.0B | 41.4% | 29.7% | 28.1% | 8.2% | Mexico (19%) | 4,715 | 80.3% | 24.2% |
| Alaska | $3.1B | 50.0% | 8.5% | 41.4% | 1.8% | Canada (41%) | 1,065 | 71.2% | 30.4% |
| Arizona | $57.3B | 22.9% | 47.8% | 29.2% | 4.9% | Taiwan (29%) | 6,881 | 84.2% | 35.4% |
| Arkansas | $6.7B | 31.2% | 37.9% | 30.2% | 12.7% | Canada (16%) | 2,339 | 74.3% | 26.2% |
| California | $488.1B | 52.9% | 30.6% | 15.8% | 15.6% | China (16%) | 74,909 | 95.9% | 37.4% |
| Colorado | $16.4B | 30.3% | 30.7% | 38.7% | 8.1% | Canada (32%) | 7,336 | 86.6% | 49.9% |
| Connecticut | $24.0B | 21.9% | 32.1% | 45.3% | 4.7% | Canada (24%) | 4,564 | 83.3% | 37.2% |
| Delaware | $10.4B | 39.1% | 39.5% | 19.1% | 5.5% | Mexico (10%) | 2,492 | 85.1% | 32.9% |
| District of Columbia | $1.1B | 49.7% | 36.7% | 12.4% | 2.4% | Australia (32%) | 1,115 | 77.8% | 86.0% |
| Florida | $115.9B | 47.7% | 37.9% | 12.9% | 8.1% | China (8%) | 35,003 | 94.9% | 51.0% |
| Georgia | $150.5B | 46.2% | 33.3% | 19.9% | 8.6% | Mexico (16%) | 19,162 | 90.0% | 29.3% |
| Hawaii | $2.7B | 64.8% | 26.5% | 7.5% | 6.5% | Korea, South (23%) | 2,670 | 88.3% | 47.9% |
| Idaho | $7.1B | 26.3% | 54.4% | 18.8% | 3.8% | Malaysia (32%) | 2,028 | 78.8% | 11.3% |
| Illinois | $210.9B | 38.2% | 24.6% | 36.6% | 11.1% | Canada (28%) | 23,638 | 90.5% | 24.8% |
| Indiana | $153.1B | 26.6% | 62.4% | 10.9% | 6.2% | Ireland (42%) | 7,414 | 80.9% | 13.3% |
| Iowa | $12.0B | 22.1% | 27.7% | 50.0% | 9.3% | Canada (27%) | 3,166 | 76.9% | 38.0% |
| Kansas | $13.9B | 36.9% | 37.1% | 25.5% | 8.6% | Canada (14%) | 3,401 | 79.0% | 24.9% |
| Kentucky | $96.9B | 35.6% | 48.3% | 15.9% | 4.8% | Taiwan (11%) | 5,303 | 79.1% | 13.5% |
| Louisiana | $33.6B | 55.6% | 21.8% | 18.7% | 3.2% | Mexico (11%) | 4,425 | 82.4% | 30.6% |
| Maine | $6.0B | 11.2% | 16.1% | 70.2% | 2.4% | Canada (69%) | 1,769 | 77.8% | 22.3% |
| Maryland | $41.4B | 37.6% | 43.6% | 15.6% | 4.9% | Germany (16%) | 7,347 | 86.7% | 25.9% |
| Massachusetts | $42.8B | 31.0% | 35.1% | 33.1% | 6.1% | Canada (23%) | 10,134 | 87.2% | 31.5% |
| Michigan | $167.1B | 16.7% | 10.0% | 73.2% | 4.5% | Mexico (47%) | 11,642 | 86.7% | 14.2% |
| Minnesota | $37.3B | 35.1% | 23.8% | 40.6% | 15.8% | Canada (34%) | 7,417 | 84.3% | 24.1% |
| Mississippi | $23.0B | 40.5% | 38.7% | 19.4% | 9.9% | Mexico (13%) | 2,233 | 72.6% | 16.0% |
| Missouri | $21.8B | 29.8% | 30.3% | 39.7% | 16.4% | Mexico (23%) | 6,753 | 84.0% | 29.6% |
| Montana | $6.3B | 2.5% | 4.9% | 92.5% | 1.0% | Canada (91%) | 1,581 | 80.8% | 24.0% |
| Nebraska | $8.0B | 59.1% | 19.0% | 21.8% | 8.7% | Thailand (37%) | 2,263 | 77.4% | 28.5% |
| Nevada | $36.1B | 34.9% | 57.2% | 7.7% | 10.9% | Taiwan (45%) | 4,851 | 84.5% | 24.9% |
| New Hampshire | $10.1B | 30.5% | 43.7% | 25.5% | 4.3% | Canada (19%) | 2,272 | 78.5% | 22.3% |
| New Jersey | $147.8B | 39.6% | 47.6% | 10.4% | 7.0% | India (8%) | 23,523 | 92.9% | 47.7% |
| New Mexico | $12.2B | 29.3% | 45.5% | 25.2% | 15.1% | Taiwan (34%) | 1,678 | 77.3% | 11.2% |
| New York | $213.9B | 58.1% | 28.6% | 12.0% | 6.2% | Switzerland (27%) | 43,103 | 94.8% | 55.9% |
| North Carolina | $102.0B | 21.9% | 59.0% | 18.5% | 5.3% | Germany (16%) | 10,987 | 86.1% | 21.4% |
| North Dakota | $3.9B | 15.7% | 12.1% | 71.8% | 2.9% | Canada (68%) | 1,376 | 74.6% | 47.3% |
| Ohio | $87.1B | 31.9% | 34.7% | 32.9% | 9.3% | Canada (19%) | 12,981 | 86.0% | 29.2% |
| Oklahoma | $17.1B | 29.5% | 17.4% | 52.7% | 13.6% | Canada (46%) | 2,892 | 77.0% | 34.9% |
| Oregon | $30.8B | 45.8% | 40.0% | 14.0% | 4.7% | Japan (17%) | 5,966 | 85.5% | 26.8% |
| Pennsylvania | $136.2B | 36.6% | 47.9% | 14.4% | 7.3% | Canada (10%) | 13,097 | 86.6% | 21.0% |
| Rhode Island | $11.3B | 34.4% | 39.6% | 25.6% | 4.1% | Costa Rica (18%) | 1,565 | 78.1% | 19.5% |
| South Carolina | $56.1B | 35.8% | 46.6% | 16.5% | 13.3% | China (13%) | 7,936 | 84.8% | 26.1% |
| South Dakota | $1.5B | 38.8% | 19.1% | 41.6% | 15.5% | Canada (36%) | 1,125 | 74.8% | 32.4% |
| Tennessee | $119.5B | 41.5% | 43.3% | 14.9% | 10.9% | China (11%) | 8,425 | 83.5% | 13.4% |
| Texas | $411.2B | 28.4% | 19.8% | 51.4% | 6.7% | Mexico (43%) | 37,023 | 92.9% | 29.8% |
| Utah | $28.6B | 29.1% | 35.1% | 35.7% | 8.4% | Taiwan (21%) | 5,648 | 85.5% | 58.5% |
| Vermont | $4.0B | 10.6% | 13.7% | 75.5% | 3.3% | Canada (70%) | 1,296 | 79.9% | 43.7% |
| Virginia | $43.6B | 35.2% | 42.7% | 20.9% | 10.4% | Mexico (13%) | 9,630 | 86.2% | 27.6% |
| Washington | $55.5B | 49.5% | 19.0% | 31.0% | 11.4% | Canada (29%) | 13,475 | 89.6% | 28.8% |
| West Virginia | $4.9B | 36.4% | 23.0% | 40.5% | 3.7% | Canada (38%) | 1,199 | 70.9% | 28.3% |
| Wisconsin | $36.5B | 32.7% | 37.1% | 29.9% | 14.3% | Canada (16%) | 6,699 | 81.6% | 24.2% |
| Wyoming | $988M | 24.6% | 20.8% | 54.2% | 9.4% | Canada (49%) | 1,114 | 80.6% | 61.5% |
Cite or share this data
Source: StartBusinessByState.com, Tariff refunds and the new tariffs by state (updated October 2, 2026). https://startbusinessbystate.com/tariff-refunds-by-state/
Sources and methods
- Court decision. Learning Resources, Inc. v. Trump, No. 24-1287, decided February 20, 2026.
- Refund process. CBP, IEEPA Duty Refunds page and FAQ, checked October 2, 2026. Phase 3 date and refund totals are from CBP’s September 15, 2026 declaration to the Court of International Trade, as reported by Thompson Hine and C.H. Robinson (September 2026). We did not see the phase 3 date on the CBP page itself when we checked.
- New tariffs. USTR Section 301 actions on 60 economies, Federal Register, July 28, 2026, effective July 24, 2026; CBP guidance CSMS #69326983 on USMCA and other exemptions.
- Imports. U.S. Census Bureau international trade API, state imports by country (general imports, calendar 2025, fetched October 2, 2026). We grouped countries by the tier named in the USTR notice and used Census’s European Union total. We did not remove exempt products, so shares show the most the new tariff could reach.
- Importer counts. U.S. Census Bureau, Profile of U.S. Importing and Exporting Companies, 2023-2024, Table 6d (2024 data). “Small and midsize” means fewer than 500 employees, as Census defines it, including companies with no employment data.
- Not covered. Census does not publish IEEPA duties paid by state, so we cannot show refunds owed by state.
FAQ
Can I get back the tariffs I paid in 2025?
If you paid IEEPA tariffs as the importer of record, you may be able to get them back with interest. You or your customs broker file a CAPE Declaration in CBP’s ACE Portal. CBP says valid refunds usually go out 60 to 90 days after a declaration is accepted. You need an ACE Portal account with bank details on file.
What changes on October 6?
CBP told the Court of International Trade that phase 3 of its refund system opens October 6, 2026. It covers entries that were finally liquidated, but only for importers who sued at the court and whose entries the court ordered CBP to reliquidate. If you did not sue, phase 3 does not apply to you.
I bought imported goods from a supplier. Do I get a refund?
Refunds go to the importer of record, the company named on the customs entry. If your supplier imported the goods and passed the tariff on in its price, the refund goes to the supplier. Whether they share it with you depends on your deal with them.
What tariffs apply now?
Since July 24, 2026, most goods from 60 economies face an extra 10% or 12.5% tariff under Section 301. Some products are exempt, including goods that qualify for duty-free treatment under USMCA and goods already covered by Section 232 tariffs. Other tariffs, such as Section 232 and the older China Section 301 tariffs, are separate.
Does CBP charge a fee for refunds?
No. CBP says it does not charge any fee to process tariff refunds. If someone claiming to be CBP asks for a fee or your bank details by email, CBP says it is a scam.
Can I use this data?
Yes. Please credit StartBusinessByState.com and link to this page. The full table is free to download as a CSV.