Original research · U.S. Census Bureau state import data · BLS establishment counts · Last updated October 7, 2026
Data through: August 2026 imports. Establishments: BLS QCEW 2025 annual average. Refreshed monthly.
Texas, California and Michigan receive the most imported trade goods. From March through August 2026, $83.4 billion of the 65 products we track went to the 50 states and D.C. At each product’s national duty rate, that works out to roughly $10.3 billion in duties. Census does not publish duties by state, so state duty figures here are our estimates. Imports are counted where the goods are headed, which is often a distributor’s warehouse, not the contractor who uses them.
Key findings
- Texas leads with $15.6 billion in imported trade goods. California: $10.0 billion. Michigan: $7.4 billion. Estimated duties: $1.8 billion, $1.4 billion and $749 million. Estimate
- Electrical and trucking goods are the largest categories by value. U.S. totals: electrical $25.4 billion, trucking $23.4 billion, HVAC $11.3 billion, plumbing $8.5 billion.
- Estimated duty rates differ by state because the product mix differs. They range from 9.9% to 17.8%. States that import more from USMCA partners or more low-duty products come out lower.
- Five states take 51.0% of the total. Texas, California, Michigan, Georgia, Illinois. State of destination often reflects where an importer, distributor or factory is located, so some of these goods are resold or used in other states.
The 15 states receiving the most imported trade goods
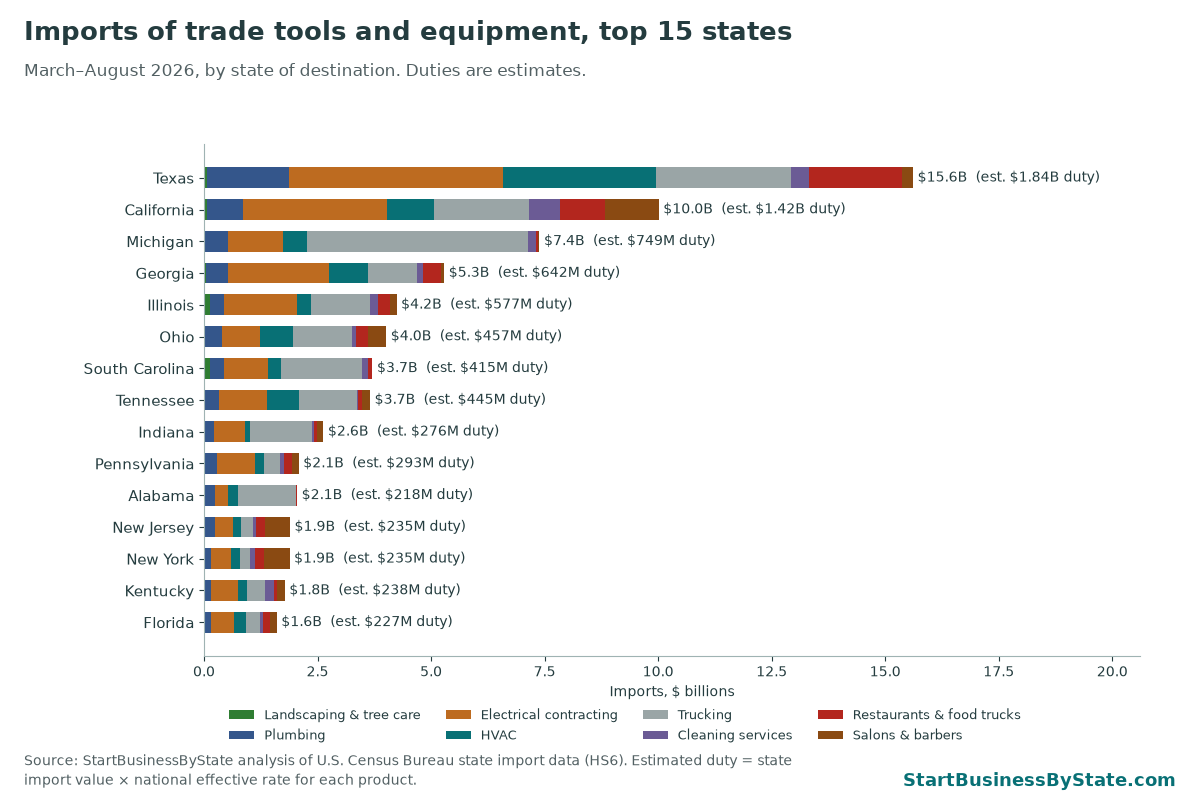
Large states with big ports, distribution hubs or factories lead the list. “State of destination” is where the importer says the goods are going, so a national distributor’s warehouse state can show imports that are later sold across the country.
Imports and estimated duties for every state
Click a column header to sort. Trade columns show import value. The estimated duty and rate columns are modeled.
| Rank | State | Imports, March–August 2026 | Est. duties Estimate | Est. rate | Electrical | Trucking | HVAC | Plumbing | Restaurants & food trucks | Salons | Cleaning | Landscaping |
|---|---|---|---|---|---|---|---|---|---|---|---|---|
| 1 | Texas | $15.6 billion | $1.8 billion | 11.8% | $4.7 billion | $3.0 billion | $3.4 billion | $1.8 billion | $2.0 billion | $245 million | $401 million | $56 million |
| 2 | California | $10.0 billion | $1.4 billion | 14.1% | $3.2 billion | $2.1 billion | $1.0 billion | $791 million | $997 million | $1.2 billion | $689 million | $72 million |
| 3 | Michigan | $7.4 billion | $749 million | 10.1% | $1.2 billion | $4.9 billion | $529 million | $518 million | $50 million | $25 million | $170 million | $6 million |
| 4 | Georgia | $5.3 billion | $642 million | 12.1% | $2.2 billion | $1.1 billion | $858 million | $482 million | $403 million | $74 million | $133 million | $42 million |
| 5 | Illinois | $4.2 billion | $577 million | 13.6% | $1.6 billion | $1.3 billion | $319 million | $328 million | $253 million | $151 million | $183 million | $123 million |
| 6 | Ohio | $4.0 billion | $457 million | 11.4% | $846 million | $1.3 billion | $729 million | $384 million | $261 million | $410 million | $89 million | $9 million |
| 7 | South Carolina | $3.7 billion | $415 million | 11.2% | $970 million | $1.8 billion | $287 million | $305 million | $85 million | $13 million | $127 million | $133 million |
| 8 | Tennessee | $3.7 billion | $445 million | 12.2% | $1.1 billion | $1.3 billion | $697 million | $325 million | $98 million | $170 million | $17 million | $8 million |
| 9 | Indiana | $2.6 billion | $276 million | 10.5% | $677 million | $1.4 billion | $107 million | $224 million | $82 million | $133 million | $46 million | $5 million |
| 10 | Pennsylvania | $2.1 billion | $293 million | 14.1% | $840 million | $351 million | $204 million | $261 million | $175 million | $151 million | $82 million | $21 million |
| 11 | Alabama | $2.1 billion | $218 million | 10.7% | $283 million | $1.3 billion | $228 million | $238 million | $27 million | $1 million | $7 million | $5 million |
| 12 | New Jersey | $1.9 billion | $235 million | 12.4% | $382 million | $261 million | $182 million | $242 million | $208 million | $545 million | $63 million | $9 million |
| 13 | New York | $1.9 billion | $235 million | 12.5% | $457 million | $221 million | $194 million | $123 million | $208 million | $553 million | $107 million | $21 million |
| 14 | Kentucky | $1.8 billion | $238 million | 13.4% | $603 million | $403 million | $201 million | $138 million | $72 million | $173 million | $181 million | $8 million |
| 15 | Florida | $1.6 billion | $227 million | 14.2% | $498 million | $316 million | $273 million | $145 million | $156 million | $144 million | $64 million | $7 million |
| 16 | North Carolina | $1.5 billion | $179 million | 12.1% | $545 million | $382 million | $113 million | $207 million | $116 million | $50 million | $50 million | $23 million |
| 17 | Virginia | $1.3 billion | $173 million | 12.9% | $439 million | $185 million | $282 million | $83 million | $156 million | $24 million | $106 million | $66 million |
| 18 | Arizona | $1.3 billion | $170 million | 12.7% | $701 million | $90 million | $102 million | $164 million | $56 million | $103 million | $122 million | $1 million |
| 19 | Wisconsin | $1.1 billion | $127 million | 11.8% | $321 million | $154 million | $76 million | $301 million | $148 million | $13 million | $35 million | $30 million |
| 20 | Missouri | $1.1 billion | $130 million | 12.3% | $213 million | $268 million | $285 million | $135 million | $86 million | $18 million | $41 million | $7 million |
| 21 | Mississippi | $957 million | $108 million | 11.3% | $216 million | $341 million | $246 million | $63 million | $22 million | $39 million | $7 million | $24 million |
| 22 | Massachusetts | $938 million | $99 million | 10.5% | $695 million | $26 million | $41 million | $102 million | $47 million | $17 million | $6 million | $3 million |
| 23 | Minnesota | $856 million | $124 million | 14.5% | $397 million | $99 million | $50 million | $110 million | $38 million | $23 million | $17 million | $122 million |
| 24 | Washington | $772 million | $110 million | 14.2% | $242 million | $112 million | $90 million | $72 million | $145 million | $46 million | $48 million | $15 million |
| 25 | Connecticut | $700 million | $79 million | 11.3% | $352 million | $36 million | $187 million | $85 million | $11 million | $11 million | $18 million | $2 million |
| 26 | Nevada | $597 million | $92 million | 15.4% | $332 million | $49 million | $67 million | $51 million | $63 million | $20 million | $12 million | $1 million |
| 27 | Maryland | $459 million | $68 million | 14.8% | $92 million | $71 million | $67 million | $28 million | $124 million | $49 million | $22 million | $5 million |
| 28 | Iowa | $454 million | $56 million | 12.3% | $60 million | $116 million | $61 million | $110 million | $72 million | $18 million | $4 million | $14 million |
| 29 | Kansas | $448 million | $76 million | 17.0% | $103 million | $73 million | $84 million | $139 million | $13 million | $4 million | $9 million | $24 million |
| 30 | Oregon | $377 million | $53 million | 14.1% | $144 million | $134 million | $39 million | $32 million | $9 million | $8 million | $5 million | $4 million |
| 31 | Oklahoma | $350 million | $44 million | 12.5% | $184 million | $57 million | $27 million | $63 million | $11 million | $1 million | $5 million | $2 million |
| 32 | Arkansas | $336 million | $44 million | 13.0% | $132 million | $25 million | $43 million | $54 million | $40 million | $11 million | $29 million | $2 million |
| 33 | Utah | $323 million | $52 million | 16.1% | $188 million | $45 million | $8 million | $24 million | $29 million | $11 million | $16 million | $2 million |
| 34 | Colorado | $319 million | $40 million | 12.5% | $147 million | $33 million | $71 million | $17 million | $27 million | $7 million | $14 million | $3 million |
| 35 | Louisiana | $306 million | $32 million | 10.5% | $45 million | $10 million | $7 million | $148 million | $60 million | $2 million | $30 million | $4 million |
| 36 | West Virginia | $212 million | $23 million | 10.6% | $13 million | $90 million | $65 million | $30 million | $11 million | $1 million | $2 million | $0 million |
| 37 | Delaware | $128 million | $14 million | 10.5% | $33 million | $7 million | $7 million | $6 million | $4 million | $63 million | $6 million | $3 million |
| 38 | New Hampshire | $110 million | $20 million | 17.8% | $46 million | $14 million | $11 million | $28 million | $4 million | $2 million | $3 million | $1 million |
| 39 | Rhode Island | $105 million | $15 million | 13.9% | $43 million | $2 million | $17 million | $33 million | $3 million | $3 million | $5 million | $0 million |
| 40 | Nebraska | $102 million | $13 million | 12.4% | $28 million | $41 million | $10 million | $8 million | $7 million | $1 million | $1 million | $6 million |
| 41 | North Dakota | $94 million | $10 million | 10.8% | $38 million | $36 million | $11 million | $4 million | $2 million | $0 million | $1 million | $1 million |
| 42 | New Mexico | $87 million | $14 million | 15.7% | $34 million | $28 million | $17 million | $5 million | $2 million | $1 million | $0 million | $0 million |
| 43 | Idaho | $53 million | $6 million | 11.5% | $20 million | $11 million | $3 million | $9 million | $8 million | $0 million | $1 million | $1 million |
| 44 | Vermont | $50 million | $6 million | 12.1% | $21 million | $19 million | $1 million | $6 million | $2 million | $0 million | $0 million | $0 million |
| 45 | South Dakota | $45 million | $6 million | 12.5% | $10 million | $18 million | $5 million | $3 million | $9 million | $0 million | $0 million | $0 million |
| 46 | Wyoming | $41 million | $4 million | 10.4% | $8 million | $10 million | $5 million | $3 million | $11 million | $2 million | $2 million | $1 million |
| 47 | Maine | $28 million | $3 million | 11.7% | $5 million | $15 million | $2 million | $2 million | $2 million | $0 million | $2 million | $0 million |
| 48 | Montana | $21 million | $3 million | 13.5% | $6 million | $9 million | $1 million | $3 million | $2 million | $0 million | $0 million | $0 million |
| 49 | Alaska | $19 million | $2 million | 12.2% | $7 million | $5 million | $0 million | $6 million | $1 million | $0 million | $0 million | $0 million |
| 50 | Hawaii | $11 million | $2 million | 14.0% | $3 million | $1 million | $2 million | $2 million | $2 million | $1 million | $0 million | $0 million |
| 51 | District of Columbia | $4 million | $0 million | 9.9% | $3 million | $0 million | $0 million | $1 million | $0 million | $0 million | $0 million | $0 million |
U.S. total for the 50 states and D.C.: $83.4 billion in imports, $10.3 billion in estimated duties. Puerto Rico, other territories and unassigned shipments are left out.
Download the data (CSV)Estimated duties per trade business, by state
Estimated duties on each trade’s product basket ÷ that trade’s private establishments in the state (BLS QCEW, 2025 average), for March–August 2026. It’s a measure of scale, not a bill: the duty is paid by the importer, and some of these goods go to manufacturers, retailers or homeowners. Trucking is left out because its parts and trailers mostly go to fleets and dealers. Estimate
| State | Electrical contractors | Plumbing & HVAC contractors | Landscaping | Janitorial | Beauty salons & barbers | Restaurants & mobile food |
|---|---|---|---|---|---|---|
| Alabama | $16,197 | $35,119 | $476 | $676 | $108 | $386 |
| Alaska | $2,648 | $3,567 | $118 | $112 | $306 | $47 |
| Arizona | $39,784 | $9,754 | $78 | $11,299 | $8,567 | $750 |
| Arkansas | $13,892 | $11,856 | $344 | $4,690 | $1,927 | $649 |
| California | $36,377 | $22,125 | $1,206 | $10,577 | $12,089 | $2,825 |
| Colorado | $7,055 | $3,859 | $212 | $1,009 | $317 | $329 |
| Connecticut | $24,030 | $23,154 | $102 | $2,105 | $776 | $179 |
| Delaware | $8,841 | $3,304 | $752 | $1,621 | $17,778 | $176 |
| District of Columbia | $2,326 | $1,193 | $0 | $23 | $54 | $6 |
| Florida | $7,316 | $6,620 | $98 | $632 | $1,607 | $551 |
| Georgia | $71,688 | $54,299 | $1,846 | $5,418 | $2,165 | $2,438 |
| Hawaii | $399 | $1,332 | $50 | $10 | $218 | $76 |
| Idaho | $1,789 | $1,189 | $75 | $112 | $55 | $156 |
| Illinois | $66,399 | $24,821 | $3,963 | $7,036 | $5,077 | $1,724 |
| Indiana | $39,149 | $22,738 | $246 | $2,556 | $6,836 | $1,043 |
| Iowa | $7,159 | $22,540 | $1,801 | $477 | $3,609 | $595 |
| Kansas | $11,941 | $47,469 | $5,295 | $1,392 | $588 | $395 |
| Kentucky | $66,607 | $25,757 | $861 | $23,026 | $21,843 | $1,035 |
| Louisiana | $2,454 | $10,317 | $514 | $2,625 | $265 | $294 |
| Maine | $577 | $534 | $18 | $308 | $49 | $48 |
| Maryland | $6,502 | $8,214 | $426 | $1,436 | $3,603 | $2,307 |
| Massachusetts | $24,762 | $6,127 | $122 | $347 | $615 | $538 |
| Michigan | $53,409 | $50,403 | $311 | $8,883 | $1,293 | $314 |
| Minnesota | $34,728 | $13,193 | $8,789 | $1,174 | $1,610 | $624 |
| Mississippi | $23,255 | $45,729 | $5,193 | $1,250 | $12,526 | $827 |
| Missouri | $13,910 | $24,685 | $510 | $2,623 | $1,200 | $551 |
| Montana | $925 | $666 | $94 | $26 | $54 | $120 |
| Nebraska | $3,451 | $2,553 | $994 | $97 | $175 | $200 |
| Nevada | $59,197 | $16,981 | $209 | $890 | $2,281 | $1,622 |
| New Hampshire | $10,308 | $9,888 | $243 | $452 | $306 | $159 |
| New Jersey | $16,734 | $18,547 | $398 | $2,125 | $12,440 | $2,166 |
| New Mexico | $9,339 | $3,561 | $59 | $15 | $148 | $59 |
| New York | $9,310 | $7,893 | $423 | $1,999 | $6,648 | $886 |
| North Carolina | $14,021 | $11,047 | $803 | $1,868 | $1,848 | $877 |
| North Dakota | $7,987 | $5,464 | $586 | $339 | $3 | $143 |
| Ohio | $34,440 | $48,273 | $392 | $3,677 | $13,673 | $925 |
| Oklahoma | $12,617 | $7,235 | $339 | $872 | $78 | $313 |
| Oregon | $13,915 | $6,574 | $383 | $314 | $987 | $86 |
| Pennsylvania | $36,677 | $17,478 | $645 | $2,219 | $2,705 | $1,438 |
| Rhode Island | $17,838 | $8,344 | $71 | $1,611 | $576 | $117 |
| South Carolina | $68,042 | $48,432 | $12,187 | $9,628 | $1,075 | $1,199 |
| South Dakota | $2,802 | $2,336 | $111 | $74 | $115 | $333 |
| Tennessee | $63,198 | $66,110 | $559 | $1,342 | $14,863 | $1,166 |
| Texas | $66,299 | $75,394 | $1,615 | $5,389 | $3,272 | $2,949 |
| Utah | $22,604 | $2,966 | $181 | $749 | $889 | $664 |
| Vermont | $7,694 | $2,706 | $72 | $132 | $183 | $238 |
| Virginia | $18,087 | $19,102 | $6,597 | $5,277 | $745 | $1,158 |
| Washington | $10,854 | $10,571 | $741 | $2,107 | $2,615 | $2,295 |
| West Virginia | $3,016 | $22,996 | $75 | $280 | $270 | $170 |
| Wisconsin | $23,124 | $19,375 | $1,839 | $2,489 | $1,265 | $1,507 |
| Wyoming | $2,192 | $2,632 | $299 | $550 | $1,802 | $421 |
Which tariffs are in these estimates
Each product’s national rate includes all duties CBP calculated from March 2026 onward: regular duties, Section 232 metals and lumber, Section 301, and the temporary Section 122 surcharge until July 23. For rates by product, see tariff rates by trade.
- Feb 20, 2026. The Supreme Court rules 6–3 in Learning Resources, Inc. v. Trump that IEEPA does not authorize tariffs. Executive Order 14389 ends collection of the IEEPA duties. (91 FR 9437)
- Feb 24, 2026. A temporary 10% import surcharge under Section 122 of the Trade Act of 1974 takes effect for up to 150 days, with listed exceptions. The stated purpose is to address the U.S. balance-of-payments deficit. (91 FR 9339 (Proclamation 11012))
- Apr 6, 2026. Section 232 metals duties are restructured: 50% on steel, aluminum and most copper articles, 25% on listed derivative products, applied to the full customs value. (91 FR 18201 (Proclamation 11021))
- Jun 8, 2026. Section 232 is adjusted again: agricultural equipment and some residential HVAC systems move to a temporary 15% derivative rate through Dec 31, 2027. (91 FR 34085 (Proclamation 11032))
- Jul 24, 2026. USTR Section 301 tariffs replace the Section 122 surcharge: 10% or 12.5% on most goods from 60 economies, tied to forced-labor import rules. Goods covered by Section 232 are exempt, and USMCA-qualifying goods from Canada and Mexico are not covered. (91 FR 47318; presidential memorandum 91 FR 47717)
Still in force alongside these:
- Section 232 steel and aluminum raised to 50% (from 25%) effective June 4, 2025. (FR Doc. 2025-10524)
- July 2026 aluminum changes, including an incentive program for companies building new U.S. primary aluminum capacity. (91 FR 46635 (Proclamation 11045))
- Section 232 softwood lumber and timber, 10% (since Oct 14, 2025); kitchen cabinets and vanities 50% and upholstered furniture 30% since Jan 1, 2026. (90 FR 48127 (Proclamation 10976))
- Section 232 copper, 50% on semi-finished copper and copper-intensive derivatives (since Aug 1, 2025). Refined copper was not covered; the proclamation asked Commerce to report by Jun 30, 2026 on whether a phased 15% (2027) and 30% (2028) duty on refined copper is warranted. (90 FR 37727 (Proclamation 10962))
- Section 301 tariffs on many goods from China, in place since 2018–19 and continued by USTR on Oct 7, 2026. (FR Doc. 2026-20510)
How we did this
- State imports. Census international trade API, timeseries/intltrade/imports/statehs, six-digit HS, GEN_VAL_MO, March–August 2026. Pulled October 7, 2026.
- National rates. Census imports/hs, CAL_DUT_MO ÷ GEN_VAL_MO for each HS6 code over the same months.
- Estimated state duties. For each state and product: state import value × national effective rate. Summed by trade and state.
- Establishments. BLS Quarterly Census of Employment and Wages, 2025 annual averages, private ownership: NAICS 23821 (electrical contractors), 23822 (plumbing and HVAC contractors), 561730, 561720, 812111+812112, 722330+722511+722513.
- Products. The same 65 HS6 codes as our trade tariff rate page.
Caveats
- State duties are estimates. A state that imports more from Canada and Mexico (often duty-free under USMCA) or from China (higher Section 301 rates) will differ from the national rate.
- State of destination is reported by the importer and can reflect a company’s address rather than where goods are used.
- The trucking basket includes general vehicle-part codes (brakes, gearboxes, other parts) that also supply auto assembly plants, which is a big reason Michigan, Ohio, Indiana, Tennessee and other auto states rank high.
- Electrical panels and wire also go to factories, data centers and utilities, so the per-electrician figure overstates what contractors buy.
- Some suppressed or unassigned state values are left out, so state totals are below the national total ($83.7 billion).
Census and BLS data are public domain. This page has no ads or affiliate links. Cite as: StartBusinessByState, “Tariff Exposure for Trade Goods by State,” updated October 7, 2026, https://startbusinessbystate.com/tariff-exposure-trades-by-state/
Related research
- Tariff rates on trade tools and equipment.
- Construction material prices since the tariffs: U.S. vs. world.
- Tariff refunds by state.
- HVAC Section 232 tariff scenarios.
- Small businesses raising prices, by state.
- Canada trade war exposure by state: how much each state sells to Canada, and what changed this year.
FAQ
Which state imports the most trade tools and equipment?
Texas, with $15.6 billion of the products we track from March through August 2026, based on Census Bureau state-of-destination import data.
Does Census publish tariffs paid by state?
No. Census publishes import values by state but not duties. We estimate each state’s duties by applying the national effective rate for each six-digit product to that state’s imports of it. The real figure can be higher or lower if a state’s imports come from countries with different tariff rates.
Does this mean small businesses in my state paid these duties?
Not directly. The importer of record pays the duty, usually a manufacturer, distributor or retailer. Some or all of it may be passed on in prices, but this page measures imports and estimated duties, not what local businesses paid.
What does the per-establishment figure mean?
It divides the estimated duties on a trade’s product basket in a state by the number of private establishments in that trade (BLS QCEW, 2025 average). It shows the scale of tariff costs relative to the size of the local industry. It is not an average bill.
Why are plumbing and HVAC combined per establishment?
Both trades are counted under the same industry code (NAICS 238220, plumbing, heating and air-conditioning contractors), so we combine their product baskets for the per-establishment figure.
How often is this updated?
Monthly, after Census releases state import data, about five weeks after the month ends. Establishment counts update once a year.
Last updated October 7, 2026. Import data through August 2026.