Original research · U.S. Census Bureau Business Trends and Outlook Survey + BLS price indexes · Last updated October 6, 2026
Data through: Census survey period 202619, covering Aug 24, 2026 to Sep 6, 2026, published September 24, 2026. Next Census release: October 8, 2026. Refreshed every two weeks.
About 45 in 100 businesses are paying more, and about 17 in 100 are charging more. That gap, 28.1 percentage points, is the squeeze. The Census Bureau asks thousands of businesses every two weeks how their costs and prices are moving. In the latest survey, Nebraska had the highest share paying more (55.1%) and the District of Columbia the lowest (31.6%). Looking ahead, 58.1% of businesses expect their costs to keep rising over the next six months.
Key findings
- 44.9% of businesses paid higher prices in the two weeks of Aug 24, 2026 to Sep 6, 2026, up from 40.1% in the prior survey and 41.7% a year earlier. The high since the survey began in 2023 is 49.8% (Apr 20, 2026 to May 3, 2026).
- For every business that raised prices, about 2.7 saw their own costs rise. 16.8% raised the prices they charge, against 44.9% paying more.
- Nebraska (55.1%), Hawaii (54.9%) and New Hampshire (53.5%) lead the states. 7 states are at 50% or higher. The District of Columbia is lowest at 31.6%.
- 58.1% expect their costs to rise over the next six months, close to the survey high of 58.3%. The top states are Vermont (72.4%), Wisconsin (69.8%) and Connecticut (68.4%).
- 35.9% plan to raise their own prices within six months, up from 34.1% in the prior survey.
- Fuel and freight are driving it. The BLS producer price index for truckload trucking (PCU484121484121) is up 13.9% from a year earlier as of August 2026. Wholesale diesel (WPU057303) is up 77.8%. Consumer prices overall (CUUR0000SA0) are up 3.4%.
Costs are rising faster than prices
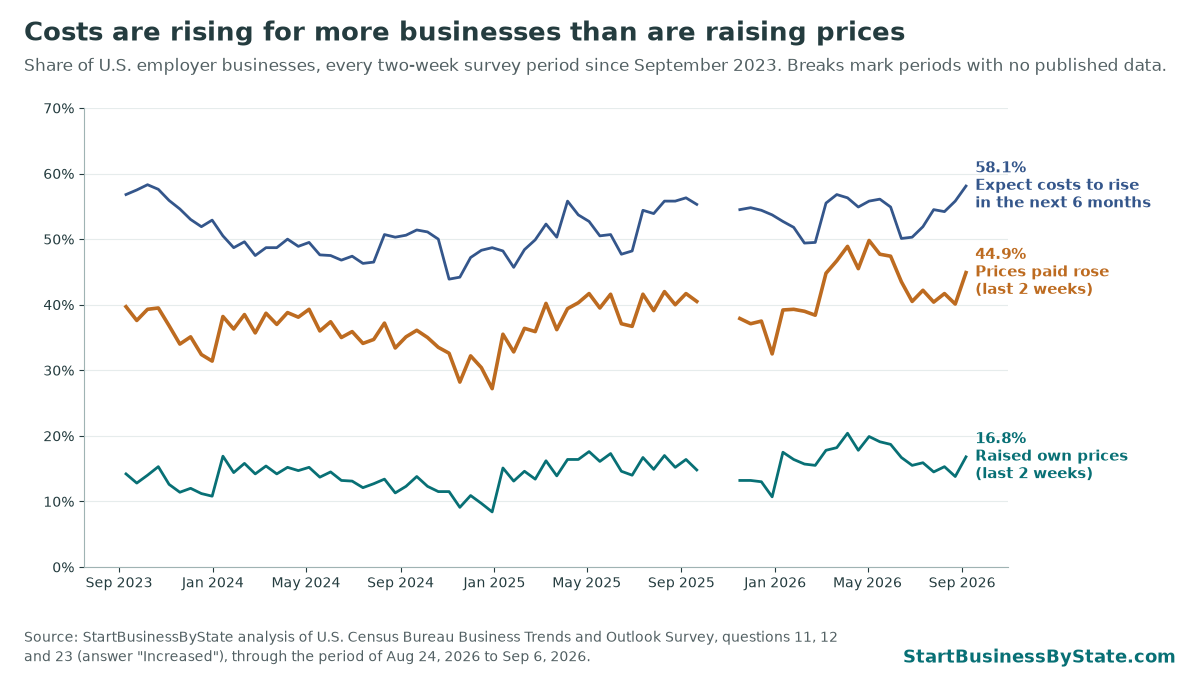
The share of businesses paying more fell to a low of 27.2% in the period of Dec 16, 2024 to Dec 29, 2024. It has climbed since, peaking at 49.8% in the period of Apr 20, 2026 to May 3, 2026 after oil and diesel prices jumped in the spring. The share raising their own prices has stayed far lower the whole time. That gap is money coming out of owners’ margins.
Businesses paying higher prices, every state
Click a column header to sort. “±” is the 90% margin of error. “S” means Census suppressed the number because it wasn’t reliable enough to publish. The cost gap is the share paying more minus the share charging more.
| State | Paying higher prices | Change since last survey | Raised own prices | Cost gap | Expect costs to rise (6 mo.) | Plan to raise prices (6 mo.) | Supplier deliveries slower |
|---|---|---|---|---|---|---|---|
| United States | 44.9% ±0.6 | +4.8 pts | 16.8% ±0.5 | +28.1 pts | 58.1% | 35.9% | 8.4% |
| Nebraska | 55.1% ±7.6 | +5.2 pts | 25.2% ±4.1 | +29.9 pts | 64.2% | 44.7% | 10.4% |
| Hawaii | 54.9% ±14.0 | +13.7 pts | 18.9% ±5.8 | +36.0 pts | 68.1% | 38.4% | 12.7% |
| New Hampshire | 53.5% ±6.9 | +8.8 pts | 25.7% ±6.3 | +27.8 pts | 65.6% | 47.4% | 10.4% |
| Vermont | 50.7% ±14.9 | +10.0 pts | 20.7% ±7.6 | +30.0 pts | 72.4% | 47.9% | 12.0% |
| Oregon | 50.2% ±4.9 | +4.6 pts | 13.8% ±2.5 | +36.4 pts | 63.1% | 38.0% | 12.5% |
| Minnesota | 50.1% ±5.8 | +12.7 pts | 19.5% ±4.1 | +30.6 pts | 64.2% | 38.1% | 8.9% |
| Pennsylvania | 50.0% ±3.2 | +10.2 pts | 19.8% ±2.5 | +30.2 pts | 61.2% | 43.6% | 8.1% |
| South Dakota | 49.6% ±11.9 | +4.6 pts | 22.5% ±9.0 | +27.1 pts | 58.6% | 36.2% | 15.3% |
| Wisconsin | 49.1% ±2.1 | +9.8 pts | 18.6% ±4.1 | +30.5 pts | 69.8% | 50.1% | 11.2% |
| Arkansas | 48.4% ±8.0 | +7.1 pts | 22.3% ±7.5 | +26.1 pts | 61.2% | 36.8% | 7.2% |
| Connecticut | 48.4% ±7.8 | +5.0 pts | 21.0% ±3.9 | +27.4 pts | 68.4% | 46.0% | 9.7% |
| Tennessee | 48.3% ±5.6 | +6.4 pts | 18.8% ±5.5 | +29.5 pts | 57.2% | 36.9% | 15.3% |
| Washington | 48.1% ±3.2 | +8.5 pts | 15.1% ±3.5 | +33.0 pts | 64.4% | 39.2% | 6.7% |
| Texas | 48.0% ±1.9 | +6.0 pts | 17.0% ±1.6 | +31.0 pts | 59.0% | 34.9% | 9.0% |
| New Mexico | 47.6% ±8.5 | −5.0 pts | 13.9% ±5.1 | +33.7 pts | 62.6% | 31.7% | 10.6% |
| North Dakota | 47.2% ±5.8 | +14.2 pts | 20.7% ±7.2 | +26.5 pts | 50.2% | 34.3% | S |
| Missouri | 47.1% ±4.8 | +9.8 pts | 18.3% ±3.5 | +28.8 pts | 60.1% | 39.5% | 7.6% |
| Delaware | 47.0% ±11.0 | +14.3 pts | 14.8% ±6.0 | +32.2 pts | 56.7% | 37.9% | S |
| Montana | 47.0% ±8.7 | +0.9 pts | 15.3% ±8.4 | +31.7 pts | 64.2% | 38.5% | 13.1% |
| Rhode Island | 47.0% ±11.7 | +14.1 pts | 22.8% ±8.5 | +24.2 pts | 60.7% | 44.3% | S |
| Michigan | 46.9% ±3.8 | +7.4 pts | 16.6% ±3.7 | +30.3 pts | 64.1% | 42.6% | 7.9% |
| Iowa | 46.9% ±4.1 | +0.5 pts | 14.4% ±6.0 | +32.5 pts | 64.1% | 41.1% | 6.5% |
| Kentucky | 46.9% ±7.7 | +7.3 pts | 19.6% ±3.8 | +27.3 pts | 59.8% | 38.1% | 7.0% |
| Idaho | 46.4% ±5.4 | +10.9 pts | 15.3% ±4.6 | +31.1 pts | 56.8% | 36.0% | 7.2% |
| Florida | 45.8% ±2.4 | +4.0 pts | 18.2% ±2.0 | +27.6 pts | 55.5% | 34.1% | 7.4% |
| North Carolina | 45.7% ±3.5 | +7.7 pts | 17.7% ±2.7 | +28.0 pts | 57.0% | 37.7% | 10.3% |
| Georgia | 45.6% ±3.0 | +5.4 pts | 16.3% ±2.5 | +29.3 pts | 56.6% | 32.6% | 9.4% |
| California | 44.9% ±1.5 | +5.0 pts | 16.1% ±1.0 | +28.8 pts | 55.3% | 32.5% | 7.9% |
| Kansas | 44.8% ±5.8 | +0.3 pts | 17.9% ±5.7 | +26.9 pts | 65.3% | 38.9% | 13.5% |
| Massachusetts | 44.5% ±3.7 | +5.6 pts | 17.9% ±2.8 | +26.6 pts | 62.2% | 35.2% | 7.6% |
| West Virginia | 44.4% ±8.2 | +5.1 pts | 16.3% ±7.4 | +28.1 pts | 56.1% | 32.6% | S |
| Ohio | 44.2% ±4.1 | −0.5 pts | 18.7% ±2.0 | +25.5 pts | 60.7% | 43.0% | 8.6% |
| Indiana | 44.1% ±5.9 | +4.8 pts | 14.1% ±3.4 | +30.0 pts | 61.2% | 40.5% | 10.6% |
| Illinois | 43.7% ±2.3 | +2.7 pts | 16.4% ±2.2 | +27.3 pts | 57.0% | 33.6% | 9.1% |
| Arizona | 43.6% ±4.3 | +3.0 pts | 14.3% ±2.4 | +29.3 pts | 55.3% | 32.5% | 7.8% |
| New Jersey | 42.9% ±3.6 | +4.8 pts | 19.5% ±2.5 | +23.4 pts | 52.7% | 33.4% | 7.9% |
| Maine | 42.8% ±9.2 | −5.7 pts | 14.5% ±6.9 | +28.3 pts | 64.9% | 38.9% | 12.7% |
| Maryland | 42.7% ±4.3 | −0.3 pts | 17.5% ±3.7 | +25.2 pts | 55.7% | 36.3% | 9.4% |
| Mississippi | 42.7% ±4.8 | +12.2 pts | 17.5% ±5.6 | +25.2 pts | 54.9% | 37.7% | 7.6% |
| Oklahoma | 42.5% ±5.6 | +1.0 pts | 17.8% ±3.2 | +24.7 pts | 59.3% | 31.6% | 8.5% |
| Utah | 42.2% ±6.5 | +2.9 pts | 11.9% ±4.0 | +30.3 pts | 63.1% | 36.0% | 8.2% |
| Colorado | 41.6% ±3.7 | −1.4 pts | 14.1% ±2.0 | +27.5 pts | 59.3% | 33.1% | 10.2% |
| Virginia | 41.2% ±3.8 | +4.5 pts | 16.8% ±2.6 | +24.4 pts | 58.2% | 37.2% | 7.4% |
| Wyoming | 41.1% ±7.7 | +2.6 pts | 11.9% ±7.6 | +29.2 pts | 57.0% | 36.6% | 11.6% |
| Nevada | 41.0% ±5.2 | +1.6 pts | 14.2% ±3.9 | +26.8 pts | 53.3% | 31.0% | 6.0% |
| Louisiana | 40.6% ±5.3 | +5.4 pts | 11.7% ±4.5 | +28.9 pts | 54.5% | 30.7% | 6.3% |
| Alabama | 39.9% ±5.9 | −2.7 pts | 17.7% ±3.5 | +22.2 pts | 56.6% | 39.6% | 8.6% |
| Alaska | 37.7% ±9.1 | −13.2 pts | 19.7% ±4.9 | +18.0 pts | 54.5% | 35.9% | S |
| New York | 37.2% ±2.0 | +1.6 pts | 13.8% ±2.2 | +23.4 pts | 50.4% | 29.5% | 5.7% |
| South Carolina | 37.1% ±4.8 | −1.3 pts | 16.6% ±2.6 | +20.5 pts | 51.7% | 35.5% | 7.5% |
| District of Columbia | 31.6% ±12.6 | +1.5 pts | S | S | 58.5% | 32.1% | S |
Census BTOS period 202619 (Aug 24, 2026 to Sep 6, 2026). Answer “Increased” to questions 12 (prices paid), 11 (prices charged), 23 and 22 (expected in six months) and 8 (supplier delivery time). Change is in percentage points against period 202618.
Download the data (CSV)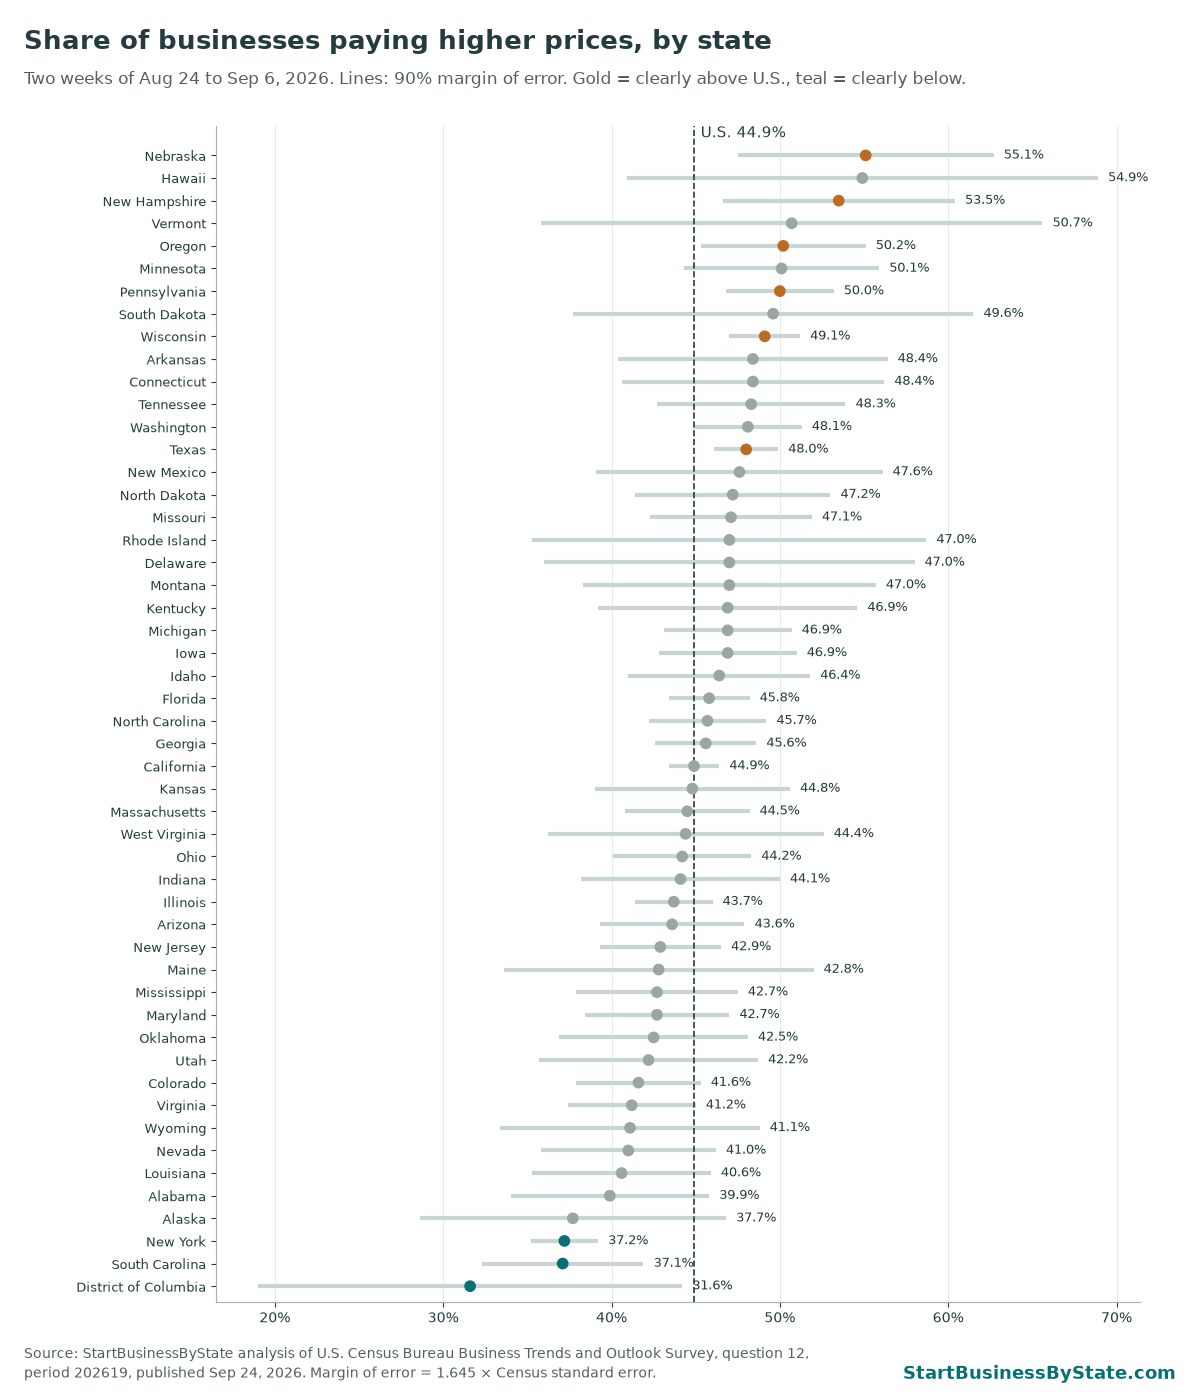
Six states are clearly above the national rate once the margin of error is counted: Nebraska, New Hampshire, Oregon, Pennsylvania, Wisconsin and Texas. The District of Columbia, South Carolina and New York are clearly below it. Most states sit within a few points of the U.S. figure. Treat small differences between neighbors as a tie.
By industry
| Industry (NAICS sector) | Paying higher prices | Raised own prices | Expect costs to rise (6 mo.) |
|---|---|---|---|
| Forestry, fishing and farm support | 64.5% ±11.1 | 14.5% | 60.3% |
| Construction | 52.9% ±1.3 | 24.4% | 65.8% |
| Transportation and warehousing | 52.9% ±2.8 | 21.8% | 54.9% |
| Retail trade | 50.2% ±1.6 | 28.0% | 61.7% |
| Accommodation and food services | 49.2% ±1.7 | 17.9% | 61.8% |
| Other services (repair, personal care) | 45.6% ±2.6 | 17.6% | 60.1% |
| Administrative and support (includes cleaning and landscaping) | 44.6% ±3.8 | 15.1% | 57.3% |
| Professional services | 40.5% ±1.0 | 12.8% | 55.9% |
| Health care and social assistance (includes child care) | 40.1% ±2.1 | 7.7% | 55.6% |
Forestry, fishing and farm support (64.5%) and Construction (52.9%) have the largest shares paying more. Sector numbers are national, from the same Census survey period.
What rising costs mean for your business
If you’re starting a business now, you’re pricing into a market where costs move every few weeks. Here’s what helps.
- Know your three biggest costs and check them monthly. For most service businesses that’s labor, fuel and materials. When one moves 10%, rerun your prices. Don’t wait for the end of the year.
- Put an escalation line in contracts longer than 90 days. Commercial cleaning, lawn care and HVAC maintenance contracts often run a year. A clause that lets you adjust for fuel or materials keeps one bad quarter from wiping out the job. See how to price a commercial cleaning contract and HVAC maintenance agreement pricing.
- Fuel surcharges are fine if you disclose them up front. Several states now restrict surprise add-on fees. Check our junk fee laws by state before adding a surcharge to an invoice.
- Raise prices in small, explained steps. Customers take a 5% increase with a one-line reason better than a 15% jump with none. Landscapers can use the landscaping job pricing calculator; food trucks can test menu prices in the event profit calculator.
- Trucking and delivery. Diesel is the cost driving much of this. See the diesel shock bill by state and the trucking squeeze report.
Other cost pressures we track: business electricity prices, credit card swipe fees by state, interest rates and tariffs. For imported tools and equipment, see tariff exposure by state.
How we did this
- Survey data. U.S. Census Bureau, Business Trends and Outlook Survey (BTOS), State.xlsx, National.xlsx and Sector.xlsx from census.gov/hfp/btos/downloads/, sheets “Response Estimates” and “Response Standard Errors.” Period 202619: reference period Aug 24, 2026 to Sep 6, 2026, published September 24, 2026. Questions: 12 (prices paid), 11 (prices charged), 23 (expected prices paid in six months), 22 (expected prices charged in six months), 8 (supplier delivery time). We use the share answering “Increased.”
- Margins of error. 1.645 × the Census standard error (90% confidence). A state is “clearly above” the U.S. rate only if its estimate minus its margin is still above the national estimate.
- Price indexes. BLS API: CPI-U all items (CUUR0000SA0) and food away from home (CUUR0000SEFV), PPI general freight trucking, long-distance truckload (PCU484121484121), PPI No. 2 diesel fuel (WPU057303). Latest month vs. the same month a year earlier: CUUR0000SA0 August 2026 +3.4%, CUUR0000SEFV August 2026 +3.4%, PCU484121484121 August 2026 +13.9%, WPU057303 August 2026 +77.8%.
Caveats
- BTOS covers nonfarm employer businesses. Self-employed people with no staff aren’t in it.
- The questions ask whether prices went up, not by how much. A business with a 1% rise and one with a 30% rise both count once.
- Each business counts once regardless of size, so the results lean toward small firms.
- Census suppresses some state and sector figures. These show as “S.”
- Census published no data for reference periods between Sep 21, 2025 and Nov 16, 2025, so the trend chart has a break there.
Census and BLS data are public domain. This page has no ads or affiliate links. Cite as: StartBusinessByState, “Small Businesses Paying Higher Prices, by State,” updated October 6, 2026, https://startbusinessbystate.com/small-businesses-raising-prices-by-state/
Related research
- The diesel shock bill by state: the fuel cost behind much of the rise.
- Diesel and gas prices by state: this week’s EIA prices.
- Fuel tax holidays and dyed-diesel waivers by state.
- Small business AI use by state: another view of the same Census survey.
- Business bankruptcy filings by state.
- Businesses hurt by interest rates, by state: the same Census survey on how rate changes hit owners.
- restaurant menu price inflation: menu prices vs. overall inflation since 2019.
- Small Business Saturday by state: small retail stores per 10,000 residents in every state.
FAQ
What share of small businesses are paying higher prices right now?
44.9% of U.S. employer businesses said the prices they pay for goods or services went up in the two weeks of Aug 24, 2026 to Sep 6, 2026, according to the Census Bureau’s Business Trends and Outlook Survey published Sep 24, 2026. 16.8% raised the prices they charge.
Which state has the most businesses facing rising costs?
Nebraska, where 55.1% of businesses reported paying more (margin of error ±7.6 points). the District of Columbia had the lowest share at 31.6%.
Are businesses passing costs on to customers?
Some are. 16.8% raised prices in the latest two weeks, and 35.9% expect to raise them within six months. Many more are absorbing costs for now, which squeezes profit.
Is this survey only small businesses?
The Census survey covers employer businesses of every size, and each business counts once no matter how big it is. Since most employer businesses are small, the results mostly reflect small firms.
How accurate are the state numbers?
Each state estimate has a margin of error, shown in the table as ± points at 90% confidence. Small states have wider margins. A change of a few points from one survey to the next may be noise. Census marks some estimates “S” when they are not reliable enough to publish.
How often is this updated?
Every two weeks, after each Census release. The next release is scheduled for Oct 8, 2026.
Last updated October 6, 2026. Census survey period 202619 (Aug 24, 2026 to Sep 6, 2026). Next Census release: October 8, 2026.