Original research · U.S. Census Bureau Business Trends and Outlook Survey (BTOS) · Latest survey covers Aug 24–Sep 6, 2026 (released Sep 24, 2026) · Updated September 28, 2026
Nearly 1 in 4 U.S. businesses now use AI. In the latest Census survey, 23.8% of businesses said they used AI in the past two weeks. At the start of 2026 it was 17.7%. That is about a third more businesses than at the start of the year. Use is highest in D.C. (33.9%) and lowest in West Virginia (13.9%). Construction use nearly doubled, from 8.3% to 15.4%.
Key findings
- 23.8% of U.S. businesses used AI in the last two weeks. That is up from 17.7% in the first survey of 2026 and 17.3% when Census first asked this question in November 2025.
- D.C., Utah, Colorado and Florida sit near the top. They rank high in the latest survey and in the average of the last three surveys. Latest rates: D.C. 33.9%, Colorado 30.2%, Utah 28.8%, Florida 28.2%.
- West Virginia (13.9%), Alaska (15.0%) and Maine (16.7%) are lowest. They are the only states below 17%.
- Use went up in 47 of the 49 places we could compare. In 27 of them, the rise is bigger than the survey’s margin of error. Only Maine and West Virginia slipped, and neither drop is outside the margin.
- Construction use nearly doubled this year. It went from 8.3% to 15.4%. Specialty trade contractors (electricians, plumbers, HVAC and roofing firms) went from 6.1% to 14.3%, more than double. They still trail the national rate.
- More are on the way. 27.6% of businesses expect to use AI in the next six months. Colorado (35.1%) and D.C. (35.0%) lead.
Map: AI use by state
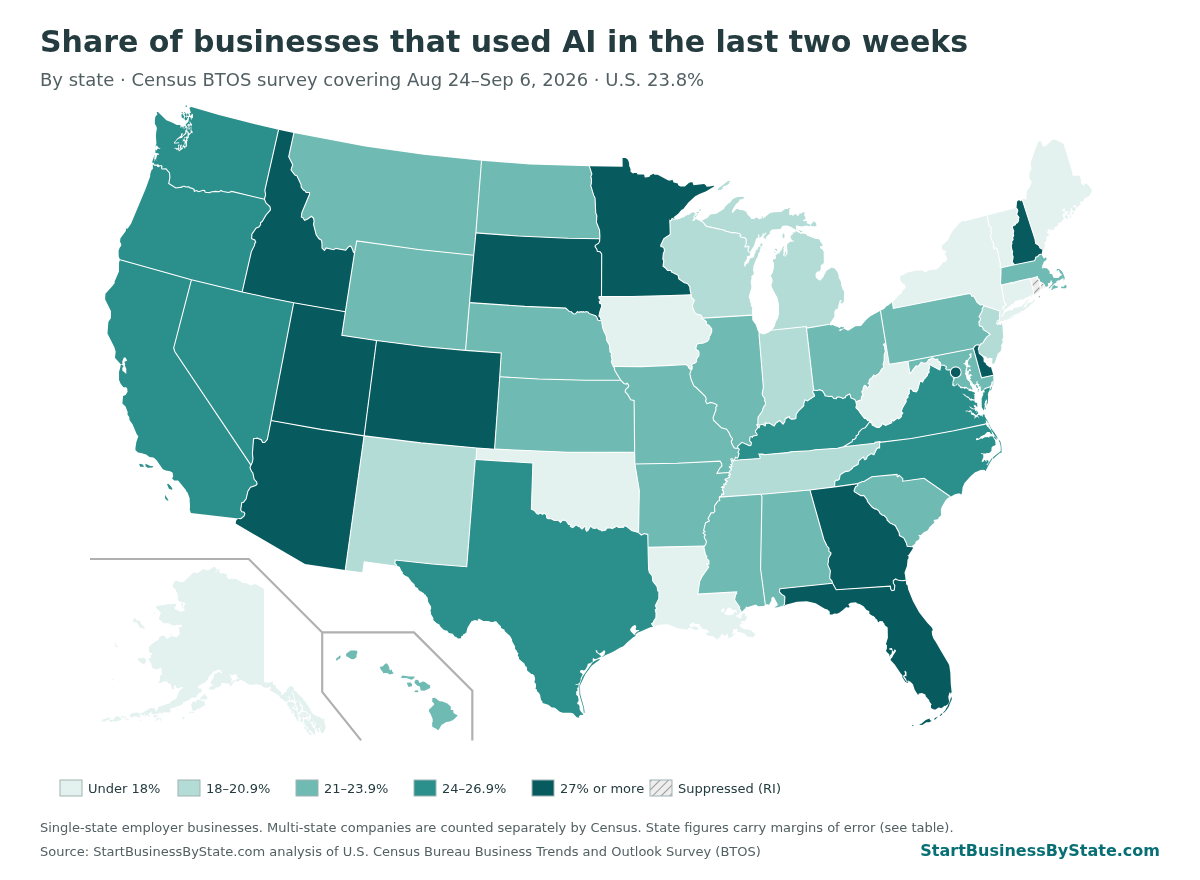
State numbers come from smaller samples than the national number, so they move around. Colorado’s margin of error is about ±2.2 points. D.C.’s is about ±9.3. New Hampshire jumped to 30.5% this round, but its three-survey average is 20.8%. That is why the table shows both.
The national trend

The rise has been fairly steady. There was a dip in early February. Since then it has gone up in most surveys. The national number has a small margin of error (about ±0.4 points), so the rise is real, not noise.
One more thing: big companies that operate in more than one state are counted separately by Census. 40.4% of them used AI in the latest survey, up from 31.0%. They are left out of the state numbers, so the state map mostly reflects local, single-state businesses.
Which industries use AI

Office-type work leads. Nearly half of information businesses (49.0%) use AI. So do 43.9% of professional services firms. Hands-on businesses use it less, but their use is growing quickly. Construction’s share nearly doubled this year. For every industry and subsector, including trade contractors, repair shops and cleaning and landscaping firms, see our small-business AI use by industry study.
| Industry | Latest (Aug 24–Sep 6) | First 2026 survey | Change (pts) | Expect to use in next 6 months | Our guides |
|---|---|---|---|---|---|
| Information | 49.0% | 37.7% | +11.3 | 52.1% | |
| Professional, scientific & technical services | 43.9% | 34.1% | +9.8 | 48.5% | |
| Finance & insurance | 41.0% | 30.7% | +10.3 | 45.9% | |
| Educational services | 30.0% | 28.9% | +1.1 | 33.8% | |
| Real estate & rental | 29.6% | 23.4% | +6.2 | 35.2% | |
| Health care & social assistance (incl. child care) | 25.5% | 21.0% | +4.5 | 30.8% | daycare |
| Arts, entertainment & recreation | 22.6% | 19.0% | +3.6 | 25.6% | |
| Admin, support & waste services (incl. cleaning, landscaping) | 20.8% | 16.0% | +4.8 | 24.2% | cleaning, landscaping |
| Manufacturing | 19.5% | 11.7% | +7.8 | 24.0% | |
| Wholesale trade | 19.2% | 13.9% | +5.3 | 24.7% | |
| Retail trade | 16.5% | 12.6% | +3.9 | 19.6% | |
| Construction | 15.4% | 8.3% | +7.1 | 17.7% | trade labor by state |
| Other services (repair, salons, personal care) | 15.0% | 9.4% | +5.6 | 16.7% | salons, repair shops |
| Transportation & warehousing | 13.0% | 8.6% | +4.4 | 16.3% | |
| Utilities | 11.8% | — | — | 14.2% | |
| Accommodation & food services | 10.1% | 7.5% | +2.6 | 14.3% | food trucks |
| Mining, oil & gas | 8.0% | 10.0% | -2.0 | 8.2% | |
| Agriculture, forestry, fishing (excl. farms) | 6.2% | — | — | 8.6% |
A closer look at trades and service businesses
| Business type (Census subsector) | Latest | First 2026 survey | Change (pts) |
|---|---|---|---|
| Building construction | 17.4% | 12.1% | +5.3 |
| Specialty trade contractors (electrical, plumbing, HVAC, roofing, etc.) | 14.3% | 6.1% | +8.2 |
| Administrative & support services (incl. janitorial, landscaping services) | 21.3% | 16.9% | +4.4 |
| Repair & maintenance | 13.3% | 8.3% | +5.0 |
| Personal & laundry services (incl. salons) | 16.9% | 10.6% | +6.3 |
| Food services & drinking places (incl. food trucks) | 10.7% | 7.6% | +3.1 |
| Social assistance (incl. child day care) | 28.0% | 21.7% | +6.3 |
| Professional, scientific & technical services | 43.9% | 34.1% | +9.8 |
If you run a trade business, the big jump is the story. Specialty trade contractors went from about 1 in 16 using AI to about 1 in 7 in eight months. If you are starting an HVAC business or a landscaping business, expect more of your competitors to try it. About 1 in 7 trade contractors already does. For how much trade work there is in each state, see our trade labor density by state study and our HVAC industry statistics.
Wondering what AI means for jobs in the trades? We also track job postings for trades vs. tech jobs since ChatGPT came out.
The survey asks whether a business used AI. It does not ask what for, or whether AI changed jobs or hiring. We do not read more into it than that.
AI use in every state
Click a column heading to sort. State names link to our state guides for starting a business. ✓ means the change since the start of 2026 is bigger than the margin of error.
| Rank | State | Used AI, last 2 weeks (Aug 24–Sep 6) | Margin of error (90%) | First 2026 survey (Dec 15–28, 2025) | Change (pts) | Average of last 3 surveys | Separate question: expect to use AI in next 6 months |
|---|---|---|---|---|---|---|---|
| United States | 23.8% | ±0.4 | 17.7% | +6.1 | — | 27.6% | |
| 1 | District of Columbia | 33.9% | ±9.3 | 24.4% | +9.5 | 30.7% | 35.0% |
| 2 | New Hampshire | 30.5% | ±7.5 | 12.9% | +17.6 ✓ | 20.8% | 28.9% |
| 3 | Colorado | 30.2% | ±2.2 | 23.6% | +6.6 ✓ | 28.1% | 35.1% |
| 4 | Utah | 28.8% | ±4.7 | 15.2% | +13.6 ✓ | 30.9% | 33.1% |
| 5 | Minnesota | 28.7% | ±4.6 | 22.9% | +5.8 ✓ | 24.9% | 32.7% |
| 6 | Arizona | 28.3% | ±3.1 | 24.3% | +4.0 | 25.8% | 31.9% |
| 7 | Florida | 28.2% | ±2.0 | 20.0% | +8.2 ✓ | 27.4% | 32.4% |
| 8 | Idaho | 28.0% | ±7.3 | 19.5% | +8.5 ✓ | 26.2% | 29.9% |
| 9 | Georgia | 27.2% | ±4.3 | 15.5% | +11.7 ✓ | 26.4% | 31.1% |
| 9 | South Dakota | 27.2% | ±9.3 | 15.5% | +11.7 ✓ | 21.4% | 33.6% |
| 11 | Delaware | 27.1% | ±6.3 | 15.6% | +11.5 ✓ | 29.4% | 33.9% |
| 12 | Oregon | 26.4% | ±2.2 | 21.1% | +5.3 ✓ | 24.4% | 28.9% |
| 13 | California | 26.3% | ±1.4 | 19.1% | +7.2 ✓ | 25.0% | 30.4% |
| 13 | Nevada | 26.3% | ±4.5 | 20.6% | +5.7 | 26.0% | 32.7% |
| 15 | Washington | 26.2% | ±3.3 | 21.4% | +4.8 ✓ | 26.9% | 31.7% |
| 16 | North Carolina | 25.6% | ±1.6 | 17.6% | +8.0 ✓ | 24.5% | 27.6% |
| 17 | Virginia | 25.1% | ±2.8 | 13.5% | +11.6 ✓ | 25.1% | 29.8% |
| 18 | Kentucky | 24.1% | ±5.4 | 17.8% | +6.3 | 22.9% | 27.7% |
| 19 | Texas | 24.0% | ±2.2 | 19.0% | +5.0 ✓ | 25.0% | 28.0% |
| 20 | Nebraska | 23.9% | ±5.6 | 14.6% | +9.3 ✓ | 21.9% | 26.0% |
| 21 | Hawaii | 23.4% | ±7.1 | 10.3% | +13.1 ✓ | 22.3% | 21.8% |
| 21 | Maryland | 23.4% | ±3.6 | 19.2% | +4.2 | 23.4% | 29.5% |
| 23 | Alabama | 23.3% | ±4.3 | 15.5% | +7.8 | 18.0% | 26.3% |
| 23 | North Dakota | 23.3% | ±8.7 | 10.5% | +12.8 ✓ | — | 23.2% |
| 23 | South Carolina | 23.3% | ±3.5 | 12.0% | +11.3 ✓ | 24.4% | 26.4% |
| 26 | Pennsylvania | 23.1% | ±3.5 | 15.0% | +8.1 ✓ | 20.9% | 26.2% |
| 27 | Massachusetts | 22.2% | ±4.0 | 22.1% | +0.1 | 22.4% | 25.0% |
| 28 | Illinois | 22.0% | ±2.3 | 16.8% | +5.2 ✓ | 20.9% | 27.7% |
| 28 | Montana | 22.0% | ±8.8 | 17.2% | +4.8 | 21.5% | 27.1% |
| 30 | Missouri | 21.7% | ±3.7 | 19.6% | +2.1 | 21.0% | 25.9% |
| 31 | Kansas | 21.5% | ±4.9 | 12.5% | +9.0 ✓ | 20.2% | 25.4% |
| 32 | Ohio | 21.4% | ±2.5 | 16.3% | +5.1 ✓ | 20.9% | 25.9% |
| 33 | Arkansas | 21.3% | ±3.9 | 10.3% | +11.0 ✓ | 20.8% | 22.8% |
| 34 | Mississippi | 21.2% | ±3.6 | 19.4% | +1.8 | 16.5% | 22.8% |
| 35 | Wyoming | 21.1% | ±8.5 | 19.1% | +2.0 | 22.2% | 20.4% |
| 36 | Tennessee | 20.3% | ±3.0 | 13.4% | +6.9 ✓ | 21.5% | 26.2% |
| 37 | Michigan | 20.0% | ±3.0 | 16.1% | +3.9 | 21.8% | 24.4% |
| 38 | New Mexico | 19.7% | ±3.9 | 17.7% | +2.0 | 19.3% | 19.3% |
| 39 | Indiana | 19.4% | ±3.2 | 19.3% | +0.1 | 18.6% | 24.3% |
| 40 | New Jersey | 18.5% | ±2.1 | 14.0% | +4.5 ✓ | 17.5% | 23.4% |
| 41 | Wisconsin | 18.3% | ±3.2 | 17.1% | +1.2 | 19.6% | 22.9% |
| 42 | Oklahoma | 17.9% | ±3.9 | 15.0% | +2.9 | 18.2% | 22.1% |
| 43 | New York | 17.8% | ±0.8 | 14.3% | +3.5 ✓ | 17.2% | 19.8% |
| 44 | Vermont | 17.7% | ±5.0 | 15.6% | +2.1 | 22.0% | 21.9% |
| 45 | Connecticut | 17.2% | ±2.5 | 13.9% | +3.3 | 17.6% | 20.8% |
| 45 | Louisiana | 17.2% | ±3.7 | 14.1% | +3.1 | 19.3% | 21.2% |
| 47 | Iowa | 17.0% | ±4.3 | 15.2% | +1.8 | 19.9% | 21.3% |
| 48 | Maine | 16.7% | ±6.0 | 19.8% | -3.1 | 19.6% | 17.8% |
| 49 | Alaska | 15.0% | ±7.7 | — | — | 15.2% | 18.5% |
| 50 | West Virginia | 13.9% | ±6.1 | 14.2% | -0.3 | 14.8% | 17.5% |
| — | Rhode Island | Suppressed | — | — | — | 20.9% |
Rank is by the latest survey; ties share a rank. “—” means Census suppressed that figure. Alaska’s first-2026 figure and one of North Dakota’s recent figures were suppressed. Download the full table (CSV).
Businesses vs. people: a second view
This section uses a different source. The Anthropic Economic Index measures how much people in each state use Anthropic’s Claude.ai chatbot, compared with each state’s share of the working-age (15–64) population. An index of 1.0 means use matches population. It counts people, not businesses, and only one AI product.
The two measures line up moderately well (correlation about 0.53 across 50 places). D.C. is first on both. West Virginia is last on both. But a few states split:
- New York: people rank #3 for Claude use (index 1.55), but only 17.8% of its single-state businesses use AI (#43). Connecticut, New Jersey and Massachusetts show the same gap.
- South Dakota and Kentucky: people use Claude less than most states (index 0.37 and 0.39), but their businesses report AI use above the national rate (27.2% and 24.1%).
We can’t say why from this data. One likely part of it: many of the Northeast’s big employers work across state lines, and Census leaves those companies out of state figures.
Anthropic Economic Index data (release of June 26, 2026, covering May 2026) by Anthropic, used under the Creative Commons Attribution (CC BY) license. The index is included in the CSV as a separate column.
What this means if you’re starting a business
- AI use is spreading into hands-on businesses, not just offices. If you plan to run a crew, expect more of your competitors to be using it. The hands-on jobs themselves are among the least exposed to AI; see AI-proof jobs by state.
- Your state matters less than your industry. The gap between information businesses and food service (49.0% vs 10.1%) is bigger than the gap between the highest and lowest state (33.9% vs 13.9%). Wherever you are, check the rules before you add AI tools: see AI laws small businesses must follow, by state.
- Big companies are further along: 70.7% of the 10-K annual reports filed this year mention artificial intelligence. See how often public companies mention AI in their 10-Ks.
- Still getting set up? Compare LLC costs by state, see the best states to start a business, or check new business formation numbers.
Cite or share this data
Reporters, bloggers and teachers are welcome to use the charts and numbers. Please credit and link to this page.
Source: StartBusinessByState.com analysis of U.S. Census Bureau Business Trends and Outlook Survey (BTOS) data. https://startbusinessbystate.com/small-business-ai-use-by-state/
Embed the map:
<a href=”https://startbusinessbystate.com/small-business-ai-use-by-state/”><img src=”https://startbusinessbystate.com/wp-content/uploads/2026/09/ai-use-by-state-map.png” alt=”Share of businesses using AI by state, 2026″ width=”1200″></a><br>Source: StartBusinessByState.com analysis of U.S. Census Bureau BTOS
Methodology
- Source. U.S. Census Bureau, Business Trends and Outlook Survey (BTOS), national, state, sector and subsector files, downloaded September 28, 2026. The latest survey (Census period 202619) covered Aug 24–Sep 6, 2026. It was collected Sep 7–20 and released Sep 24, 2026.
- The question. “In the last two weeks, did this business use Artificial Intelligence (AI) in any of its business functions? (Examples of AI: machine learning, natural language processing, virtual agents, voice recognition, etc.)” We report the share who answered “Yes.” The second question, shown in its own column, asks if the business expects to use AI in the next six months.
- Time frame. Census began asking this version of the question in the survey covering Nov 3–16, 2025. Older BTOS AI questions used different wording, so we do not compare to them. “First 2026 survey” is Census period 202601, covering Dec 15–28, 2025 (collected Dec 29, 2025–Jan 11, 2026).
- Who is counted. BTOS covers employer businesses (businesses with paid employees), except farms and a few other industries. Each business counts once, whatever its size. Businesses with no employees are not in the survey; see our study of businesses without employees. Businesses with locations in more than one state are grouped separately by Census and are not in any state’s figure.
- Margins of error. We show a 90% margin of error: 1.645 × the Census standard error. We call a change “bigger than the margin of error” when it is more than 1.645 × the square root of the sum of both squared standard errors. That treats the two surveys as independent, which is a simplification.
- Three-survey average. The simple average of the three most recent surveys (covering Jul 27–Sep 6, 2026). It smooths out one-round jumps. It is blank if any of the three was suppressed.
- Suppressed data. Census replaces figures that don’t meet its quality standards with “S.” Rhode Island’s latest figure was suppressed. We do not estimate missing values.
- Anthropic comparison. From the Anthropic Economic Index (Hugging Face dataset Anthropic/EconomicIndex, release 2026_06_26), state “usage per capita index” for May 2026. It is a separate source and is not combined with the Census numbers.
- Next update. Census posts new BTOS numbers every two weeks. The next scheduled release is October 8, 2026.
FAQ
What counts as “using AI”?
Whatever the business owner or manager says counts. Census gives examples: machine learning, natural language processing, virtual agents (chatbots) and voice recognition. The survey does not ask which tools or what they were used for.
Is this only small businesses?
No. The survey covers employer businesses of every size. But each business counts once, and most businesses are small. Big companies in several states are counted outside the state figures. So the state numbers lean toward local, smaller businesses.
Why did my state jump or drop so much?
State samples are smaller, so their numbers bounce. Check the margin of error and the three-survey average before reading too much into one round.
Why is Rhode Island blank?
Census suppressed Rhode Island’s latest figure because it did not meet publication standards. We leave it blank rather than guess.
Does this mean AI is replacing workers in construction?
This survey can’t tell you that. It only asks whether a business used AI. It says nothing about jobs, hours or pay.
How often is this updated?
Census releases new numbers every two weeks. We plan to refresh this page as new rounds come out.
Can I use your charts?
Yes. Please credit “StartBusinessByState.com analysis of U.S. Census Bureau BTOS” and link to this page.