Original research · U.S. Census Bureau Business Trends and Outlook Survey · Updated September 28, 2026
Data through: the Census survey covering Aug 24–Sep 6, 2026 (released Sep 24, 2026). Main figures average the three latest surveys (Jul 27–Sep 6, 2026). Next Census release: Oct 8, 2026.
Construction businesses are adopting AI faster than any other industry. In the latest Census surveys, 15.2% of construction businesses said they used AI in the past two weeks. In late 2025 it was 8.5%. That rise of 80% is the biggest of 16 industries. Specialty trade contractors, the group that includes electricians, plumbers and HVAC firms, nearly doubled, from 6.8% to 12.9%. Office businesses still use AI the most: 46.2% of information businesses and 43.0% of professional services firms.
Key findings
- Construction had the fastest growth of any industry. 8.5% of construction businesses used AI in late 2025 (Nov 3–Dec 14). In the latest three surveys it was 15.2%, up 79.8%. The gain (+6.8 points) is well outside the margin of error (±1.3). Manufacturing (+71.3%) and wholesale trade (+51.3%) came next. All businesses together rose 32.7%.
- Specialty trade contractors nearly doubled. Electrical, plumbing, HVAC, roofing and other trade contractors went from 6.8% to 12.9% (+88.4%). That is the #3 fastest rise of 33 subsectors we could compare. Building construction firms went from 11.9% to 20.1%.
- Office businesses still lead by a wide margin. Information businesses (46.2%), professional, scientific and technical services (43.0%) and finance and insurance (39.2%) top the list. The top subsectors are publishing, including software (61.6%), and data processing and web hosting (55.5%).
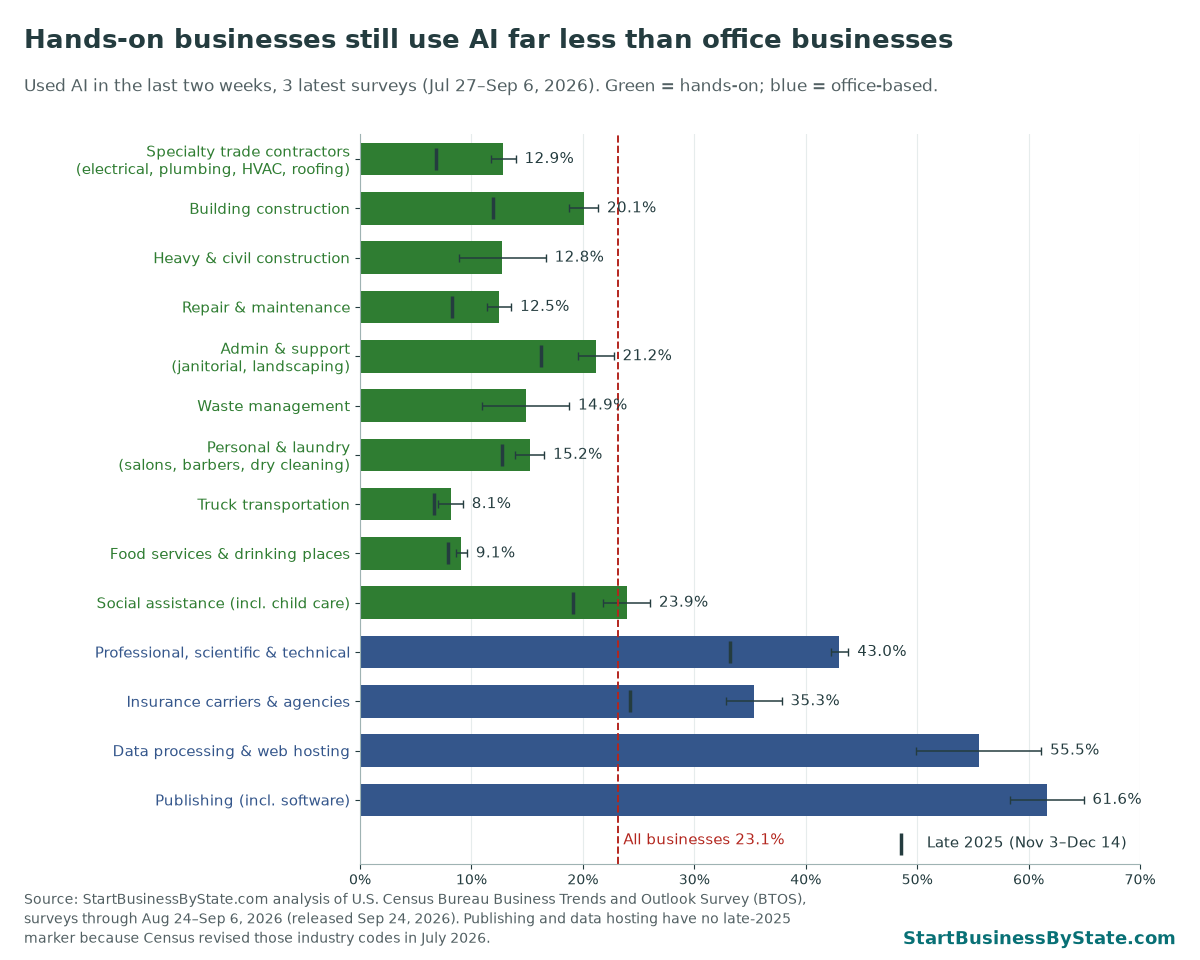
- Hands-on businesses are catching up but still trail. Construction (15.2%) is still below the all-business rate of 23.1%. Repair and maintenance shops are at 12.5%, restaurants and other food services at 9.1% and trucking at 8.1%. Gas stations are last of 60 subsectors at 3.7%.
- Your industry matters more than almost anything else. Information businesses use AI at about 5 times the rate of accommodation and food businesses (46.2% vs. 9.1%). 12 of 16 industries rose by more than the margin of error since late 2025. None fell.
Looking at single surveys instead of averages gives the same picture. In the latest survey alone (Aug 24–Sep 6, 2026), 15.4% of construction businesses used AI, up from 8.3% in the first survey of 2026 (Dec 15–28, 2025). Specialty trade contractors went from 6.1% to 14.3%. Those are the same single-survey numbers on our small-business AI use by state page, which ranks every state.
Which industries use AI most
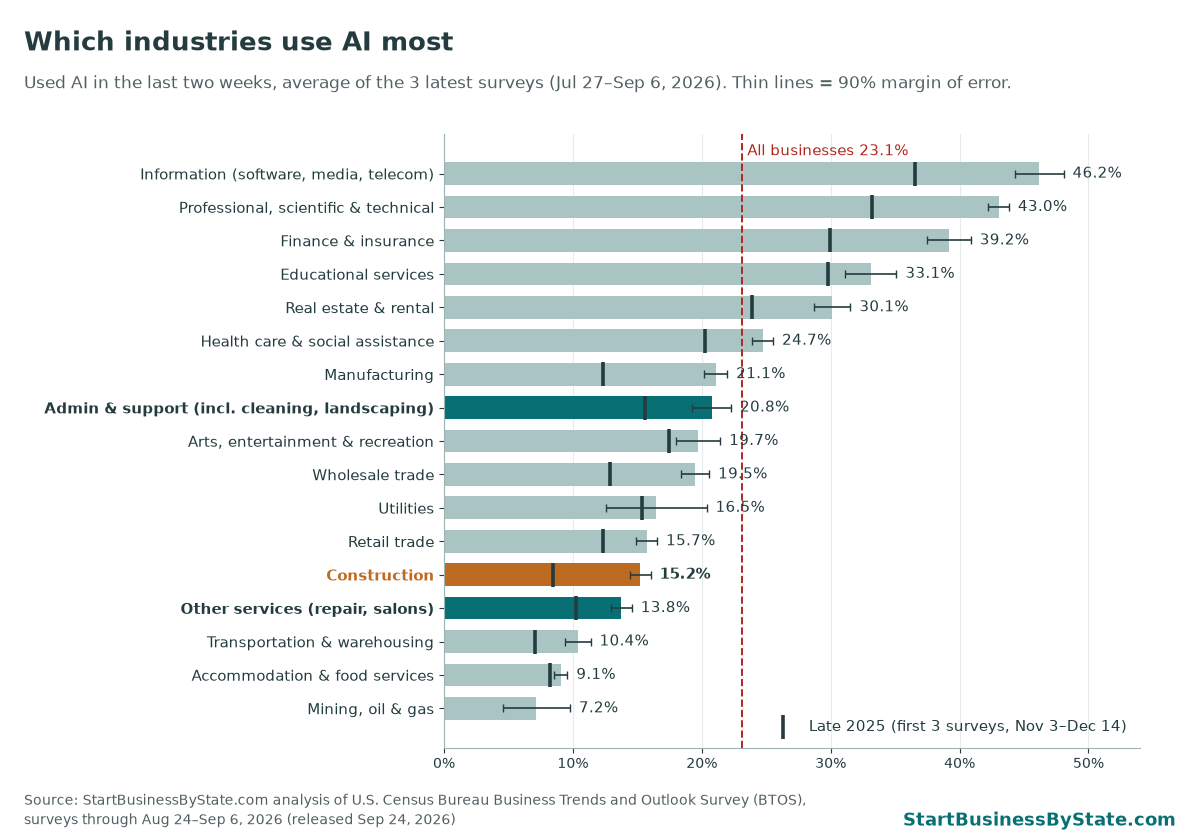
Every two weeks, the Census Bureau asks a new group of businesses whether they used AI in the past two weeks. Across all businesses, 23.1% said yes in the latest three surveys.
Businesses that work with words, numbers and software use it the most. Nearly half of information businesses do. Businesses where most of the work is done by hand, on a job site or behind a counter use it the least. Accommodation and food services (9.1%), transportation and warehousing (10.4%) and “other services,” which includes repair shops and salons (13.8%), are near the bottom.
Which industries are growing fastest
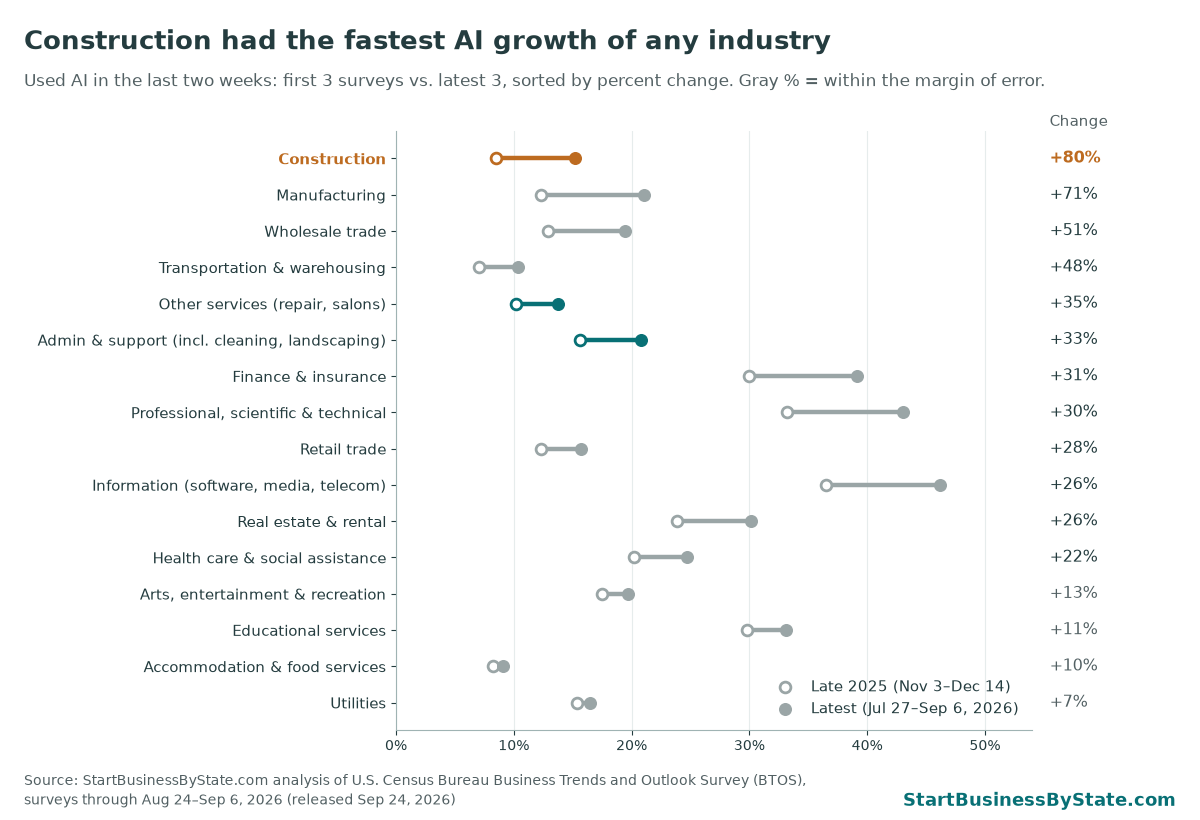
The fastest growth is not in tech. It is in industries that were starting from a low base. Construction, manufacturing, wholesale and transportation all grew by roughly half or more. The office industries added more points, but they started high, so their percent gains were smaller.
Factories stand out at the subsector level too. Food manufacturing went from 11.0% to 22.5%. Electrical equipment makers went from 12.0% to 32.5%, though that group is small and its margin of error is wide (±9.8 points).
Trades and hands-on businesses
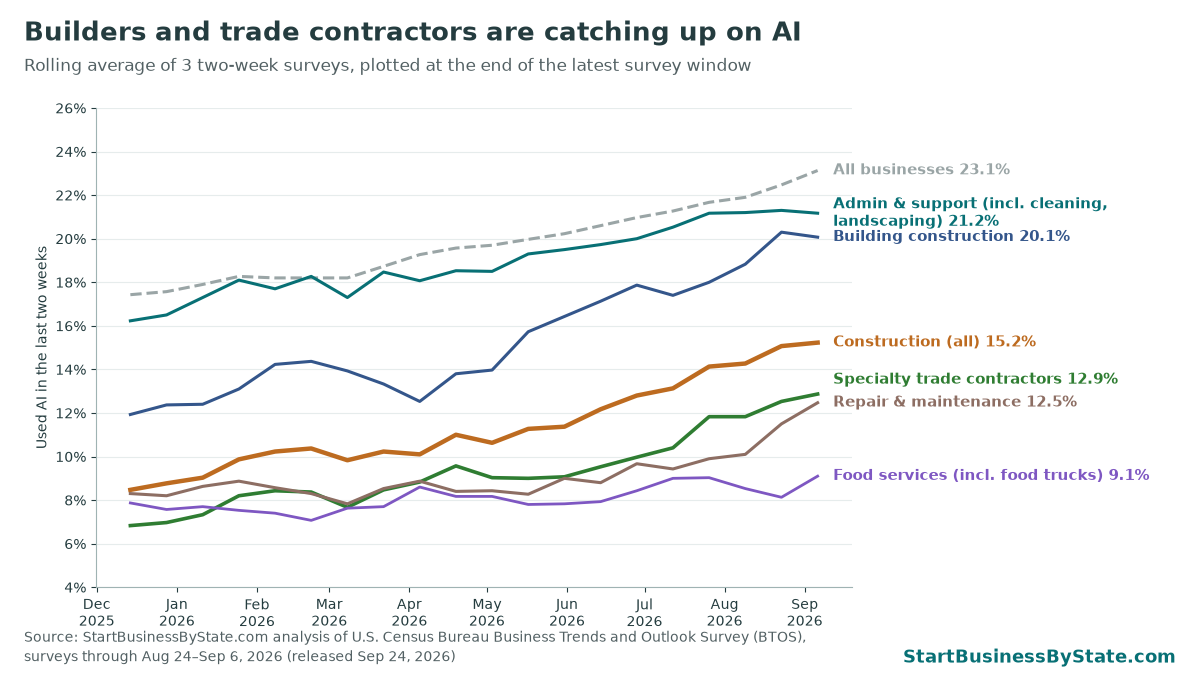
Until mid-July, specialty trade contractors used AI at under half the rate of all businesses. Then the line turned up. Compare the three surveys ending May 31 with the three ending Sep 6: construction gained +3.9 points, trade contractors +3.8 and repair shops +3.5. All businesses gained +2.9.
Census does not ask what businesses use AI for. For a small trade business, the likely uses are office tasks: writing quotes and emails, scheduling, answering the phone, bookkeeping and marketing. The survey can’t confirm that, and it doesn’t say whether AI changed anyone’s hiring.
AI is also creating building work. Data centers need a lot of electrical, mechanical and site work. For what that means for jobs, see trade jobs vs. tech jobs since ChatGPT.
AI use by trade and service subsector
Click a column heading to sort. ✓ = the change is larger than the 90% margin of error. The last two columns are single surveys, so they jump around more.
| NAICS | Subsector | Used AI, latest 3 surveys | Margin of error (90%) | Late 2025 (first 3 surveys) | Change | Latest single survey (Aug 24–Sep 6) | First 2026 survey (Dec 15–28) |
|---|---|---|---|---|---|---|---|
| 238 | Specialty trade contractors electricians, plumbers, HVAC, roofers, painters, drywall, flooring |
12.9% | ±1.1 | 6.8% | +88% ✓ | 14.3% (±2.0) | 6.1% |
| 236 | Building construction home builders, remodelers, commercial builders |
20.1% | ±1.3 | 11.9% | +68% ✓ | 17.4% (±2.5) | 12.1% |
| 237 | Heavy & civil engineering construction roads, utility lines, site work |
12.8% | ±3.9 | — | — | 15.7% (±8.1) | — |
| 811 | Repair & maintenance auto repair, equipment and appliance repair |
12.5% | ±1.1 | 8.3% | +50% ✓ | 13.3% (±2.2) | 8.3% |
| 561 | Administrative & support services janitorial, landscaping, pest control, staffing |
21.2% | ±1.6 | 16.2% | +30% ✓ | 21.3% (±3.2) | 16.9% |
| 562 | Waste management & remediation hauling, junk removal, cleanup |
14.9% | ±3.9 | — | — | 12.3% (±7.9) | 5.0% |
| 812 | Personal & laundry services salons, barbers, dry cleaners, pet care |
15.2% | ±1.3 | 12.7% | +20% ✓ | 16.9% (±2.2) | 10.6% |
| 484 | Truck transportation local and long-haul trucking |
8.1% | ±1.1 | 6.7% | +22% | 9.5% (±2.1) | 6.0% |
| 722 | Food services & drinking places restaurants, bars, food trucks, caterers |
9.1% | ±0.5 | 7.9% | +16% ✓ | 10.7% (±0.7) | 7.6% |
| 624 | Social assistance includes child day care |
23.9% | ±2.1 | 19.1% | +25% ✓ | 28.0% (±3.9) | 21.7% |
A few things stand out:
- Specialty trade contractors (12.9%) nearly doubled, but they are still at just over half the all-business rate. HVAC firms are part of this group. For more on that trade, see our HVAC industry statistics.
- Admin and support services (21.2%) is the highest of the hands-on groups. It includes janitorial and landscaping companies, but also staffing agencies and call centers, which may use AI more. Census does not break out landscaping alone. See our landscaping industry statistics for the size of that trade.
- Repair and maintenance shops went from 8.3% to 12.5%, up 50%.
- Trucking (8.1%) barely moved. Its change is within the margin of error.
- Food services, which includes restaurants and food trucks, stays near the bottom at 9.1%.
Using AI and inventing it are different things. Restaurants are near the bottom for AI use, but 27.6% of the 2025 patent applications aimed at restaurants and hotels involved AI, and so did 1 in 4 aimed at construction. About half of those construction applications came from small filers. See AI patents in Main Street industries.
Full data table
All industries (NAICS sectors)
Ranked by the average of the three latest surveys. Click a column heading to sort. ✓ = change is larger than the 90% margin of error. “—” = Census did not publish a value (too few responses or too unreliable).
| Rank | Industry | Used AI, latest 3 surveys (Jul 27–Sep 6, 2026) | Margin of error (90%) | Late 2025 (Nov 3–Dec 14) | Change | Latest single survey (Aug 24–Sep 6) | Expect to use AI in next 6 months |
|---|---|---|---|---|---|---|---|
| All businesses | 23.1% | ±0.3 | 17.4% | +33% ✓ | 23.8% | 26.9% | |
| 1 | Information (publishing, software, telecom, media) | 46.2% | ±1.9 | 36.5% | +26% ✓ | 49.0% | 49.9% |
| 2 | Professional, scientific & technical services | 43.0% | ±0.8 | 33.2% | +30% ✓ | 43.9% | 47.8% |
| 3 | Finance & insurance | 39.2% | ±1.7 | 29.9% | +31% ✓ | 41.0% | 45.2% |
| 4 | Educational services | 33.1% | ±2.0 | 29.8% | +11% | 30.0% | 38.0% |
| 5 | Real estate & rental | 30.1% | ±1.4 | 23.9% | +26% ✓ | 29.6% | 35.6% |
| 6 | Health care & social assistance (incl. child care) | 24.7% | ±0.8 | 20.2% | +22% ✓ | 25.5% | 29.4% |
| 7 | Manufacturing | 21.1% | ±0.9 | 12.3% | +71% ✓ | 19.5% | 24.5% |
| 8 | Admin, support & waste services (incl. cleaning, landscaping) | 20.8% | ±1.5 | 15.6% | +33% ✓ | 20.8% | 24.7% |
| 9 | Arts, entertainment & recreation | 19.7% | ±1.7 | 17.5% | +13% | 22.6% | 23.1% |
| 10 | Wholesale trade | 19.5% | ±1.1 | 12.9% | +51% ✓ | 19.2% | 23.9% |
| 11 | Utilities | 16.5% | ±3.9 | 15.4% | +7% | 11.8% | 18.5% |
| 12 | Retail trade | 15.7% | ±0.8 | 12.3% | +28% ✓ | 16.5% | 19.0% |
| 13 | Construction | 15.2% | ±0.8 | 8.5% | +80% ✓ | 15.4% | 17.3% |
| 14 | Other services (repair, salons, personal care) | 13.8% | ±0.8 | 10.2% | +35% ✓ | 15.0% | 16.0% |
| 15 | Transportation & warehousing | 10.4% | ±1.0 | 7.0% | +48% ✓ | 13.0% | 13.9% |
| 16 | Accommodation & food services | 9.1% | ±0.5 | 8.2% | +10% | 10.1% | 12.6% |
| 17 | Mining, oil & gas | 7.2% | ±2.6 | — | — | 8.0% | 9.1% |
| Agriculture, forestry & fishing (excl. farms) | — | — | — | — | 6.2% | — |
All 60 subsectors, ranked
3-digit NAICS subsectors with a published value in each of the three latest surveys. * = Census switched these retail and information subsectors to new industry codes in July 2026, so we don’t show a change.
| Rank | Subsector (NAICS) | Used AI, latest 3 surveys | Margin of error (90%) | Change since late 2025 |
|---|---|---|---|---|
| 1 | Publishing (incl. software publishers) (513) * | 61.6% | ±3.3 | — |
| 2 | Computing infrastructure, data processing & web hosting (518) * | 55.5% | ±5.6 | — |
| 3 | Securities & investments (523) | 50.1% | ±2.7 | +23% |
| 4 | Professional, scientific & technical services (541) | 43.0% | ±0.8 | +30% |
| 5 | Broadcasting & content providers (516) * | 37.6% | ±7.6 | — |
| 6 | Computer & electronic products (334) | 36.0% | ±5.6 | +68% |
| 7 | Motion picture & sound recording (512) * | 35.8% | ±4.2 | — |
| 8 | Insurance carriers & agencies (524) | 35.3% | ±2.5 | +46% |
| 9 | Educational services (611) | 33.1% | ±2.0 | +11% |
| 10 | Electrical equipment & appliances (335) | 32.5% | ±9.8 | +172% |
| 11 | Telecommunications (517) * | 32.0% | ±6.3 | — |
| 12 | Beverage & tobacco manufacturing (312) | 31.2% | ±5.5 | +40% |
| 13 | Real estate (531) | 31.1% | ±1.5 | +24% |
| 14 | Textile product mills (314) | 30.5% | ±8.4 | — |
| 15 | Printing (323) | 27.1% | ±3.6 | +43% |
| 16 | Chemicals (325) | 27.0% | ±5.5 | +54% |
| 17 | Museums, historical sites & zoos (712) | 26.6% | ±4.3 | +12% |
| 18 | Clothing, shoe & jewelry stores (458) * | 26.2% | ±3.2 | — |
| 19 | Miscellaneous manufacturing (339) | 26.1% | ±4.1 | +75% |
| 20 | General merchandise stores (455) * | 25.9% | ±6.7 | — |
| 21 | Ambulatory health care (doctors, dentists, clinics) (621) | 25.5% | ±0.9 | +23% |
| 22 | Credit intermediation (banks, lenders) (522) | 25.0% | ±3.8 | +29% |
| 23 | Social assistance (incl. child day care) (624) | 23.9% | ±2.1 | +25% |
| 24 | Wholesale: electronic markets & agents (425) | 23.8% | ±2.6 | +72% |
| 25 | Food manufacturing (311) | 22.5% | ±4.8 | +104% |
| 26 | Transportation equipment (336) | 21.9% | ±4.0 | — |
| 27 | Web search portals, libraries & other information services (519) * | 21.5% | ±7.0 | — |
| 28 | Administrative & support services (incl. janitorial, landscaping) (561) | 21.2% | ±1.6 | +30% |
| 29 | Machinery (333) | 20.3% | ±4.5 | +77% |
| 30 | Building construction (home builders, commercial builders, remodelers) (236) | 20.1% | ±1.3 | +68% |
| 31 | Furniture, electronics & appliance stores (449) * | 19.9% | ±2.9 | — |
| 31 | Amusement, gambling & recreation (gyms, golf, arcades) (713) | 19.9% | ±2.6 | +42% |
| 33 | Wholesale: durable goods (423) | 18.9% | ±1.4 | +51% |
| 34 | Wholesale: nondurable goods (424) | 18.7% | ±1.8 | +41% |
| 35 | Sporting goods, hobby, book, music & misc. stores (459) * | 18.5% | ±1.6 | — |
| 36 | Performing arts & spectator sports (711) | 18.4% | ±2.1 | -3% |
| 37 | Motor vehicle & parts dealers (441) * | 18.2% | ±2.2 | — |
| 38 | Health & personal care stores (456) * | 17.2% | ±3.7 | — |
| 39 | Rental & leasing services (532) | 16.6% | ±3.5 | — |
| 40 | Utilities (221) | 16.5% | ±3.9 | +7% |
| 41 | Furniture (337) | 16.4% | ±4.1 | — |
| 42 | Plastics & rubber (326) | 16.2% | ±5.6 | — |
| 43 | Personal & laundry services (salons, barbers, dry cleaning, pet care) (812) | 15.2% | ±1.3 | +20% |
| 44 | Waste management & remediation (562) | 14.9% | ±3.9 | — |
| 45 | Warehousing & storage (493) | 14.7% | ±4.8 | — |
| 46 | Couriers & messengers (492) | 14.6% | ±5.8 | — |
| 47 | Building material & garden stores (444) * | 14.0% | ±2.4 | — |
| 48 | Fabricated metal products (332) | 13.7% | ±1.8 | +57% |
| 49 | Specialty trade contractors (electrical, plumbing, HVAC, roofing, etc.) (238) | 12.9% | ±1.1 | +88% |
| 50 | Heavy & civil engineering construction (237) | 12.8% | ±3.9 | — |
| 51 | Transit & ground passenger transportation (485) | 12.6% | ±3.9 | — |
| 52 | Nonmetallic mineral products (327) | 12.6% | ±4.4 | — |
| 53 | Repair & maintenance (auto, equipment, appliance repair) (811) | 12.5% | ±1.1 | +50% |
| 54 | Nursing & residential care (623) | 11.9% | ±2.5 | -15% |
| 55 | Support activities for transportation (488) | 10.9% | ±2.3 | — |
| 56 | Food services & drinking places (incl. food trucks) (722) | 9.1% | ±0.5 | +16% |
| 57 | Accommodation (hotels, motels, RV parks) (721) | 9.0% | ±1.7 | -2% |
| 58 | Truck transportation (484) | 8.1% | ±1.1 | +22% |
| 59 | Food & beverage stores (445) * | 6.5% | ±1.1 | — |
| 60 | Gas stations & fuel dealers (457) * | 3.7% | ±0.7 | — |
What this means if you’re starting a business
- Look at your own industry, not the headlines. “1 in 4 businesses use AI” hides a huge range. In food service it’s closer to 1 in 11. In software and publishing it’s more than half.
- In the trades, your competitors are starting to try it. Specialty trade contractors’ use nearly doubled in under a year. Most still don’t use it, so it isn’t a must-have yet.
- Start with office work. Quotes, follow-up emails, scheduling and reviews are where a small crew saves time. The hands-on work is still yours.
- Know the rules before you plug it in. Some states now make you tell customers when they’re talking to a bot, or explain decisions an AI tool helped make. See AI laws by state. Stores and landlords should also check the state limits on pricing and rent software, and clinics and therapists the AI in health care laws.
- Big companies are further along. 70.7% of the 10-K annual reports filed this year mention artificial intelligence; see how often public companies mention AI.
- Small filers are patenting AI too. About 1 in 4 AI patent applications now comes from a small business, university or solo inventor. See AI patents by state.
- It only asks whether a business used AI in the past two weeks. It doesn’t ask what for, how much, or whether it paid off.
- It covers businesses with paid employees. One-person businesses with no payroll aren’t surveyed.
- Each business counts once, whatever its size, so the numbers mostly reflect small businesses. But big companies are in the survey too.
- Smaller industries have wider margins of error. We average three surveys and show the margin for each number.
Cite or share this data
Reporters and bloggers are welcome to use the charts and numbers. Please credit and link to this page.
Source: StartBusinessByState.com analysis of U.S. Census Bureau Business Trends and Outlook Survey data. https://startbusinessbystate.com/small-business-ai-use-by-industry/
Methods and sources
- The question. “In the last two weeks, did this business use Artificial Intelligence (AI) in any of its business functions? (Examples of AI: machine learning, natural language processing, virtual agents, voice recognition, etc.)” We report the share who answered yes. The six-month column uses a second question: “During the next six months, do you think this business will be using AI in any of its business functions?”
- Time frame. Census began asking this version of the question in the survey covering Nov 3–16, 2025. There have been 22 surveys since. Older BTOS AI questions were worded differently, so we don’t compare to them.
- Smoothing. Each two-week survey goes to a different group of businesses, so industry numbers jump around. Our main figures average three surveys in a row. “Late 2025” = the first three surveys (Nov 3–Dec 14, 2025). “Latest” = the three most recent (Jul 27–Sep 6, 2026). The margin of error for an average is 1.645 × the square root of the sum of the three squared standard errors, divided by three. We treat the surveys as independent samples, which is a simplification.
- Change. Percent change = latest average ÷ late-2025 average − 1. A change gets a ✓ when it is bigger than the 90% margin of error of the difference.
- Industries. Census groups businesses by NAICS code: 2-digit sectors and 3-digit subsectors. Census publishes no finer detail, so we can’t show electricians, HVAC or landscaping alone. Ranked lists include only industries with a published value in all three surveys being averaged. In July 2026 Census moved retail and information subsectors to new codes. We show their latest levels but no change.
- Who is counted. BTOS covers U.S. employer businesses except farms and a few other groups. Results are weighted so each business counts once. Census drew a new sample starting with the survey covering Jul 13–26, 2026.
- Source. U.S. Census Bureau, Business Trends and Outlook Survey, national, sector and subsector files, downloaded September 28, 2026. BTOS is an experimental data product. Census figures are public domain.
FAQ
Which industry uses AI the most?
Information businesses, which include software publishers, media and telecom companies. 46.2% used AI in the latest three Census surveys. Professional, scientific and technical services are second at 43.0%.
Do construction companies use AI?
More of them every month. 15.2% of construction businesses used AI in the latest three Census surveys, up from 8.5% in late 2025. That is the fastest growth of any industry, but still below the 23.1% rate for all businesses.
Why are your numbers different from other Census figures I’ve seen?
Most reports quote a single two-week survey. We average the three latest surveys to smooth out noise. The single-survey numbers are in the tables too.
How often is this updated?
Census releases new results every two weeks. The next release is due Oct 8, 2026. Check the “Data through” line at the top.