Original analysis • Published September 18, 2026 • Observation window: July 1, 2025–June 30, 2026
Business-debt bankruptcy filings rose 17.0% across courts in the 50 states and DC compared with the preceding 12 months. Texas courts accounted for 43.6% of the net increase, while Delaware courts recorded 726 fewer cases. Our analysis groups U.S. Courts district-level tables by state of filing court—not by where a business operates.
Why publish this comparison now?
On September 16, 2026, the House passed H.R. 7730, whose official House-passed text proposes a $7.5 million debt ceiling in the Subchapter V debtor definition. The text makes its amendments applicable to cases commenced on or after enactment. House passage is a legislative step, not proof that the proposal is law. These court counts end June 30, before that vote, and cannot measure its effect.
The policy debate raises a useful separate question: where were business-debt cases already increasing? F-2 provides comparable court-location counts, but no Subchapter V flag, debtor debt amount, industry or firm-size field. We therefore cannot calculate how many filers would qualify under the proposed ceiling.
Texas accounts for 43.6% of the net increase
Texas court filings rose from 3,122 to 4,823, an increase of 1,701 or 54.5%. Florida added 494 cases, California 379, New Jersey 314 and Louisiana 205. Delaware fell from 1,291 to 565 cases, a decline of 56.2%. These are changes in case counts, not a ranking of state business risk.
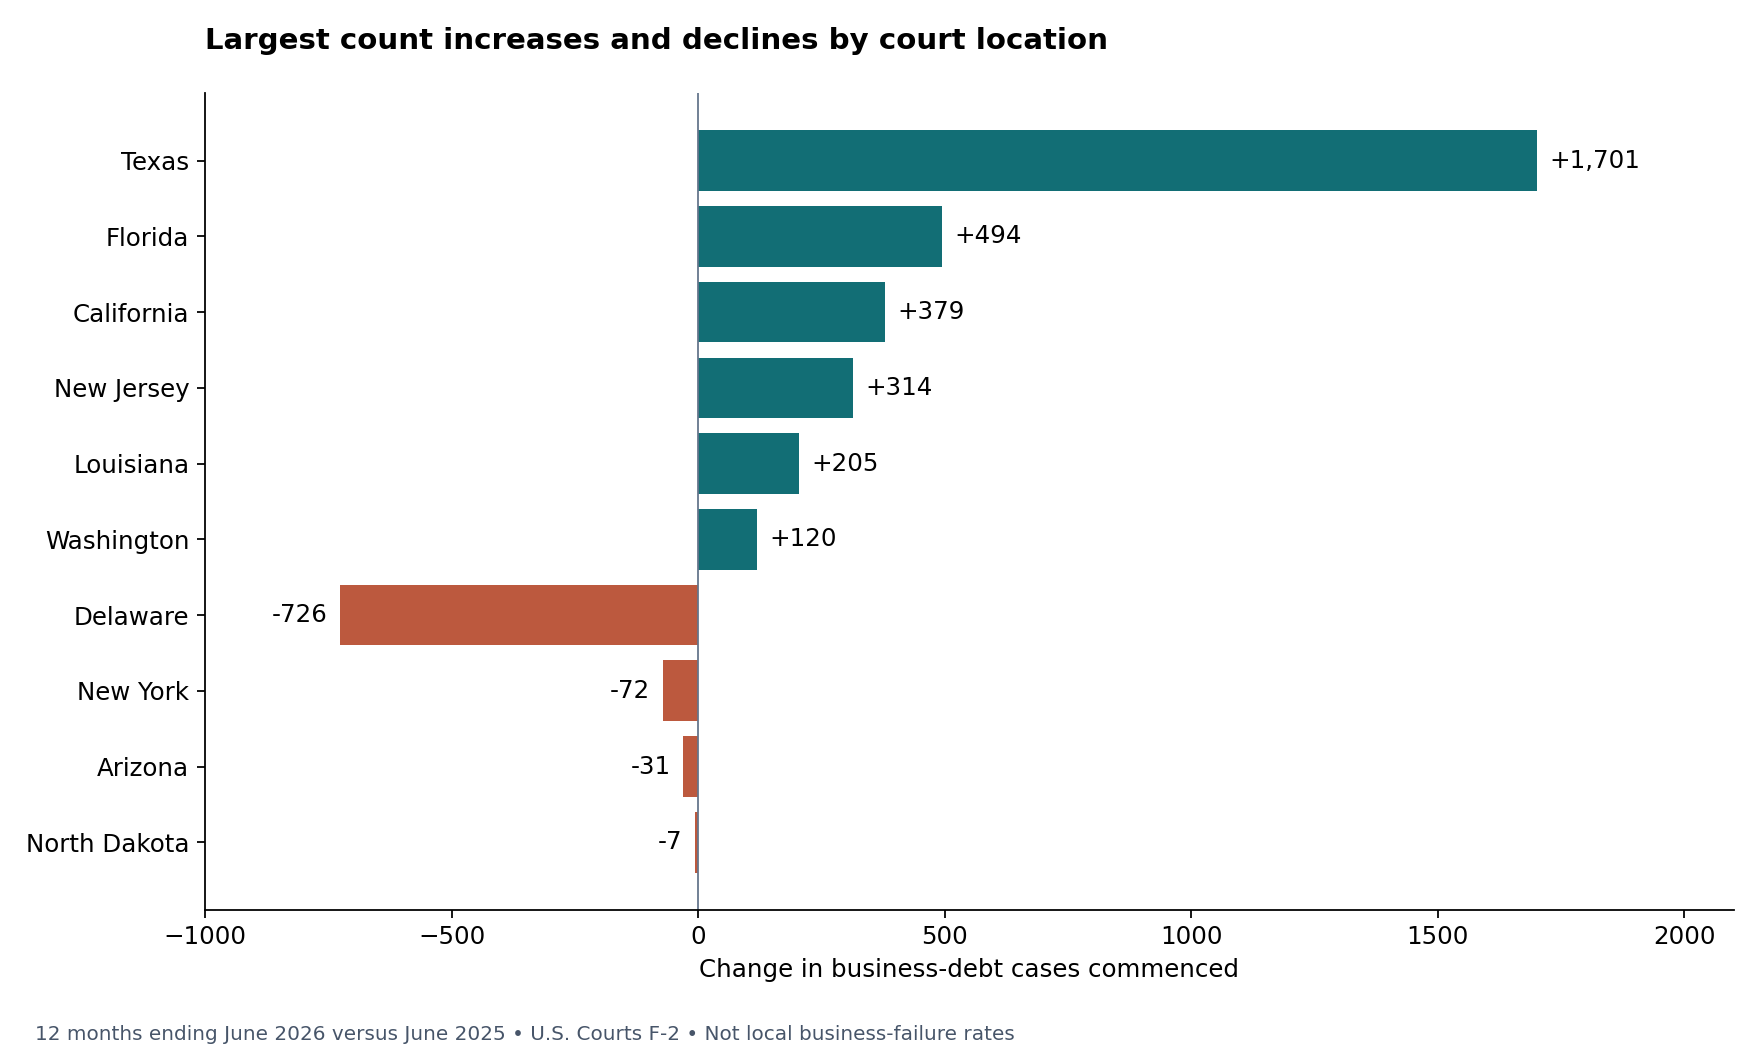
The 43.6% figure is Texas’s net change divided by the combined 50-state/DC net change: 1,701 ÷ 3,900. It is not Texas’s share of all filings, all gross increases or financially distressed businesses.
Texas’s districts tell different stories
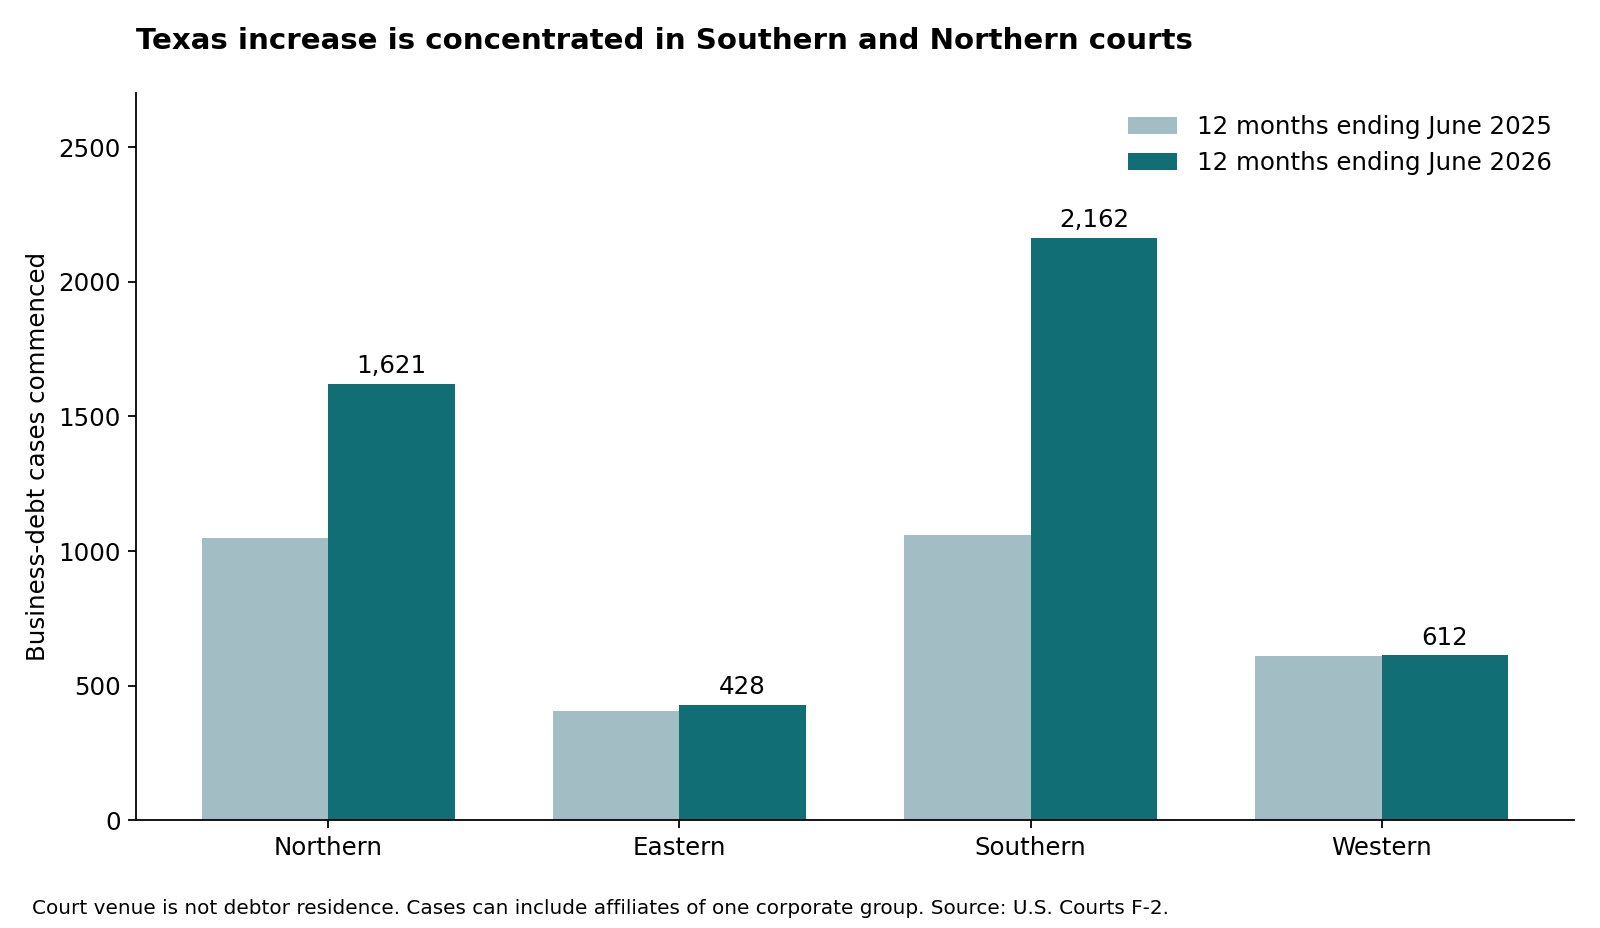
Southern Texas courts added 1,102 cases, Northern Texas 573, Eastern Texas 23 and Western Texas three. Southern Texas alone contributed 64.8% of the Texas increase. Business Chapter 11 cases across Texas rose from 1,254 to 2,753, accounting for 1,499 of its 1,701 additional business-debt cases. The tables do not tell us how many corporate groups or operating businesses those cases represent.
Compare business-debt filings by state of court
The complete static table includes all 50 states and DC. “2025” and “2026” below refer to 12-month periods ending June 30, not calendar years or first-half totals. State links lead to our cross-industry startup guides.
51 jurisdictions
| Court state | 2025 cases | 2026 cases | Net change | Change % | 2026 business Ch. 11 |
|---|---|---|---|---|---|
| Alabama | 256 | 276 | +20 | +7.8% | 101 |
| Alaska | 26 | 35 | +9 | +34.6% | 3 |
| Arizona | 454 | 423 | -31 | -6.8% | 128 |
| Arkansas | 239 | 262 | +23 | +9.6% | 47 |
| California | 3,013 | 3,392 | +379 | +12.6% | 724 |
| Colorado | 472 | 578 | +106 | +22.5% | 155 |
| Connecticut | 114 | 108 | -6 | -5.3% | 15 |
| Delaware | 1,291 | 565 | -726 | -56.2% | 331 |
| District of Columbia | 57 | 133 | +76 | +133.3% | 94 |
| Florida | 2,143 | 2,637 | +494 | +23.1% | 955 |
| Georgia | 1,004 | 1,076 | +72 | +7.2% | 374 |
| Hawaii | 50 | 53 | +3 | +6.0% | 13 |
| Idaho | 80 | 100 | +20 | +25.0% | 12 |
| Illinois | 912 | 918 | +6 | +0.7% | 223 |
| Indiana | 214 | 313 | +99 | +46.3% | 80 |
| Iowa | 125 | 130 | +5 | +4.0% | 18 |
| Kansas | 135 | 196 | +61 | +45.2% | 74 |
| Kentucky | 129 | 155 | +26 | +20.2% | 31 |
| Louisiana | 233 | 438 | +205 | +88.0% | 261 |
| Maine | 66 | 75 | +9 | +13.6% | 39 |
| Maryland | 336 | 400 | +64 | +19.0% | 104 |
| Massachusetts | 285 | 395 | +110 | +38.6% | 107 |
| Michigan | 303 | 349 | +46 | +15.2% | 81 |
| Minnesota | 245 | 312 | +67 | +27.3% | 42 |
| Mississippi | 180 | 231 | +51 | +28.3% | 53 |
| Missouri | 214 | 270 | +56 | +26.2% | 57 |
| Montana | 43 | 60 | +17 | +39.5% | 24 |
| Nebraska | 96 | 125 | +29 | +30.2% | 32 |
| Nevada | 290 | 351 | +61 | +21.0% | 95 |
| New Hampshire | 80 | 92 | +12 | +15.0% | 14 |
| New Jersey | 697 | 1,011 | +314 | +45.1% | 668 |
| New Mexico | 76 | 80 | +4 | +5.3% | 12 |
| New York | 2,133 | 2,061 | -72 | -3.4% | 889 |
| North Carolina | 378 | 492 | +114 | +30.2% | 157 |
| North Dakota | 38 | 31 | -7 | -18.4% | 5 |
| Ohio | 446 | 551 | +105 | +23.5% | 75 |
| Oklahoma | 247 | 329 | +82 | +33.2% | 34 |
| Oregon | 212 | 250 | +38 | +17.9% | 36 |
| Pennsylvania | 627 | 631 | +4 | +0.6% | 214 |
| Rhode Island | 39 | 52 | +13 | +33.3% | 6 |
| South Carolina | 150 | 171 | +21 | +14.0% | 29 |
| South Dakota | 31 | 28 | -3 | -9.7% | 3 |
| Tennessee | 445 | 446 | +1 | +0.2% | 166 |
| Texas | 3,122 | 4,823 | +1,701 | +54.5% | 2,753 |
| Utah | 130 | 163 | +33 | +25.4% | 33 |
| Vermont | 28 | 25 | -3 | -10.7% | 1 |
| Virginia | 388 | 386 | -2 | -0.5% | 92 |
| Washington | 329 | 449 | +120 | +36.5% | 148 |
| West Virginia | 78 | 90 | +12 | +15.4% | 41 |
| Wisconsin | 176 | 238 | +62 | +35.2% | 44 |
| Wyoming | 35 | 35 | +0 | +0.0% | 8 |
Inspect a state’s chapters and court districts
Texas
3,122 → 4,823 business-debt cases; +1,701 (+54.5%).
Current business-debt cases: Chapter 7 1,949; Chapter 11 2,753; Chapter 13 96; other chapters 25.
| District | Prior cases | Current cases | Net change |
|---|---|---|---|
| TX,N | 1,048 | 1,621 | +573 |
| TX,E | 405 | 428 | +23 |
| TX,S | 1,060 | 2,162 | +1,102 |
| TX,W | 609 | 612 | +3 |
How Chapter 7 and Chapter 11 contribute nationally
Across courts in the 50 states/DC, business Chapter 7 cases rose from 13,269 to 15,241 (+1,972). Business Chapter 11 cases rose from 7,829 to 9,701 (+1,872). Business Chapter 13 added 26 cases and other business chapters added 30. Chapter 11 accounts for 48.0% of the overall net increase; the tables do not separate its Subchapter V cases.
Downloads, source tables and reproducible methods
- Download the complete state comparison CSV (51 rows, chapter breakdowns and state guide URLs).
- Download the district-level source extraction CSV (both periods, including excluded territories explicitly labeled).
- Official June 2026 F-2 table and June 2025 F-2 table.
- Extract business-debt columns from the main F-2 district table for each period. Independently extract the same rows by PDF word coordinates and compare all 14 source cells per district.
- Sum filing districts within each state and DC; Arkansas’s combined published row is counted once. Preserve Puerto Rico, Virgin Islands, Guam and Northern Mariana Islands in district downloads but exclude them from the state comparison.
- Compute current minus prior cases and divide by prior cases for percentage change. Percentages can be volatile when prior counts are small; compare the counts alongside them.
- Reconcile all district business totals to official totals, and each state’s chapter counts to its business total. Missing source values remain blank; no missing cell in the 51-jurisdiction business comparison is imputed.
The official national total includes the excluded territories: 23,043 → 26,941, or +16.9%. Our declared 50-state/DC universe is 22,890 → 26,790, or +17.0%. Both calculations are consistent with the July 28, 2026 U.S. Courts release. This is a September 18 extraction of published administrative tables; later corrections may change historical counts.
Bankruptcy filings are different from business closures
A bankruptcy case can involve reorganization or liquidation, and many establishments close without filing. Multiple affiliates or repeat filings can increase cases without representing the same increase in unique businesses. Predominant business debt can also classify individual debtors as business cases. F-2 does not provide a compatible local business denominator, so we report counts rather than a per-business failure rate.
For establishment-cohort closure and survival context, start with our business survival rates by state, the closest companion research page. Our SBA loan statistics measure approvals and recorded charge-offs, while small-business credit access research examines applications and financing receipt. These are different populations and cannot be combined into a single failure score.
Cite this study
Suggested attribution: StartBusinessByState.com, “Business Bankruptcy Filings by State: 2026 Court Trends,” published September 18, 2026, analysis of U.S. Courts F-2 tables for the 12 months ending June 30, 2025 and 2026. Link to this page and retain “state of filing court” when using a state finding. The downloadable aggregate data and charts may be cited with attribution.