Original research · Census Annual Business Survey (ABS) 2024 · Reference year 2023 · CREDAPP / CREDREC · Published September 16, 2026
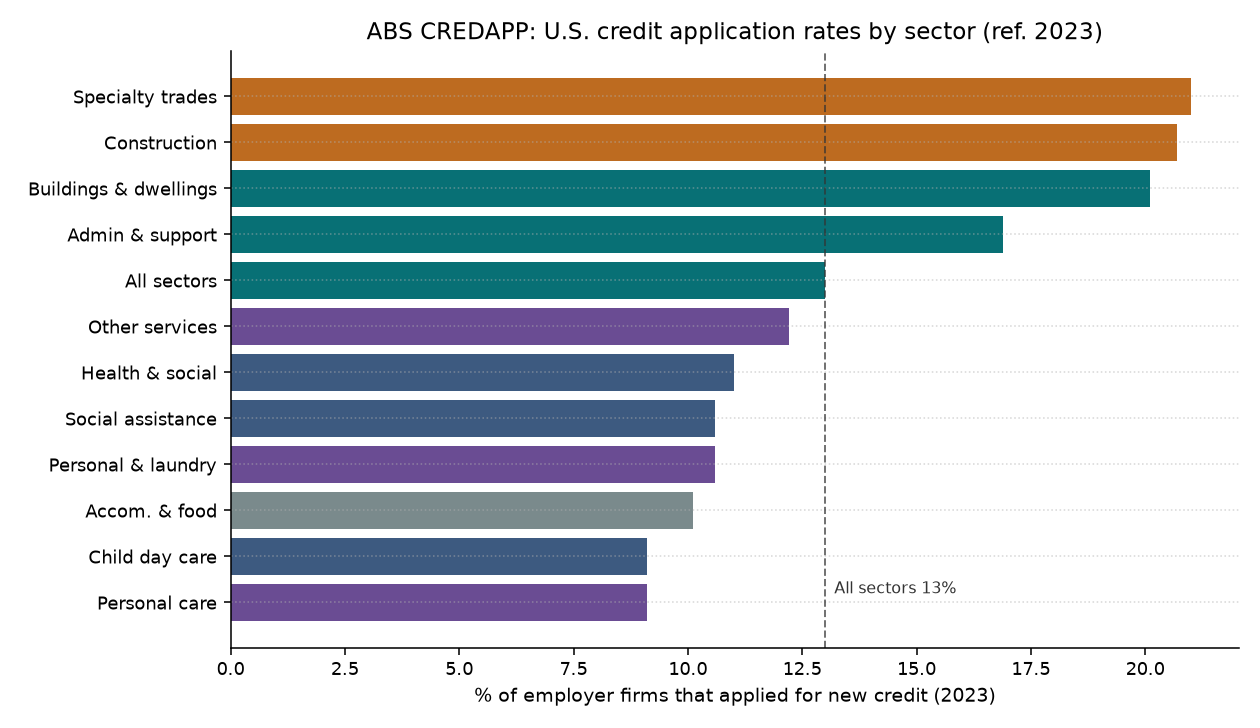
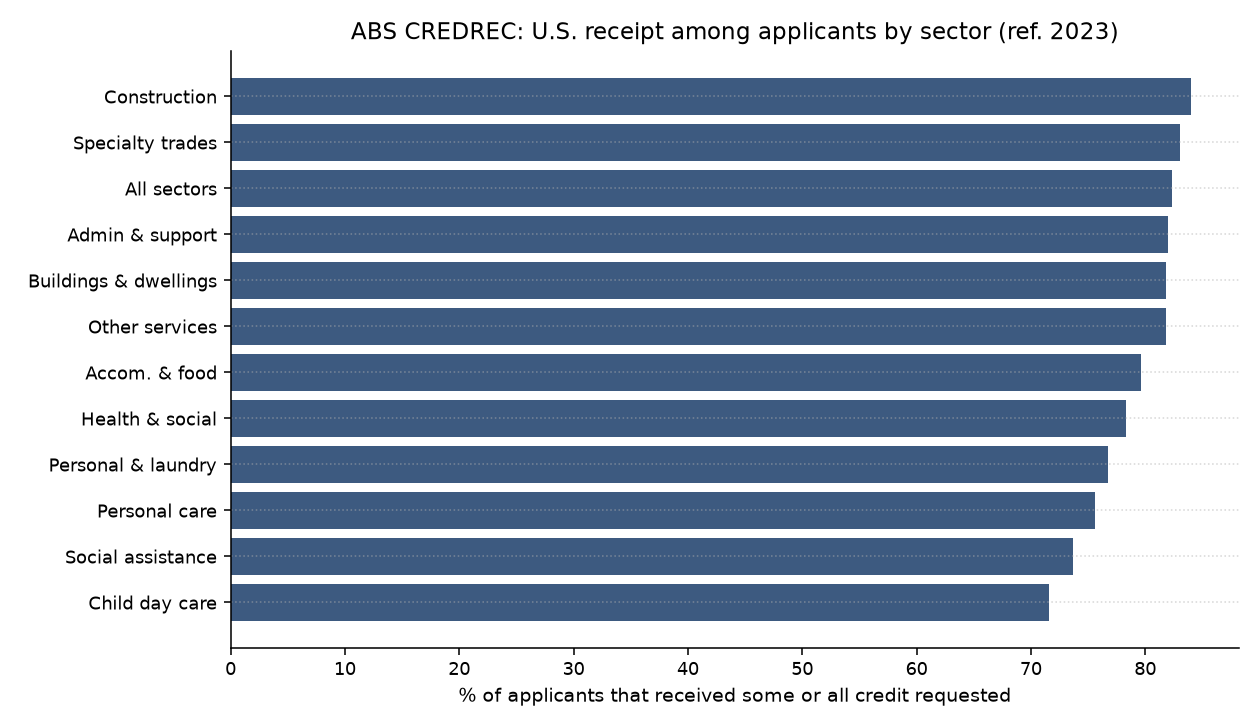
Census ABS Apply / Receive — who applied / who received credit — not “how to get a loan.” Most small service employer firms do not apply in a given year, but application rates jump by industry and firm size more cleanly than by a simple state “credit desert.” U.S. construction specialty trades applied at about 21.0%; child day care and personal care employers at about 9.1%. Among firms that did apply, roughly eight in ten received some or all of the credit they requested — with daycare applicants faring worse (71.6% some/all). This is ABS survey credit behavior (CREDAPP / CREDREC) by sector and state — not Treasury/SBA loan-application advice, not an SBA loan-outcomes scorecard, and not a best-state ranking.
Source: Census ABS Module Business Characteristics API (2023/absmcb), questions CREDAPP (QDESC B51) and CREDREC (QDESC B53). Universe: employer firms only — nonemployers and many sole props are out of scope. Distinct from our SBA loan statistics by state (approvals / charge-offs) and from business formation statistics.
For who owns those employer firms (women / minority / veteran shares by state and sector — a different ABS table, not credit behavior), see employer ownership demographics (ABS).
Key findings
- Application rates diverge by sector. Specialty trade contractors 21.0% and construction 20.7% applied most among our focus peers; services to buildings and dwellings (cleaning/landscaping rollup) 20.1%; all employer sectors 13.0%; child day care and personal care only 9.1%.
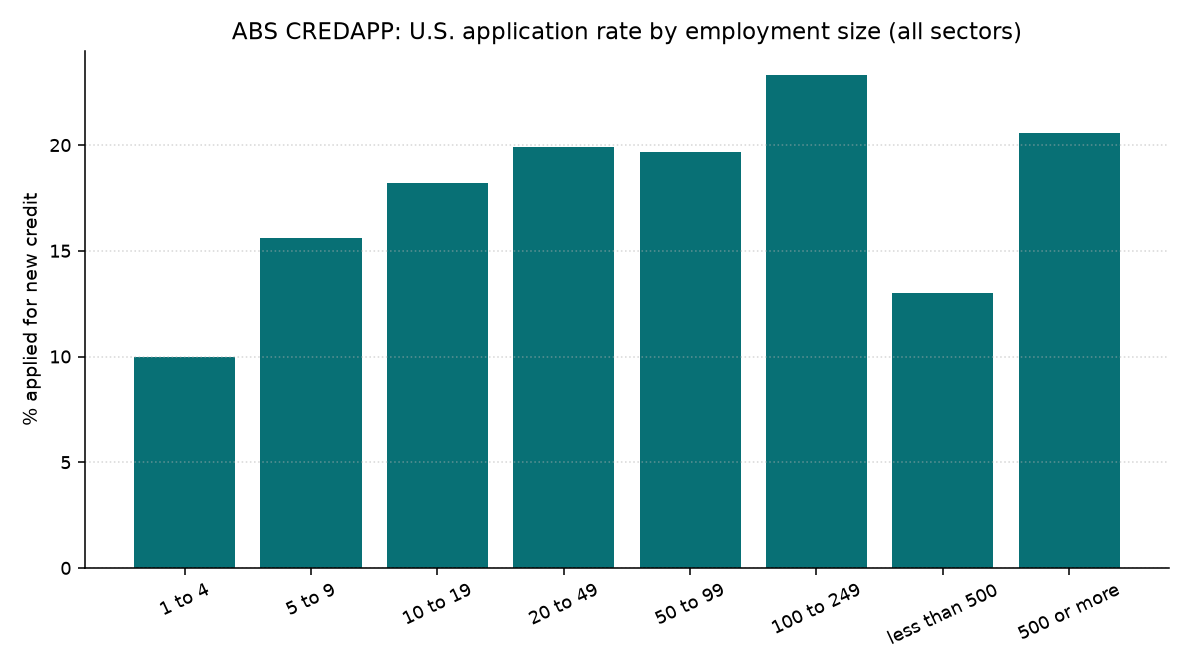
- Firm size matters as much as geography. Among all sectors, firms with 1–4 employees applied at 10.0% versus 23.3% for 100–249 employees — a 13.3 pp gap. Employment-size × fine industry cells are largely unpublished.
- Among applicants, most receive something. Nationally, 82.3% of applicants received some or all requested credit (57.2% all; 25.1% some; 7.2% none). Child day care applicants: 71.6% some/all and 14.5% none.
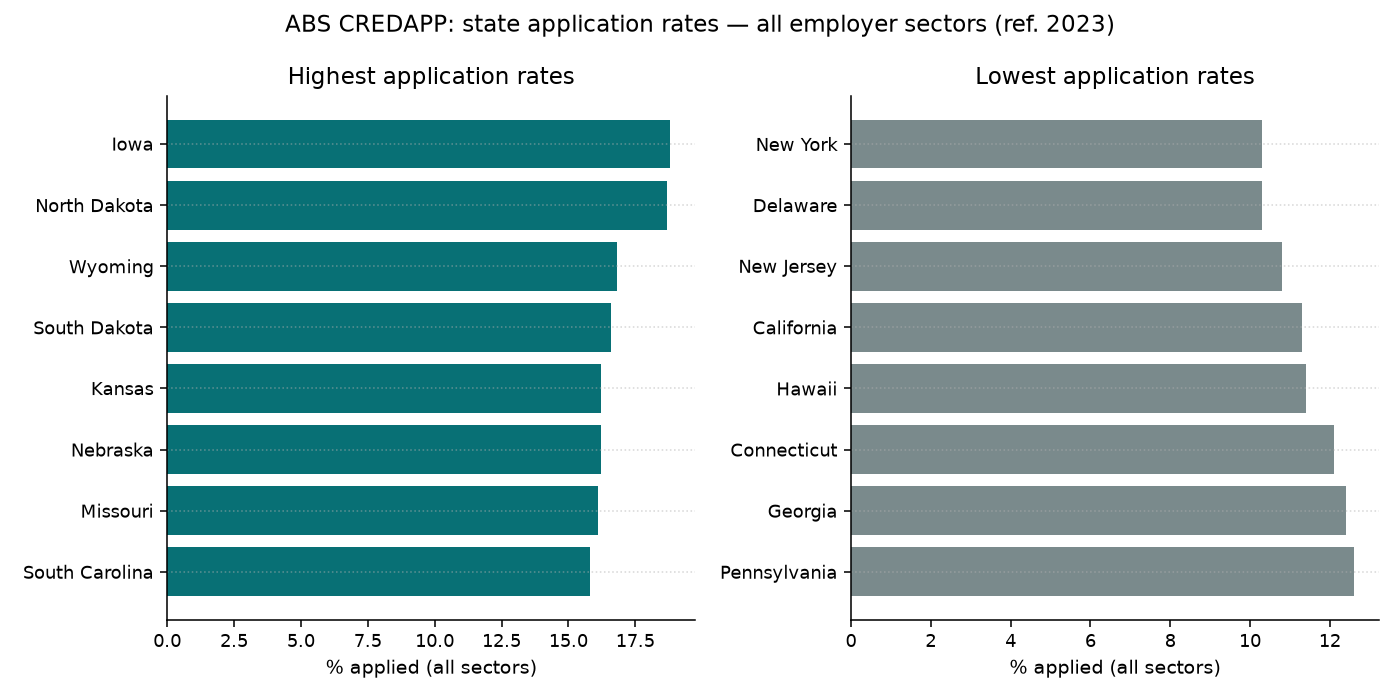
- States are not a simple credit desert map. All-sector state application rates span only 8.5 pp (10.3%–18.8%). High/low states flip by sector — e.g., South Dakota is low for admin & support but high for all sectors. Several state×sector cells are Census-suppressed (admin & support: 3 suppressed / 48 published).
- ABS ≠ sole props. These estimates describe employer firms in the ABS sample. Nonemployer-heavy trades (cleaning, landscaping, salons) look different in nonemployer share by state and sole-prop profit by state.
Credit applications and receipt by sector
| Sector | NAICS | % applied | Firms applied (est.) | % received some/all | % all | % some | % none |
|---|---|---|---|---|---|---|---|
| All sectors | 00 | 13.0% | 378,674 | 82.3% | 57.2% | 25.1% | 7.2% |
| Construction | 23 | 20.7% | 78,194 | 84.0% | 60.2% | 23.8% | 5.4% |
| Specialty trades | 238 | 21.0% | 51,902 | 83.0% | 61.3% | 21.7% | 5.3% |
| Building equipment | 2382 | 21.2% | 22,001 | 83.7% | 63.0% | 20.7% | 5.0% |
| Admin & support | 56 | 16.9% | 30,108 | 82.0% | 59.2% | 22.8% | 6.4% |
| Admin support | 561 | 16.2% | 26,963 | 81.4% | 58.2% | 23.2% | 6.6% |
| Buildings & dwellings | 5617 | 20.1% | 20,185 | 81.8% | 58.8% | 23.0% | 6.3% |
| Health & social | 62 | 11.0% | 37,146 | 78.3% | 54.5% | 23.8% | 8.8% |
| Social assistance | 624 | 10.6% | 4,232 | 73.7% | 45.3% | 28.4% | 13.0% |
| Child day care | 6244 | 9.1% | 1,930 | 71.6% | 40.3% | 31.3% | 14.5% |
| Other services | 81 | 12.2% | 22,853 | 81.8% | 56.4% | 25.4% | 6.9% |
| Personal & laundry | 812 | 10.6% | 9,654 | 76.7% | 51.3% | 25.4% | 9.5% |
| Personal care | 8121 | 9.1% | 4,935 | 75.6% | 47.3% | 28.3% | 7.0% |
| Accom. & food | 72 | 10.1% | 22,627 | 79.6% | 48.8% | 30.8% | 9.1% |
| Professional | 54 | 9.7% | 49,715 | 81.2% | 55.5% | 25.7% | 9.0% |
| Manufacturing | 31-33 | 17.7% | 22,591 | 85.5% | 66.2% | 19.3% | 6.3% |
| Wholesale | 42 | 14.4% | 20,893 | 84.2% | 60.1% | 24.1% | 6.1% |
| Retail | 44-45 | 13.1% | 35,570 | 82.6% | 53.6% | 29.0% | 7.9% |
| Transportation | 48-49 | 20.5% | 18,987 | 83.8% | 58.3% | 25.5% | 6.4% |
How to read CREDREC: percentages are among firms that reported on the receipt question (essentially applicants). “Received some/all” = F11A02 + F11A03. Don’t-know answers are excluded from that sum but remain in the published distribution.
Application rates by employment size
| Employment size | % applied | Firms applied (est.) |
|---|---|---|
| Firms with 1 to 4 employees | 10.0% | 152,754 |
| Firms with 5 to 9 employees | 15.6% | 81,524 |
| Firms with 10 to 19 employees | 18.2% | 62,856 |
| Firms with 20 to 49 employees | 19.9% | 42,891 |
| Firms with 50 to 99 employees | 19.7% | 12,408 |
| Firms with 100 to 249 employees | 23.3% | 7,593 |
| Firms with 250 to 499 employees | 17.5% | 1,292 |
| Firms with less than 500 employees | 13.0% | 376,838 |
| Firms with 500 employees or more | 20.6% | 1,836 |
State patterns (where published)
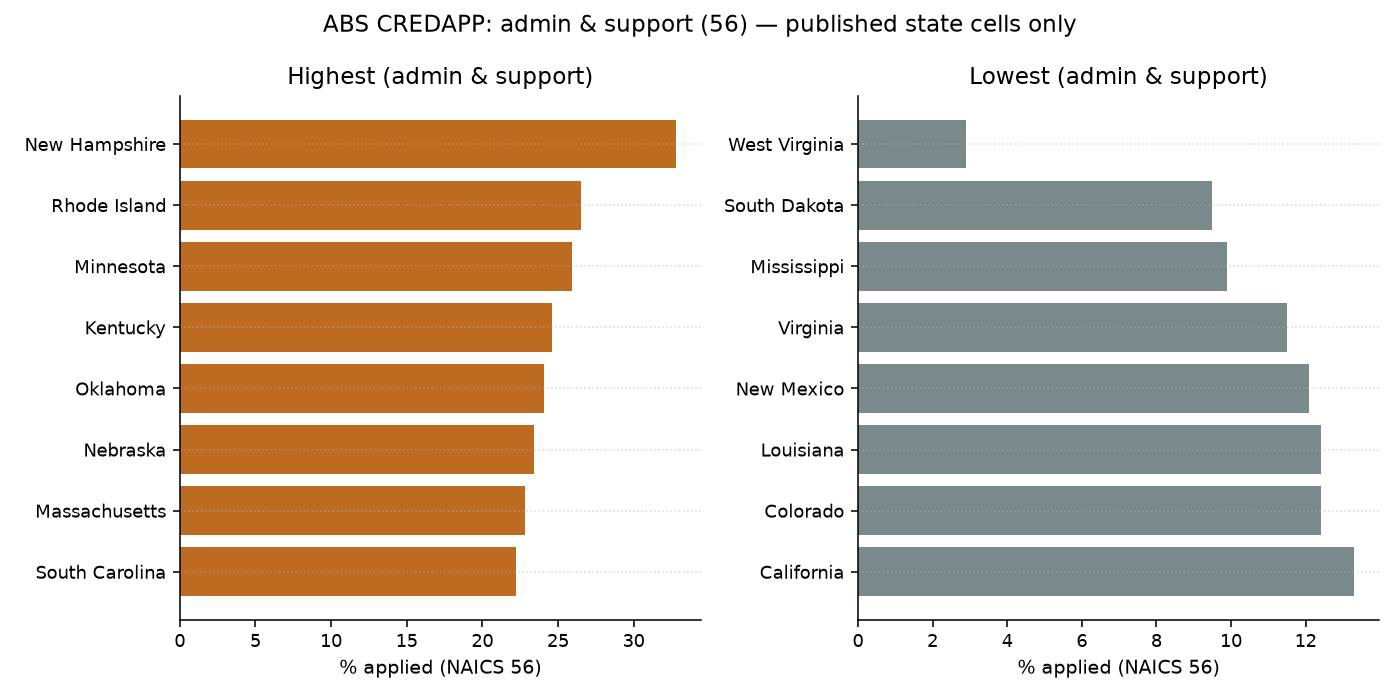
| State | All sectors | Construction (23) | Admin & support (56) | Health & social (62) | Other services (81) | Accom. & food (72) | Received some/all (all) | Received some/all (56) |
|---|---|---|---|---|---|---|---|---|
| Iowa | 18.8% | 28.7% | 20.2% | 15.7% | — | 13.1% | 83.7% | 70.3% |
| North Dakota | 18.7% | — | 20.4% | — | — | 6.8% | 89.6% | — |
| Wyoming | 16.8% | 33.4% | 16.8% | 8.2% | 5.5% | 19.9% | 84.9% | — |
| South Dakota | 16.6% | 27.0% | 9.5% | — | 5.2% | 12.0% | 89.2% | — |
| Kansas | 16.2% | 27.6% | 13.4% | 17.3% | 10.4% | 15.0% | 84.9% | 71.0% |
| Nebraska | 16.2% | 19.0% | 23.4% | 22.5% | 23.4% | 6.4% | 82.7% | 87.4% |
| Missouri | 16.1% | 31.8% | 21.0% | 12.2% | 11.9% | 10.1% | 83.4% | — |
| South Carolina | 15.8% | 20.6% | 22.2% | 12.4% | — | 9.4% | 86.0% | 93.9% |
| Vermont | 15.8% | 25.9% | 19.6% | — | 0.7% | 13.1% | 84.5% | — |
| Indiana | 15.7% | 21.0% | 18.3% | 12.1% | 12.4% | 13.5% | 84.2% | 74.9% |
| New Hampshire | 15.7% | 19.8% | 32.8% | 16.5% | 13.1% | 10.9% | 85.3% | — |
| North Carolina | 15.5% | 25.2% | 18.9% | 12.2% | 17.5% | 8.7% | — | 87.7% |
| Maine | 15.2% | — | 16.7% | 6.2% | — | 17.0% | 92.4% | — |
| Minnesota | 15.1% | 22.7% | 25.9% | 12.5% | 14.4% | 9.9% | 88.6% | 81.6% |
| Texas | 15.1% | 26.3% | 17.8% | 12.7% | 16.5% | 10.9% | 82.2% | 82.5% |
| Montana | 14.9% | 15.0% | 13.9% | 15.6% | 9.5% | 10.6% | 91.8% | — |
| Wisconsin | 14.9% | 22.7% | 16.8% | 14.3% | 11.7% | 7.1% | 88.1% | 91.2% |
| Alaska | 14.8% | 27.0% | — | 8.4% | 14.1% | 11.8% | 77.4% | — |
| Mississippi | 14.8% | 31.2% | 9.9% | 13.0% | — | 14.6% | 84.2% | 70.8% |
| New Mexico | 14.8% | 14.6% | 12.1% | 18.9% | 20.3% | 7.6% | 82.7% | 59.4% |
| Alabama | 14.5% | 25.3% | 15.3% | 7.9% | 8.9% | 9.0% | 82.9% | 71.3% |
| Arkansas | 14.5% | 26.3% | — | 7.5% | — | 4.4% | 84.6% | — |
| Ohio | 14.5% | 21.6% | 19.6% | 13.3% | 9.8% | 9.8% | 82.9% | 83.7% |
| Utah | 14.5% | 24.1% | 20.5% | 11.0% | 17.2% | 13.8% | 85.1% | 83.9% |
| Oklahoma | 14.3% | 23.1% | 24.1% | 9.2% | 22.1% | 10.1% | 81.2% | — |
| Tennessee | 14.1% | 21.6% | 16.2% | 9.2% | 11.3% | 10.4% | 85.5% | — |
| Oregon | 13.8% | 18.5% | 13.8% | 9.7% | 10.5% | 16.7% | 82.1% | 80.4% |
| Washington | 13.6% | 18.6% | 13.8% | 11.3% | 9.0% | 14.8% | 81.7% | — |
| Maryland | 13.5% | 22.6% | 14.0% | 11.5% | 8.4% | 18.2% | 82.6% | — |
| Idaho | 13.4% | 17.0% | — | 7.4% | 13.5% | 8.3% | 80.7% | — |
| Louisiana | 13.4% | 21.3% | 12.4% | 11.6% | 7.5% | 5.0% | 81.4% | 62.2% |
| Rhode Island | 13.4% | — | 26.5% | 6.7% | — | 6.3% | 82.9% | — |
| Illinois | 13.1% | 20.0% | 15.1% | 11.4% | 12.9% | 8.7% | 81.6% | 76.8% |
| Kentucky | 13.0% | 15.8% | 24.6% | 9.3% | 19.0% | 5.1% | 88.3% | — |
| Virginia | 13.0% | 21.4% | 11.5% | 14.9% | 11.4% | 9.8% | 81.7% | 91.2% |
| Colorado | 12.9% | 21.7% | 12.4% | 13.2% | 16.2% | 9.0% | 81.2% | 74.5% |
| West Virginia | 12.9% | 25.4% | 2.9% | 5.2% | — | 13.0% | 91.5% | 57.2% |
| Arizona | 12.8% | 18.9% | 14.2% | 10.5% | 15.7% | 11.4% | 78.6% | 89.6% |
| Florida | 12.7% | 19.1% | 16.3% | 11.2% | 14.1% | 9.8% | 78.6% | 74.4% |
| Massachusetts | 12.7% | 17.6% | 22.8% | 10.1% | 8.3% | 10.2% | 84.3% | — |
| Nevada | 12.7% | — | 15.2% | 16.0% | 20.9% | 11.8% | — | — |
| District of Columbia | 12.6% | — | 13.9% | 4.2% | — | 16.3% | 76.0% | — |
| Michigan | 12.6% | 15.6% | 18.5% | 12.9% | 12.4% | 9.1% | 81.6% | 80.2% |
| Pennsylvania | 12.6% | 19.7% | 18.4% | 9.5% | 8.7% | 10.5% | 81.8% | 77.5% |
| Georgia | 12.4% | 21.3% | 18.7% | 12.9% | 10.8% | 8.6% | 81.8% | 85.4% |
| Connecticut | 12.1% | 18.6% | 15.7% | 14.6% | 8.2% | 13.8% | 84.0% | — |
| Hawaii | 11.4% | 19.9% | 13.9% | 4.7% | 1.6% | 8.8% | 80.9% | — |
| California | 11.3% | 17.3% | 13.3% | 8.9% | 11.2% | 10.4% | 78.9% | 78.9% |
| New Jersey | 10.8% | 16.0% | 16.4% | 8.0% | 11.1% | 8.7% | 77.0% | 77.5% |
| Delaware | 10.3% | — | 15.3% | 5.7% | 6.2% | 1.2% | 82.6% | — |
| New York | 10.3% | 17.1% | 16.3% | 8.0% | 10.0% | 9.6% | 82.2% | 87.7% |
State names link to each state’s hub on StartBusinessByState. Suppression counts (CREDAPP Yes cells): construction 6, admin & support 3, health & social 3, other services 9, accommodation & food 0.
Hypothesis check — industry and size vs “credit deserts”
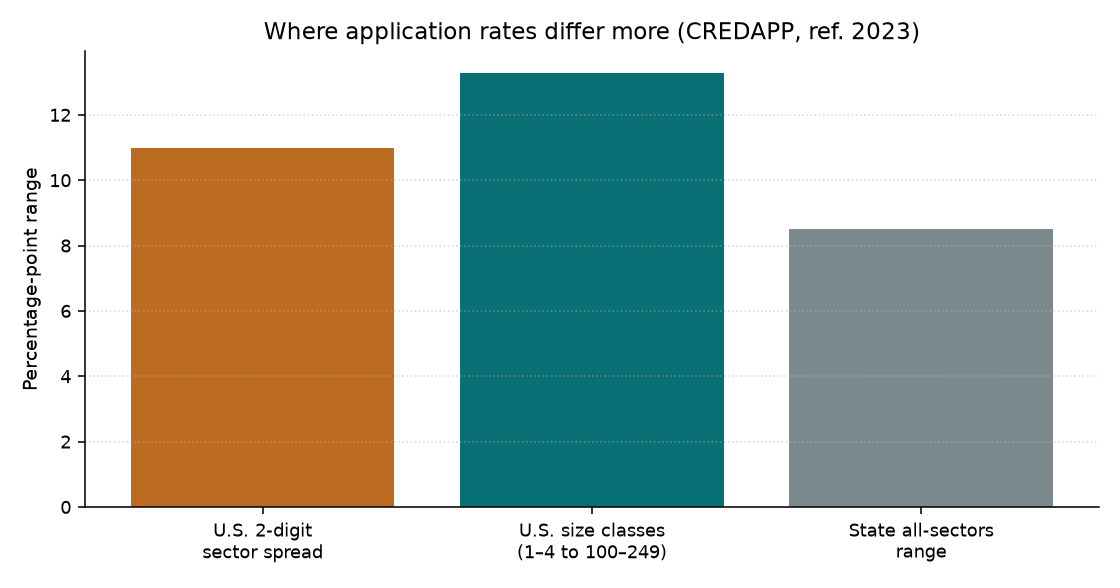
We hypothesized that application rates differ more by firm size and industry than by a simple state credit desert. The all-sector state range (8.5 pp) is smaller than the U.S. 2-digit sector band (11.0 pp) and the size-class band (13.3 pp). Within a single sector, published state cells can swing more — but ranks flip across sectors, and suppressed/thin cells warn against a one-map “desert” story. This page is deliberately not a best-state score.
Downloads
- State CREDAPP / CREDREC CSV (published cells; suppressed flagged)
- U.S. sector CREDAPP + CREDREC CSV
- U.S. employment-size CREDAPP CSV
What this means for planning
For a separate view of recorded financial distress, compare business bankruptcy filings by court state. These administrative cases are not credit-applicant outcomes, and court location does not necessarily identify where a debtor operates. The study does not attribute filings to financing access.
Explore SBA variable-rate lending by industry and state with historical SBA approval data and explicit repayment assumptions. The study distinguishes rate classifications in the SBA extract from current debt and actual payment changes; financing does not resolve a recurring operating loss.
Credit application behavior is one input — not a substitute for underwriting, cash planning, or insurance. If you are building a service employer:
- How to start a cleaning business · landscaping guide · HVAC guide · how to start a daycare
- Capital context: SBA loan approvals and charge-offs by state (different dataset — loan outcomes, not ABS apply/receive)
- SBA jobs & lender concentration by industry — FOIA jobs-per-dollar, lender HHI, and seasoned charge-offs for cleaning/landscaping/HVAC/daycare/salon/food-truck (not ABS survey behavior)
- Federal contracts for service NAICS by state — USASpending obligations by place of performance for the same trades (procurement, not ABS credit or SBA lending)
- Structure and profit context: nonemployer share, sole-prop profit by state, formation statistics
- Insurance is a separate decision from credit: cleaning business insurance, landscaping insurance, HVAC insurance, daycare insurance
Methods and limitations
- Survey: Census Annual Business Survey, collection year 2024, reference year 2023. API dataset
absmcb(Module Business Characteristics). - CREDAPP (B51): “For the 12 months ending December 31, 2023, did this business submit an application for new credit (e.g., a credit card, loan, line of credit, trade financing, etc.)?” We report the published percent for BUSCHAR
F09A01(Yes) relative to total reporting (F09ATR= 100%). - CREDREC (B53): Among firms answering the receipt question, how much of requested credit was received — none / some / all. “Received some/all” is our sum of F11A02 + F11A03.
- Filters: Unless noted, EMPSZFI = All firms (
001) and YIBSZFI = All firms (001). Size breaks use all-sector CREDAPP Yes. - Universe: Employer firms in ABS. Not nonemployers; not a census of all Schedule C filers.
- Suppression & error: Census flags (
S, etc.) are shown as em dashes — we never invent suppressed cells. Relative standard errors can be large in thin state×sector cells; extremes (e.g., very low West Virginia admin & support) should be read with caution. - Industry grain: State tables use 2-digit NAICS. Finer codes (5617, 6244, 8121, 2382) are shown at U.S. level where published. Cleaning vs landscaping cannot be separated inside 5617 at state level here.
- Not SBA outcomes: ABS measures whether firms applied and how much requested credit they report receiving — not SBA 7(a)/504 approval volumes or charge-offs.
FAQ
Is a high application rate “good”?
Not necessarily. Higher application rates can reflect growth, thin cash buffers, industry capital intensity, or lender outreach — not a quality score for a state.
Why aren’t cleaning and daycare broken out by state?
State×6-digit ABS credit cells are generally unpublished. We use 2-digit state tables and U.S. finer codes where Census releases them.
How is this different from SBA loan statistics?
SBA pages track government-guaranteed loan approvals and performance. This page tracks ABS survey reports of applying for and receiving any new credit.
Which state is the most small-business-friendly for credit?
This page is not a business-friendliness ranking. All-sector ABS application rates span only 8.5 percentage points — from 10.3% (Delaware and New York) to 18.8% (Iowa). High/low states flip by sector (e.g., South Dakota is low for admin & support but high for all sectors). Sector and firm-size spreads exceed the all-sector state range.
Which sectors apply for credit the most?
On this page’s U.S. ABS CREDAPP table, specialty trade contractors (NAICS 238) applied at 21.0% and construction (23) at 20.7%, vs all-sectors 13.0%. Child day care (6244) and personal care (8121) are lower at 9.1%. Larger employment size classes also apply more often (1–4 employees 10.0% → 100–249 at 23.3%).
Among applicants, who receives credit?
U.S. ABS CREDREC (among applicants): all sectors 82.3% received some or all; construction 84.0%; admin & support 82.0%; child day care 71.6% some/all (none: 14.5%). Receipt rates are survey reports for employer firms — not SBA approval odds.
Is this advice on how to get a business loan?
No. This page summarizes Census ABS who applied / who received credit by sector and state. It is not loan-application advice, credit-score guidance, or an SBA/Treasury how-to.