Original research · Census Annual Business Survey (ABS) 2024 · Reference year 2023 · Company Summary ownership · Employers only · Published September 16, 2026
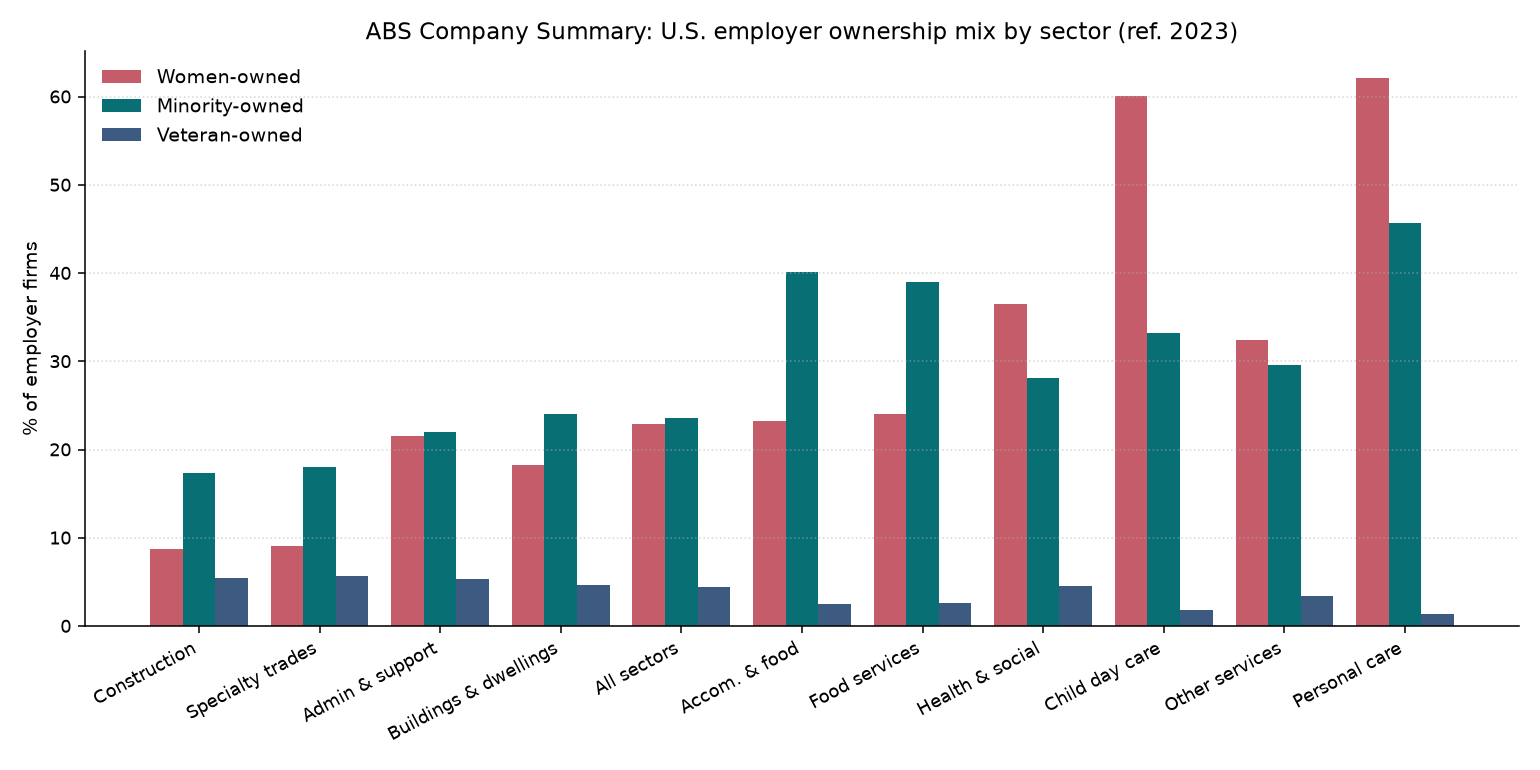
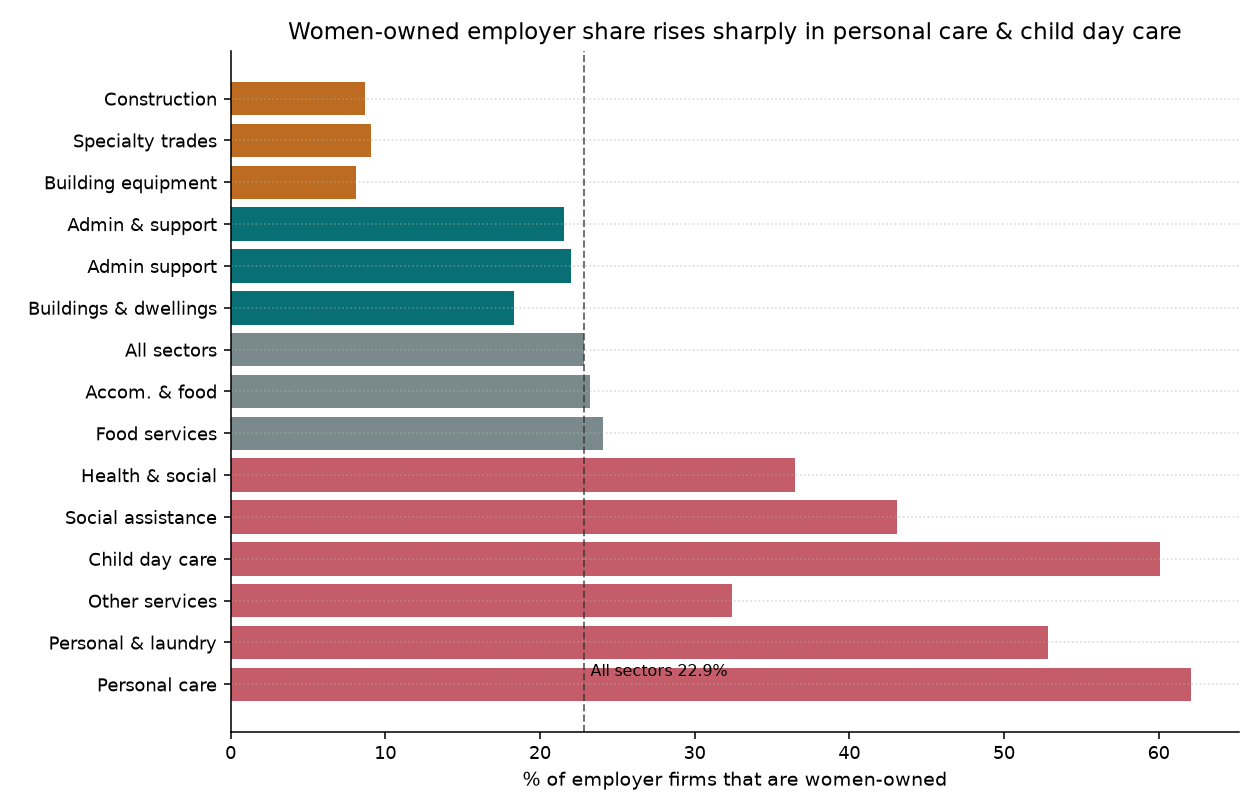
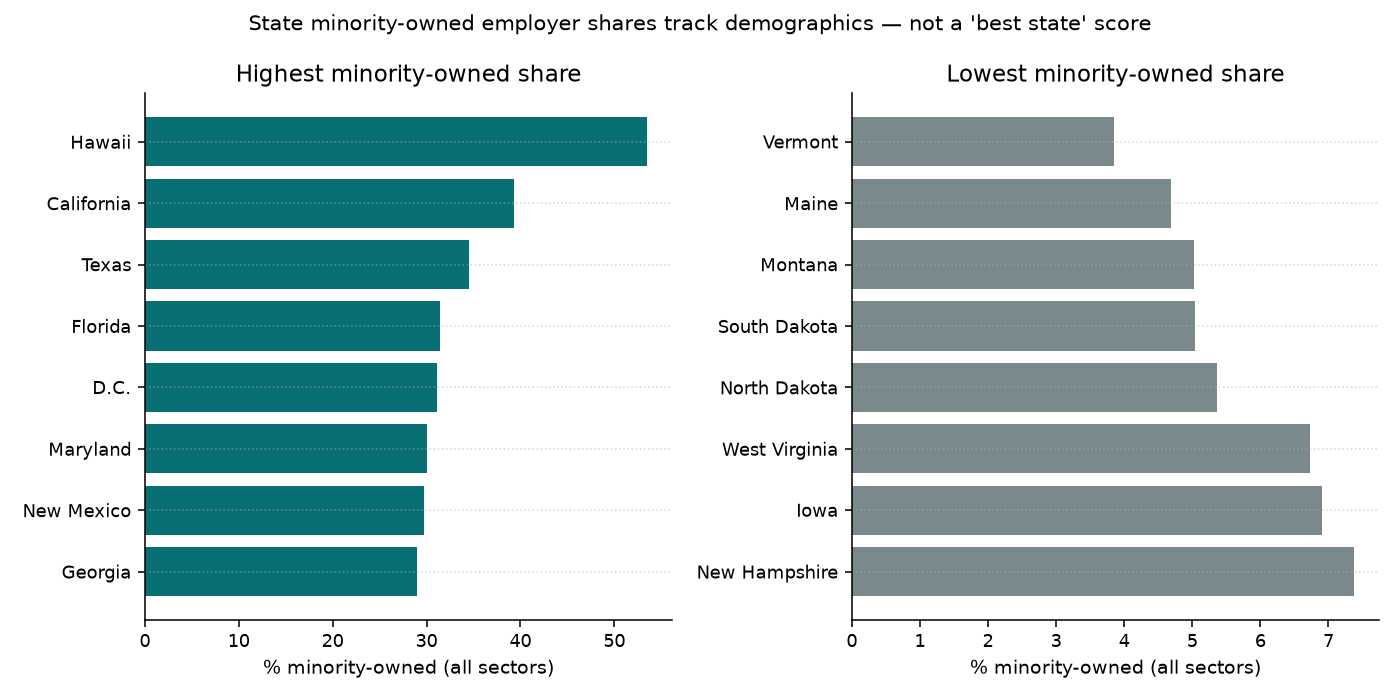
Who owns service employers? Ownership mix varies far more by industry than a simple “best state for women-owned businesses” headline suggests. Nationwide, about 22.9% of employer firms are women-owned, 23.6% minority-owned, and 4.4% veteran-owned — but personal care employers sit near 62.1% women-owned while construction sits near 8.7%. Minority shares at the all-sector state level largely track demographics (Hawaii ~53.5%; Vermont ~3.8%). This is ABS employer ownership — distinct from our employer credit-access study and from nonemployer pages.
Source: Census ABS Company Summary API (2023/abscs). Universe: employer firms only. Shares = owned employer firms ÷ all employer firms in the same geography × NAICS. Categories across sex / race / veteran status are not mutually exclusive. Suppressed cells are shown as em dashes — never imputed.
Key findings
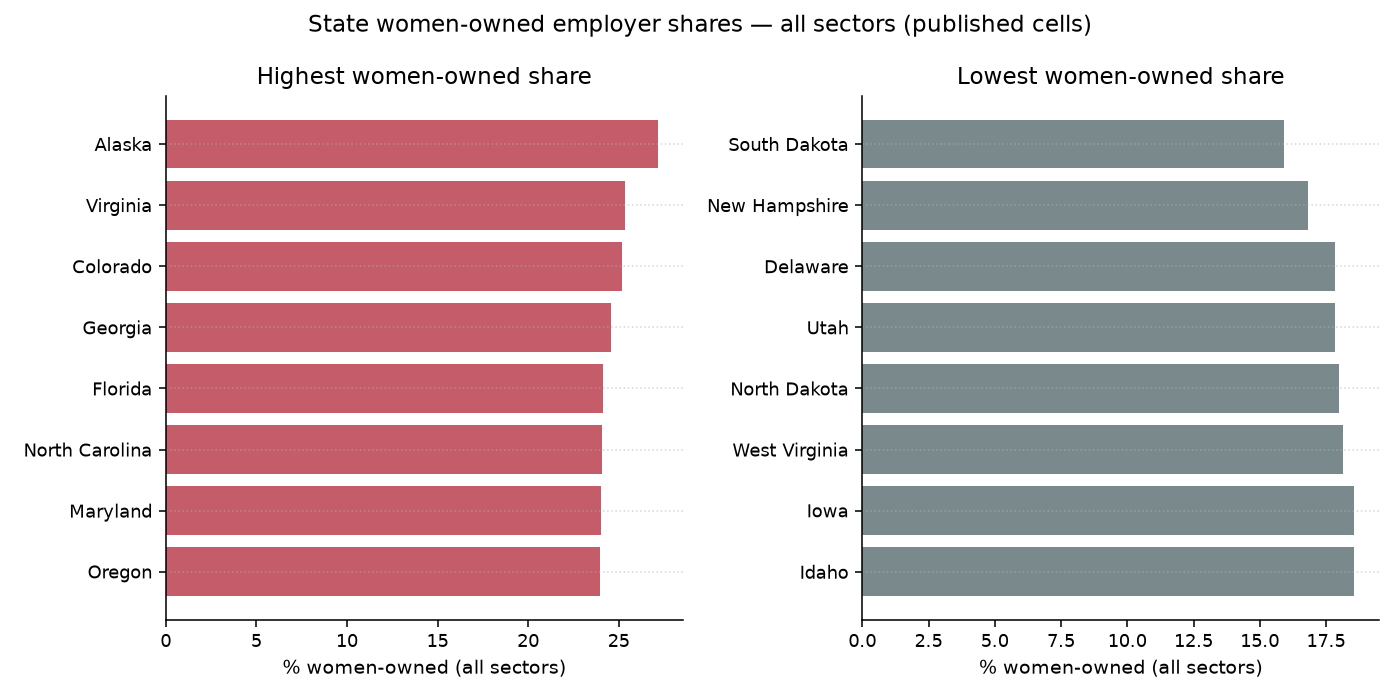
- Industry dominates women-owned shares. U.S. women-owned employer share is 22.9% overall, but 62.1% in personal care (8121), 60.1% in child day care (6244), 18.3% in services to buildings and dwellings (5617), and only 8.7% in construction (23). The U.S. 2-digit sector band for women (27.8 pp among focus sectors) is more than twice the all-sector state band (11.2 pp).
- Minority-owned shares at state level are mostly demographic. All-sector state minority shares span ~49.6 pp (3.8% in Vermont to 53.5% in Hawaii) — larger than the U.S. 2-digit industry band (22.8 pp). That does not make a state “best for minority owners”; it largely reflects population composition. Industry still matters: accommodation & food (40.1%) and personal care (45.6%) exceed construction (17.3%).
- Veteran-owned shares are low and relatively flat. About 4.4% of U.S. employer firms are veteran-owned. Focus 2-digit sectors only span ~2.9 pp; all-sector states ~4.6 pp. Child day care (1.9%) and personal care (1.3%) sit below construction (5.5%).
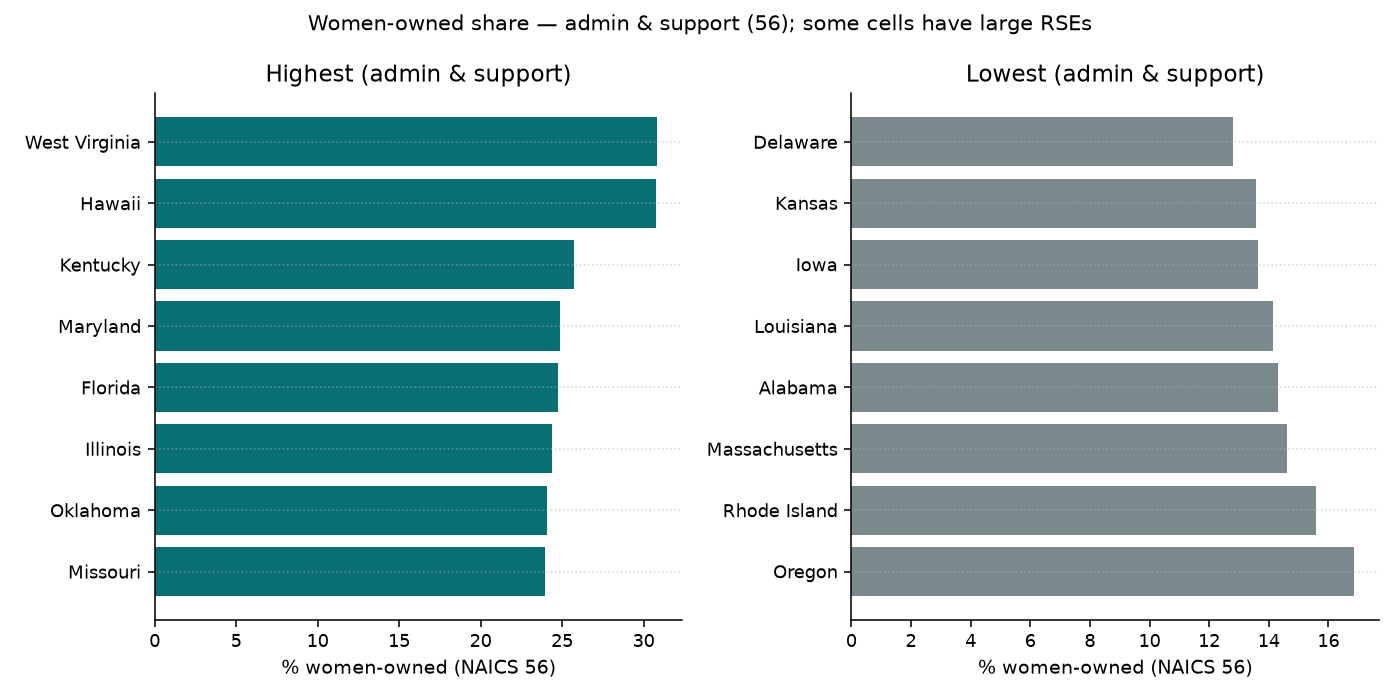
- State ranks flip by sector (when published). For women-owned shares, only Florida, Maryland overlap between the top-8 all-sector states and the top-8 admin & support (56) states. Sector leaders include Hawaii, Illinois, Kentucky, Missouri. Construction women-owned cells are heavily suppressed (28 of 51 states).
- Employers ≠ nonemployers. ABS Company Summary covers employer firms. Cleaning, landscaping, and salon markets are nonemployer-heavy — see nonemployer share by state. Credit behavior is a different ABS module: employer credit access by state.
Ownership mix by sector (U.S.)
| Sector | NAICS | Employer firms | Women-owned % | Minority-owned % | Veteran-owned % | Hispanic-owned % | Black-owned % | Asian-owned % |
|---|---|---|---|---|---|---|---|---|
| All sectors | 00 | 5,934,950 | 22.9% | 23.6% | 4.4% | 8.4% | 3.4% | 11.5% |
| Construction | 23 | 774,636 | 8.7% | 17.3% | 5.5% | 12.5% | 1.9% | 2.5% |
| Specialty trades | 238 | 501,671 | 9.1% | 18.0% | 5.6% | 13.6% | 1.9% | 2.0% |
| Building equipment | 2382 | 195,747 | 8.1% | 13.8% | 7.0% | — | — | — |
| Admin & support | 56 | 369,239 | 21.5% | 22.0% | 5.4% | 13.1% | 4.4% | 4.1% |
| Admin support | 561 | 346,145 | 22.0% | 22.5% | 5.3% | — | — | — |
| Buildings & dwellings | 5617 | 213,158 | 18.3% | 24.0% | 4.7% | 17.1% | 4.6% | 2.3% |
| Health & social | 62 | 683,909 | 36.5% | 28.1% | 4.5% | 6.3% | 7.7% | 13.8% |
| Social assistance | 624 | 138,057 | 43.1% | 25.0% | 1.9% | — | — | — |
| Child day care | 6244 | 60,837 | 60.1% | 33.2% | 1.9% | 11.4% | 15.1% | 7.3% |
| Other services | 81 | 410,671 | 32.4% | 29.6% | 3.4% | 9.0% | 3.4% | 17.1% |
| Personal & laundry | 812 | 220,878 | 52.8% | 38.4% | 2.0% | — | — | — |
| Personal care | 8121 | 136,707 | 62.1% | 45.6% | 1.3% | 7.9% | 4.2% | 33.6% |
| Accom. & food | 72 | 563,147 | 23.2% | 40.1% | 2.5% | 10.8% | 2.4% | 26.7% |
| Food services | 722 | 506,533 | 24.1% | 39.0% | 2.6% | — | — | — |
How to read ownership: Women-owned = SEX Female with other dimensions at Total. Minority-owned = RACE_GROUP Minority (includes Hispanic and non-White race categories per Census ABS). Veteran-owned = VET_GROUP Veteran. A firm can appear in more than one column. Hispanic / Black / Asian columns are shown for U.S. depth; they are not additive to “minority.”
State patterns (where published)
| State | Employer firms (all) | Women % (all) | Minority % (all) | Veteran % (all) | Women % constr. (23) | Women % admin (56) | Women % health/social (62) | Women % other svc (81) | Women % food (72) | Minority % admin (56) | Minority % food (72) |
|---|---|---|---|---|---|---|---|---|---|---|---|
| Alaska | 16,222 | 27.2% | 14.2% | 7.0% | — | — | — | 42.8% | 46.4% | 22.6% | 18.7% |
| Virginia | 147,928 | 25.3% | 26.6% | 6.9% | — | 22.9% | 40.5% | 36.6% | 24.1% | 20.2% | 45.7% |
| Colorado | 140,658 | 25.2% | 15.3% | 5.4% | 6.6% | 23.5% | 41.9% | 38.5% | 23.4% | 18.3% | 35.9% |
| Georgia | 188,525 | 24.6% | 28.9% | 5.2% | 10.4% | 22.5% | 37.6% | 35.1% | 25.7% | 21.4% | 52.7% |
| Florida | 500,294 | 24.1% | 31.5% | 4.7% | 8.9% | 24.7% | 37.4% | 34.0% | 20.9% | 29.8% | 42.4% |
| North Carolina | 181,475 | 24.1% | 17.0% | 5.5% | 10.4% | 22.1% | 39.7% | 33.5% | 20.8% | 16.9% | 33.8% |
| Maryland | 104,496 | 24.0% | 30.1% | 5.1% | — | 24.9% | 40.8% | 35.2% | 24.8% | — | 50.8% |
| Oregon | 91,384 | 24.0% | 15.7% | 4.0% | — | 16.9% | 37.9% | 30.2% | 29.6% | 19.2% | 35.2% |
| New Mexico | 32,406 | 23.9% | 29.8% | 6.0% | — | — | 39.1% | — | 19.9% | 37.1% | 48.4% |
| California | 791,791 | 23.9% | 39.3% | 3.1% | 7.1% | 21.5% | 36.9% | 31.3% | 24.6% | 40.8% | 61.8% |
| Hawaii | 23,211 | 23.7% | 53.5% | 4.8% | — | 30.8% | — | 39.5% | 23.6% | 52.8% | 66.1% |
| Washington | 153,111 | 23.7% | 21.9% | 4.1% | — | 23.5% | 38.5% | 40.4% | 26.4% | 26.2% | 44.5% |
| District of Columbia | 14,583 | 23.3% | 31.1% | 2.9% | — | — | — | — | 18.5% | 23.0% | 45.0% |
| Arizona | 119,314 | 23.0% | 20.6% | — | 8.4% | 17.4% | 34.3% | 32.5% | 24.8% | 20.7% | 42.6% |
| New York | 427,227 | 23.0% | 25.4% | 2.7% | 8.9% | 20.7% | 38.2% | 37.7% | 24.0% | 22.4% | 38.6% |
| South Carolina | 86,169 | 22.9% | 15.4% | 7.3% | — | 20.7% | 36.9% | 32.8% | 22.9% | 14.8% | 32.6% |
| Nevada | 59,486 | 22.8% | 26.4% | 4.6% | 11.2% | 19.8% | 31.7% | 29.0% | 23.6% | 23.8% | 39.3% |
| Texas | 470,732 | 22.8% | 34.5% | 4.8% | 11.8% | 22.3% | 35.0% | 28.1% | 19.9% | 29.2% | 54.2% |
| Illinois | 238,091 | 22.2% | 21.1% | 3.4% | — | 24.4% | 40.8% | 29.6% | 22.1% | 25.4% | 36.8% |
| Missouri | 102,850 | 22.0% | 11.9% | 4.7% | 10.2% | 23.9% | 34.6% | 28.0% | 22.9% | 9.4% | 27.3% |
| Montana | 34,269 | 21.2% | 5.0% | 4.8% | 6.2% | — | 40.3% | 25.4% | 30.8% | 7.4% | 13.8% |
| Minnesota | 110,485 | 21.1% | 10.7% | 4.1% | — | 21.4% | 38.2% | 29.9% | 24.3% | 16.0% | 26.9% |
| Wyoming | 19,113 | 21.1% | 9.1% | 6.1% | — | — | 30.1% | — | 22.3% | — | 20.6% |
| Mississippi | 41,925 | 20.9% | 13.6% | — | — | — | 36.8% | 17.4% | — | — | 36.1% |
| Oklahoma | 69,555 | 20.8% | 17.8% | 5.4% | 9.2% | 24.1% | 32.2% | 31.8% | 22.2% | 19.2% | 38.4% |
| Michigan | 163,461 | 20.7% | 10.5% | 3.8% | — | 18.7% | 38.4% | 27.3% | 21.1% | 9.5% | 19.3% |
| New Jersey | 185,622 | 20.7% | 28.2% | 2.7% | 7.7% | 18.7% | 33.4% | 36.9% | 19.2% | 22.1% | 37.2% |
| Ohio | 170,013 | 20.6% | 11.7% | 5.1% | 10.5% | 17.8% | 32.9% | 32.6% | 22.4% | — | 25.3% |
| Louisiana | 77,611 | 20.6% | 14.6% | 5.3% | — | 14.1% | 34.0% | 25.5% | — | — | 29.7% |
| Massachusetts | 137,011 | 20.6% | 16.7% | 4.0% | 8.2% | 14.6% | 32.4% | 42.6% | 23.3% | 12.8% | 32.4% |
| Indiana | 103,466 | 20.3% | 12.2% | 4.3% | 8.5% | 21.5% | 32.5% | 26.4% | 24.3% | 12.6% | 28.7% |
| Pennsylvania | 212,827 | 20.3% | 14.0% | 3.8% | 8.1% | 20.9% | 34.7% | 32.8% | 21.1% | 9.8% | 28.7% |
| Vermont | 16,582 | 20.1% | 3.8% | 3.7% | — | — | — | 22.7% | — | — | 17.7% |
| Maine | 32,944 | 20.0% | 4.7% | 5.8% | — | — | 41.6% | 29.9% | 24.3% | — | 13.7% |
| Kansas | 52,627 | 19.9% | 11.5% | 4.6% | 9.4% | 13.6% | 29.6% | — | 23.3% | — | 38.9% |
| Rhode Island | 23,020 | 19.9% | 13.7% | 3.9% | — | 15.6% | 45.5% | — | 18.0% | 17.1% | 23.4% |
| Connecticut | 65,346 | 19.8% | 15.8% | 3.3% | — | 17.3% | 34.2% | 30.2% | 20.2% | 13.5% | 27.4% |
| Wisconsin | 101,315 | 19.5% | 9.3% | 3.8% | — | 17.5% | 37.1% | 30.0% | 24.6% | 10.5% | 17.9% |
| Arkansas | 49,201 | 19.5% | 11.8% | 5.9% | — | — | 33.9% | — | — | — | 37.3% |
| Tennessee | 96,320 | 19.4% | 14.2% | 5.8% | 10.3% | 16.9% | 28.4% | 30.5% | 21.4% | 9.8% | 40.7% |
| Nebraska | 41,718 | 18.8% | 7.8% | 5.0% | — | 23.2% | 33.0% | 20.6% | 26.0% | 11.2% | 20.2% |
| Alabama | 70,676 | 18.7% | 14.9% | 6.0% | 6.3% | 14.3% | 30.9% | 22.0% | 21.2% | 11.4% | 41.1% |
| Idaho | 46,244 | 18.6% | 9.1% | 4.9% | 7.9% | 18.0% | 27.6% | 23.1% | 28.5% | 11.9% | 18.5% |
| Iowa | 57,666 | 18.6% | 6.9% | 4.8% | — | 13.6% | 31.3% | — | 27.5% | — | — |
| West Virginia | 22,945 | 18.1% | 6.7% | 6.4% | 4.6% | 30.8% | 22.7% | 26.1% | — | 4.7% | 20.5% |
| North Dakota | 18,519 | 18.0% | 5.4% | 5.5% | — | — | 37.5% | — | 18.9% | 3.8% | 18.9% |
| Utah | 76,759 | 17.9% | 11.0% | 3.1% | — | 19.4% | 20.2% | 34.9% | 19.2% | 13.9% | 33.5% |
| Delaware | 22,350 | 17.8% | 20.2% | 3.8% | — | 12.8% | 31.6% | 30.1% | 15.9% | 19.3% | — |
| New Hampshire | 29,391 | 16.8% | 7.4% | 5.7% | — | — | — | 32.3% | 16.9% | — | 18.5% |
| South Dakota | 22,507 | 15.9% | 5.0% | 6.8% | — | — | 27.0% | — | 29.1% | — | 19.2% |
| Kentucky | 62,546 | — | 10.8% | 4.7% | 8.0% | 25.8% | 30.5% | — | 21.3% | — | 29.5% |
State names link to each state’s hub. Suppression counts (ownership share cells): construction women 28/51; admin & support women 12, minority 13, veteran 20; other services veteran 35/51.
Hypothesis check — industry vs “best state for X owners”
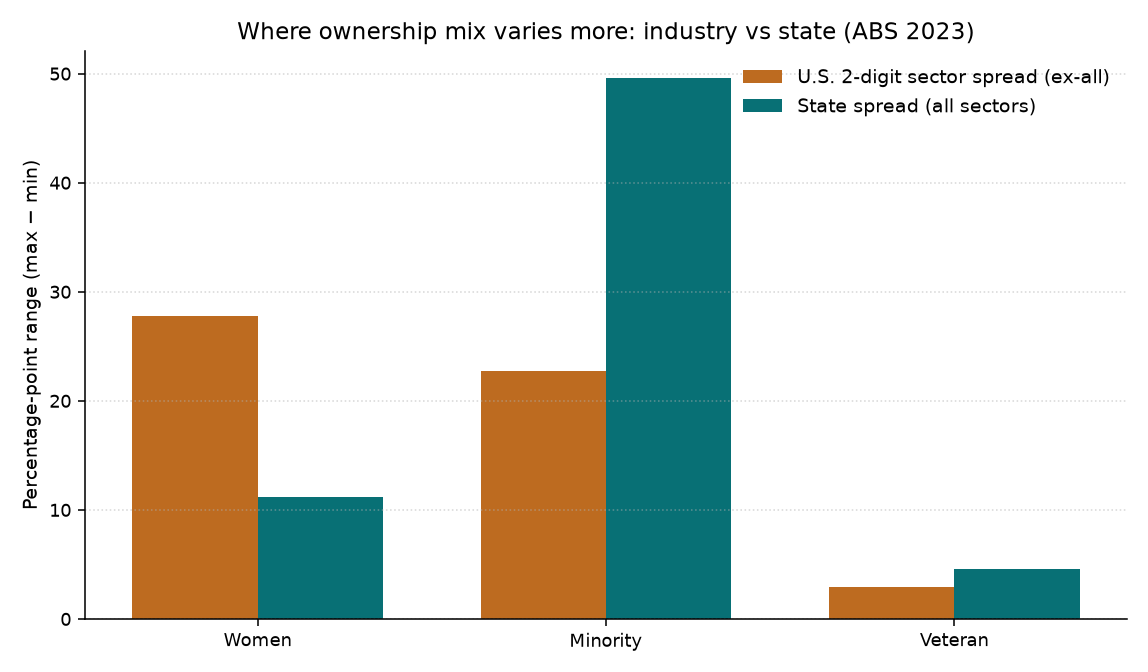
We hypothesized that ownership mix varies more by industry than by a simple “best state for X-owned businesses” narrative. For women-owned employers, that holds cleanly: the U.S. sector band (27.8 pp) dwarfs the all-sector state band (11.2 pp), and state leaderboards flip when you switch from all sectors to admin & support. For minority-owned employers, all-sector state spreads are large (49.6 pp) — but they track demographics more than a transferable “best state” brand, and industry gaps remain large (personal care / food vs construction). Veteran-owned shares stay low and comparatively flat on both axes. This page is deliberately not a best-state scorecard.
Downloads
- State × sector ownership CSV (women / minority / veteran; suppressed flagged)
- State all-sectors ownership CSV
- U.S. sector ownership CSV
What this means for planning
Ownership demographics describe who runs employer firms in a sector — not who should start one, and not credit outcomes. Useful companions:
- Industry guides: cleaning · landscaping · HVAC · daycare · hair salon
- Employer credit behavior (different ABS module): small business credit access by state
- Structure context: nonemployer share by state · business formation statistics · SBA loan statistics
- Income maps (different tax universes): sole prop net profit by state · partnership ordinary income by state
- Insurance is a separate decision: cleaning insurance · daycare insurance · landscaping insurance · HVAC insurance
Methods and limitations
- Survey: Census Annual Business Survey, collection year 2024, reference year 2023. API dataset
abscs(Company Summary). - Ownership slices: Women = SEX
002; Minority = RACE_GROUP90; Veteran = VET_GROUP002; each with other ownership dimensions held at Total (001/00). - Share: Owned employer firms ÷ all employer firms (same geo × NAICS) × 100. We do not use receipt- or employment-weighted ownership here.
- Universe: Employer firms in ABS. Nonemployers and many Schedule C operators are out of scope.
- Suppression & error:
FIRMPDEMP_F = S(and missing firm counts) → em dash. Relative standard errors (FIRMPDEMP_S) retained in downloads; thin state×sector cells can be noisy. - Industry grain: State tables use 2-digit NAICS (
00,23,56,62,81,72). Finer codes (5617, 6244, 8121, 238, 722, …) are U.S.-level. State×6-digit ownership generally fails / is unpublished. - Not credit access: Ownership demographics ≠ CREDAPP/CREDREC financing behavior. See the companion credit page for apply/receive rates.
- Not a ranking product: High minority shares in Hawaii or California are demographic facts, not endorsements.
FAQ
Can shares exceed 100% across columns?
No single firm is counted twice inside one column, but the same firm can be women-owned and minority-owned (different columns). Columns are not designed to sum to 100%.
Why is construction women-owned often “—” by state?
Census suppresses many state×construction×women cells. We show U.S. construction / specialty-trade detail and leave state cells blank when flagged.
How is this different from the credit-access page?
Credit access uses ABS Module Business Characteristics (CREDAPP/CREDREC). This page uses Company Summary ownership characteristics. Same ABS program year; different questions and tables.