Original data analysis · Published October 16, 2026
A power bill tells you what electricity costs. It does not tell you how long you might have to run without it. In 2025, utilities using the IEEE reporting method recorded 16.89 average outage hours per customer in West Virginia and 14.59 in Virginia, including major events.
Removing major-event days cut those averages to 8.30 and 4.73 hours. This study compares reliability across the 50 states and D.C., using one reporting method and showing how much of each state’s reported customer base it covers. The figures cover all customer classes; they are not measured downtime for businesses alone.
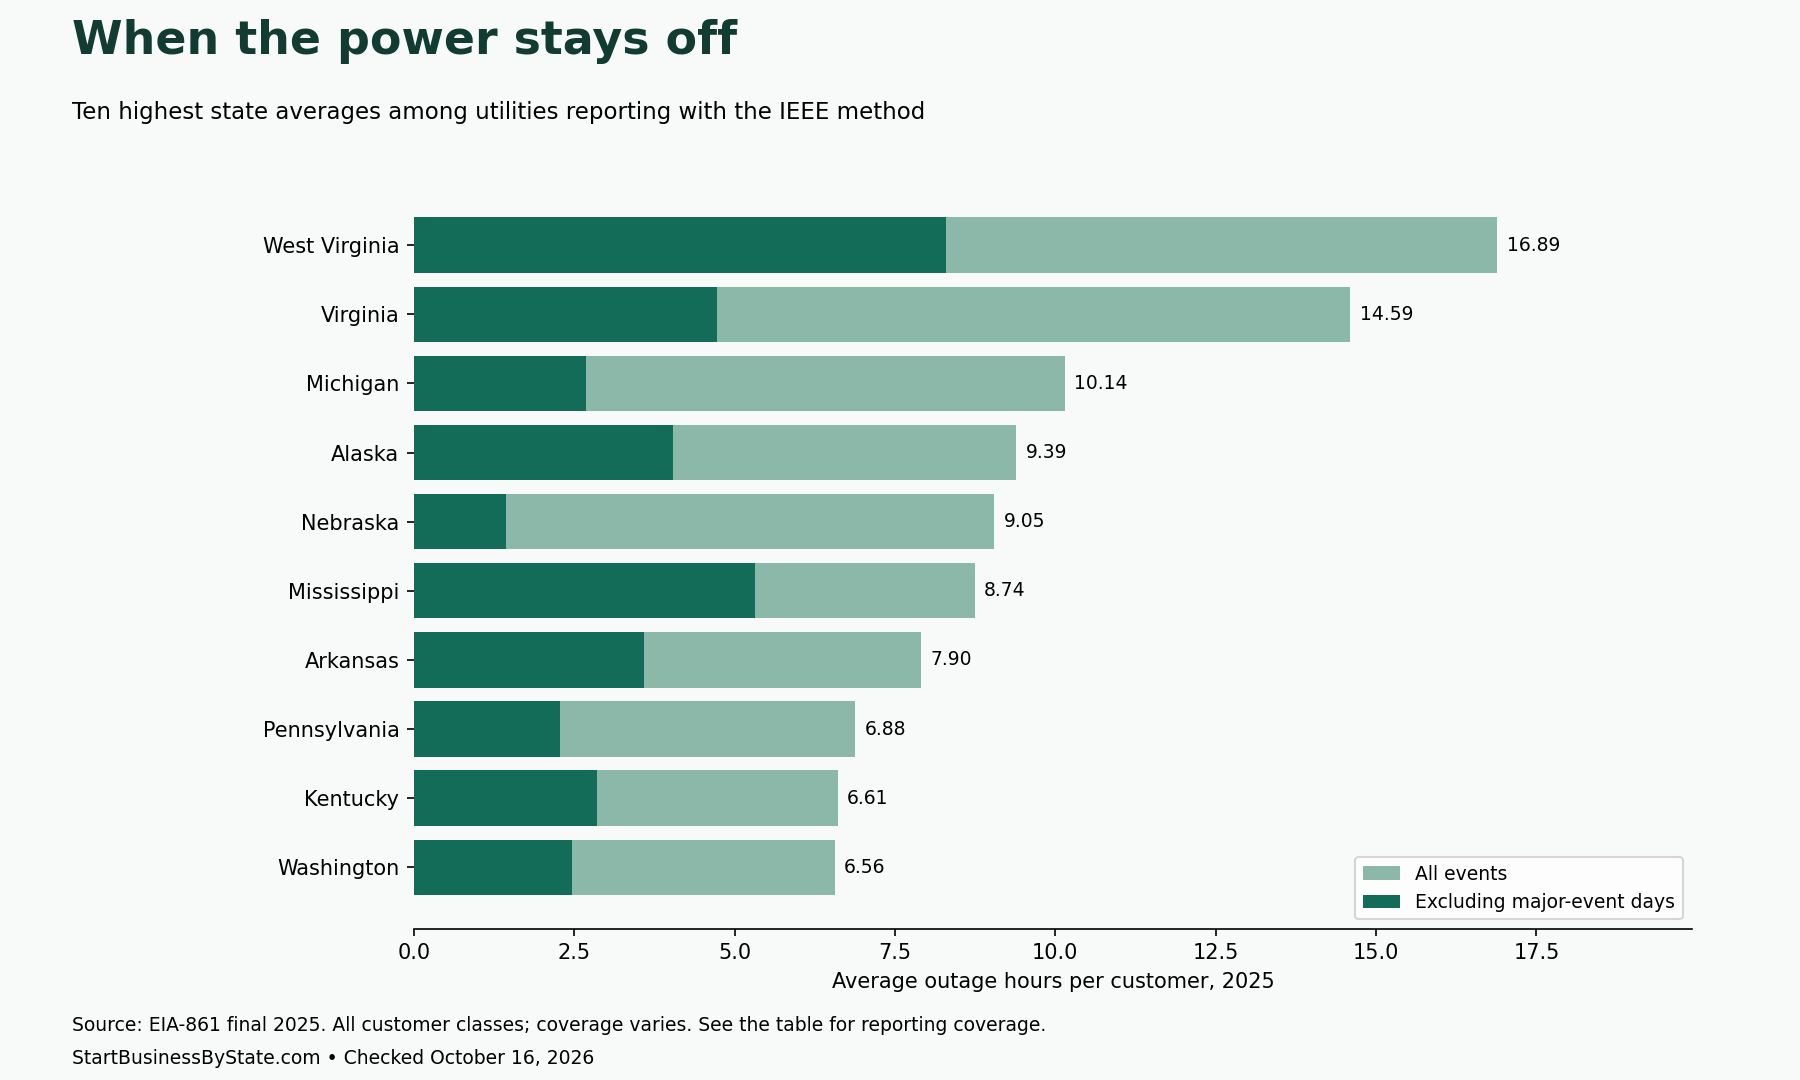
The storm year and the ordinary year tell different stories
In Virginia, excluding major-event days reduces the annual average by 9.86 hours, about 68%. In West Virginia, it reduces the average by 8.59 hours, about 51%. Both views matter: major events drive resilience planning, while the remaining interruptions describe a different part of service reliability.
“Major event” is a reporting classification. It should not be read as a complete list of hurricane outages, nor should the difference between the columns be treated as the downtime at any particular storefront.
How many hours was the power off?
Coverage matters. The last column compares IEEE-method customers with all customers reported in EIA’s any-method reliability column. Alabama’s IEEE group represents about 22% of that reported total, for example. This is not the percentage of every customer in the state, and a low-coverage result should not be presented as a statewide business downtime estimate.
| State | Hours: all events | Hours: no major-event days | IEEE customers | IEEE share of reported customers |
|---|---|---|---|---|
| West Virginia | 16.89 | 8.30 | 1,005,288 | 100.0% |
| Virginia | 14.59 | 4.73 | 1,087,610 | 28.4% |
| Michigan | 10.14 | 2.68 | 4,826,558 | 96.8% |
| Alaska | 9.39 | 4.04 | 286,815 | 94.5% |
| Nebraska | 9.05 | 1.43 | 757,833 | 89.5% |
| Mississippi | 8.74 | 5.31 | 1,110,277 | 89.2% |
| Arkansas | 7.90 | 3.58 | 1,364,584 | 91.7% |
| Pennsylvania | 6.88 | 2.27 | 5,335,766 | 89.3% |
| Kentucky | 6.61 | 2.85 | 2,274,187 | 97.2% |
| Washington | 6.56 | 2.46 | 3,313,967 | 94.3% |
| Missouri | 6.31 | 1.90 | 1,335,817 | 90.7% |
| Maine | 6.06 | 3.19 | 864,575 | 100.0% |
| California | 5.98 | 2.33 | 15,045,322 | 94.5% |
| Indiana | 5.81 | 2.05 | 2,959,607 | 96.1% |
| Hawaii | 5.59 | 3.37 | 35,470 | 7.0% |
| Idaho | 5.11 | 2.39 | 882,930 | 97.9% |
| Oklahoma | 4.96 | 2.12 | 1,016,793 | 51.0% |
| Montana | 4.77 | 2.26 | 510,555 | 96.7% |
| South Dakota | 4.74 | 1.06 | 381,659 | 94.0% |
| Colorado | 4.61 | 1.98 | 2,756,109 | 98.5% |
| Alabama | 4.50 | 2.12 | 444,191 | 21.6% |
| Georgia | 4.49 | 2.42 | 4,833,981 | 98.0% |
| Louisiana | 4.47 | 3.77 | 1,688,572 | 76.8% |
| Wisconsin | 4.40 | 1.46 | 2,414,692 | 80.5% |
| Wyoming | 4.36 | 2.29 | 113,632 | 87.1% |
| Oregon | 4.32 | 1.63 | 1,246,335 | 91.4% |
| Vermont | 4.19 | 2.51 | 40,952 | 12.0% |
| New York | 3.98 | 2.30 | 1,724,765 | 20.9% |
| Tennessee | 3.81 | 2.46 | 2,580,328 | 91.9% |
| Texas | 3.70 | 2.64 | 8,731,436 | 64.2% |
| Connecticut | 3.57 | 1.44 | 1,385,474 | 98.2% |
| North Dakota | 3.53 | 1.25 | 412,043 | 94.5% |
| Ohio | 3.42 | 2.17 | 5,601,440 | 99.9% |
| North Carolina | 3.26 | 2.42 | 5,201,957 | 94.3% |
| Kansas | 3.22 | 1.61 | 1,267,210 | 97.1% |
| Maryland | 3.06 | 1.33 | 2,487,001 | 100.0% |
| Iowa | 3.05 | 1.33 | 915,285 | 62.2% |
| Rhode Island | 3.05 | 1.00 | 514,651 | 100.0% |
| Minnesota | 3.03 | 1.55 | 2,546,148 | 97.7% |
| New Mexico | 2.70 | 2.38 | 960,611 | 95.8% |
| New Jersey | 2.58 | 1.59 | 4,301,741 | 98.3% |
| South Carolina | 2.55 | 1.72 | 2,905,071 | 96.7% |
| New Hampshire | 2.51 | 1.43 | 683,695 | 88.9% |
| Illinois | 2.42 | 1.03 | 5,775,618 | 98.4% |
| Nevada | 2.13 | 1.68 | 1,565,800 | 100.0% |
| Massachusetts | 2.04 | 1.26 | 3,029,594 | 98.2% |
| Utah | 1.88 | 1.33 | 193,379 | 82.2% |
| Delaware | 1.73 | 1.18 | 133,933 | 93.6% |
| Arizona | 1.22 | 1.07 | 2,924,292 | 98.4% |
| Florida | 1.20 | 1.08 | 10,051,587 | 85.6% |
| District of Columbia | 0.84 | 0.56 | 347,904 | 100.0% |
What a business can take from the comparison
Start a continuity conversation with the loads that matter: refrigeration, payment systems, network equipment, lighting or essential machinery. Ask the serving utility about local service history and an appropriately licensed contractor about the equipment and installation. A state average cannot size a generator or establish a building’s electrical capacity.
For an electrical business, reliability is a service-planning angle alongside installation and repair. It is not a count of ready-to-buy leads. Describe the assessment, installation and ongoing support you can deliver rather than promising a customer that a particular system will eliminate every outage.
Source and method
Checked October 16, 2026. Source: EIA Form 861 final annual files, 2025 archive, Reliability_2025.xlsx, State Totals worksheet. We use the IEEE-method customer counts and SAIDI measures for all events and excluding major-event days. SAIDI is the average interruption duration per customer; minutes are divided by 60.
We reproduce EIA’s state aggregates rather than averaging utility percentages. Reporting coverage = IEEE-method customers ÷ customers in the any-method reliability column. That denominator is the reported reliability population, not independently measured total state customers. All-method duration figures are not mixed into the comparison. Missing values remain missing; no business-only revenue loss, outage cost, future risk or insurance entitlement is estimated.
Cite this study
StartBusinessByState.com. “Open for Business. Waiting for the Power to Come Back.” Published October 16, 2026. https://startbusinessbystate.com/business-power-outages-by-state/.
Our original analysis and graphic are available under CC BY 4.0. Credit this study and link to this page when reusing them. Underlying source materials retain their own terms and remain available from the original agencies. This permission applies to our original analysis and graphic, not to the source publications.
Embed the chart with a credit link
<figure><a href="https://startbusinessbystate.com/business-power-outages-by-state/"><img src="https://startbusinessbystate.com/wp-content/uploads/2026/10/business-power-outages-by-state.png" alt="Open for Business. Waiting for the Power to Come Back." style="max-width:100%;height:auto"></a><figcaption>Source: <a href="https://startbusinessbystate.com/business-power-outages-by-state/">StartBusinessByState.com</a></figcaption></figure>