Original research · Census building permits + BLS QCEW · Last updated October 6, 2026
Data through: building permits through August 2026; employment through March 2026 (QCEW, the latest quarter); national starts and completions through August 2026.
Permits and builder payrolls are moving apart. States permitted 963,301 new private housing units from January through August 2026, up 0.3% from a year earlier, and 26 of 51 states saw permits fall. But new single-family builders employed 4.5% fewer people in March 2026 than a year before. Completions fell to a 1.13 million annual rate in August, down 27.1% from a year earlier.
Key findings
- Builder jobs fell in 41 of 49 states. Private employment at new single-family general contractors (NAICS 236115) fell 16,343 nationally, to 346,538 in March 2026. The biggest drops: West Virginia (−13.2%), Delaware (−13.2%) and New Mexico (−12.6%).
- Permits fell in 26 of 51 states. The steepest declines through August: Connecticut (−24.0%), Nevada (−20.3%) and Vermont (−16.4%). The biggest gains: New York (+49.4%) and Rhode Island (+42.7%).
- 23 states lost both permits and builder jobs. They include Connecticut, Nevada, Vermont, North Dakota and Florida.
- Plumbing and HVAC contractors kept hiring. Their private employment (NAICS 23822) rose 1.9% to 1,318,978. Only 12 of 51 states lost jobs in this trade. Repair, replacement and service work doesn’t depend on new houses.
- Completions dropped 27.1% in a year. Builders finished homes at a 1.13 million annual rate in August 2026, against 1.55 million a year earlier. Starts ran at 1.27 million and permits at 1.40 million.
Do building permits match builder hiring?
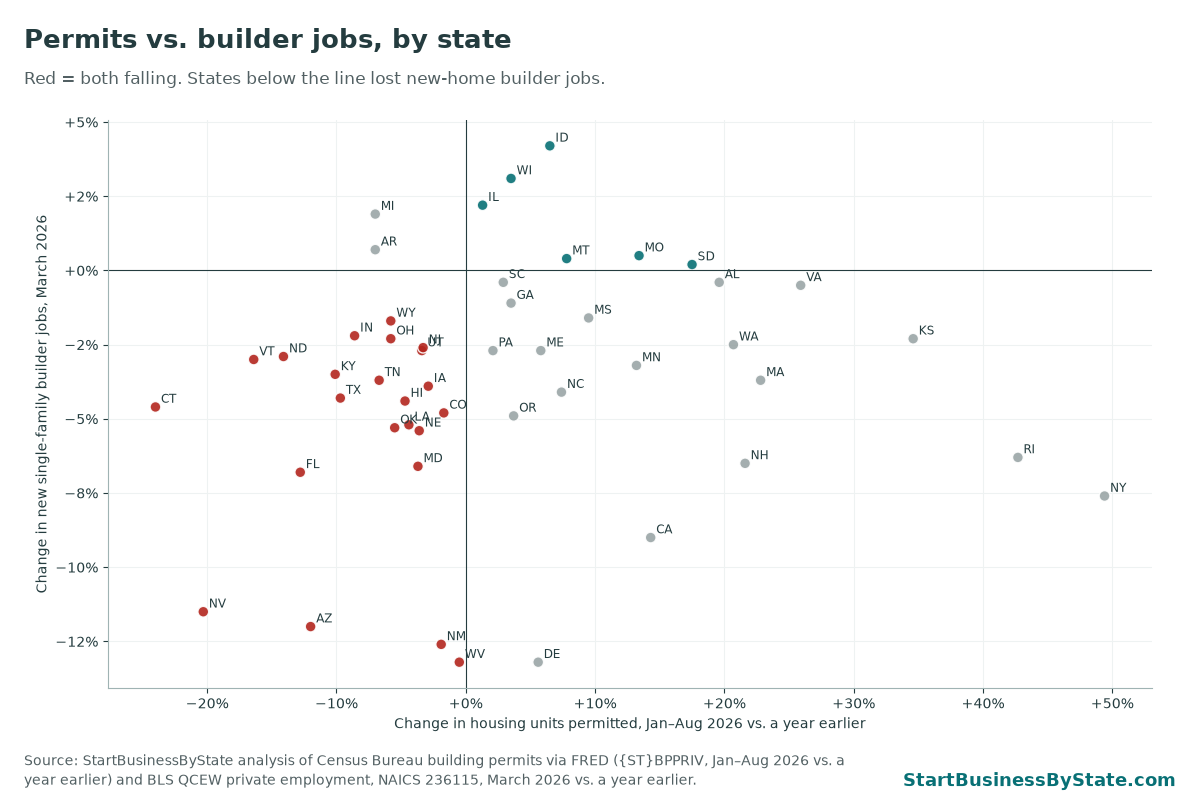
If permits and jobs moved together, the dots would line up from bottom left to top right. They don’t. Most states sit below the zero line on jobs, whichever way their permits went. Permits run ahead of construction by months, and builders have been finishing fewer homes.
Housing permits and builder jobs in every state
Click a column header to sort. A dash means BLS suppressed the number to protect the privacy of individual employers.
| Rank | State | Units permitted, Jan–Aug 2026 | Permit change vs. year ago | New single-family builder jobs, March 2026 | Change | For-sale builder jobs, change | Plumbing & HVAC jobs, March 2026 | Change |
|---|---|---|---|---|---|---|---|---|
| 1 | Connecticut | 3,518 | −24.0% | 1,404 | −4.6% | −3.2% | 12,695 | +0.5% |
| 2 | Nevada | 9,528 | −20.3% | 2,143 | −11.5% | −2.1% | 16,794 | +5.3% |
| 3 | Vermont | 1,105 | −16.4% | 1,800 | −3.0% | — | 2,667 | +8.8% |
| 4 | North Dakota | 1,563 | −14.1% | 955 | −2.9% | — | 4,002 | +7.0% |
| 5 | Florida | 106,945 | −12.8% | 34,491 | −6.8% | −5.3% | 105,517 | −0.4% |
| 6 | Arizona | 29,734 | −12.0% | 10,187 | −12.0% | −4.8% | 36,123 | −1.5% |
| 7 | Alaska | 562 | −11.5% | — | — | −5.9% | 2,051 | +2.3% |
| 8 | Kentucky | 9,183 | −10.1% | 1,787 | −3.5% | −1.7% | 18,060 | +2.7% |
| 9 | Texas | 131,692 | −9.7% | 36,494 | −4.3% | −3.5% | 124,422 | +4.3% |
| 10 | Indiana | 18,729 | −8.6% | 6,009 | −2.2% | −7.8% | 32,529 | +7.9% |
| 11 | Michigan | 14,427 | −7.0% | 7,938 | +1.9% | +3.2% | 33,142 | +3.2% |
| 12 | Arkansas | 9,605 | −7.0% | 2,600 | +0.7% | +14.2% | 11,307 | −0.3% |
| 13 | Tennessee | 28,115 | −6.7% | 6,482 | −3.7% | −2.2% | 28,737 | −0.5% |
| 14 | Ohio | 21,484 | −5.8% | 6,296 | −2.3% | +2.7% | 46,737 | +4.0% |
| 15 | Wyoming | 1,277 | −5.8% | 1,847 | −1.7% | −39.8% | 2,517 | +4.0% |
| 16 | Oklahoma | 10,005 | −5.5% | 1,891 | −5.3% | +28.2% | 16,127 | +1.5% |
| 17 | Hawaii | 2,389 | −4.7% | 2,884 | −4.4% | −12.7% | 5,040 | +1.0% |
| 18 | Louisiana | 9,491 | −4.4% | 1,685 | −5.2% | +2.9% | 15,754 | +3.8% |
| 19 | Maryland | 9,616 | −3.7% | 3,012 | −6.6% | −7.2% | 31,099 | +1.5% |
| 20 | Nebraska | 7,028 | −3.6% | 1,617 | −5.4% | +6.8% | 11,112 | +3.3% |
| 21 | Utah | 16,124 | −3.4% | 8,910 | −2.7% | −7.1% | 17,248 | +0.0% |
| 22 | New Jersey | 20,527 | −3.3% | 8,137 | −2.6% | −4.8% | 30,515 | +0.1% |
| 23 | Iowa | 8,831 | −2.9% | 2,949 | −3.9% | +1.8% | 17,147 | +10.5% |
| 24 | New Mexico | 5,241 | −1.9% | 1,966 | −12.6% | +12.1% | 7,452 | +6.6% |
| 25 | Colorado | 21,232 | −1.7% | 6,722 | −4.8% | −14.5% | 27,611 | −2.7% |
| 26 | West Virginia | 2,719 | −0.5% | 1,758 | −13.2% | +38.9% | 4,409 | +4.5% |
| 27 | Illinois | 13,369 | +1.3% | 6,167 | +2.2% | +3.9% | 40,444 | +3.2% |
| 28 | Pennsylvania | 17,259 | +2.1% | 8,117 | −2.7% | +3.6% | 46,544 | +2.4% |
| 29 | South Carolina | 33,059 | +2.9% | 6,370 | −0.4% | −1.9% | 18,625 | +4.1% |
| 30 | Wisconsin | 16,819 | +3.5% | 5,913 | +3.1% | +3.4% | 25,772 | +4.7% |
| 31 | Georgia | 42,207 | +3.5% | 10,042 | −1.1% | −3.8% | 39,279 | +3.7% |
| 32 | Oregon | 9,842 | +3.7% | 10,217 | −4.9% | −6.3% | 15,550 | −5.4% |
| 33 | Delaware | 4,583 | +5.6% | 1,476 | −13.2% | +7.0% | 5,446 | +6.9% |
| 34 | Maine | 4,769 | +5.8% | 2,889 | −2.7% | — | 5,476 | −0.9% |
| 35 | Idaho | 13,094 | +6.5% | 4,330 | +4.2% | +0.2% | 11,284 | +13.6% |
| 36 | North Carolina | 64,183 | +7.4% | 20,056 | −4.1% | +5.1% | 51,062 | +3.5% |
| 37 | Montana | 3,752 | +7.8% | 3,853 | +0.4% | +7.0% | 5,483 | +5.6% |
| 38 | Mississippi | 5,837 | +9.5% | 1,003 | −1.6% | +0.0% | 8,766 | +3.0% |
| 39 | Minnesota | 15,835 | +13.2% | 5,039 | −3.2% | −3.3% | 21,957 | +1.9% |
| 40 | Missouri | 12,831 | +13.4% | 4,286 | +0.5% | −5.5% | 24,494 | +5.3% |
| 41 | California | 75,156 | +14.3% | 41,916 | −9.0% | −9.1% | 123,664 | −1.4% |
| 42 | South Dakota | 4,436 | +17.5% | 2,000 | +0.2% | — | 4,441 | −0.6% |
| 43 | Alabama | 14,326 | +19.6% | 3,124 | −0.4% | −10.4% | 19,200 | +2.5% |
| 44 | Washington | 26,817 | +20.7% | 16,377 | −2.5% | −5.1% | 29,444 | −0.2% |
| 45 | New Hampshire | 3,361 | +21.6% | 1,786 | −6.5% | +10.8% | 6,042 | +2.6% |
| 46 | Massachusetts | 9,280 | +22.8% | 4,955 | −3.7% | +0.9% | 31,122 | −0.6% |
| 47 | Virginia | 28,600 | +25.9% | 7,956 | −0.5% | −1.2% | 37,159 | +2.8% |
| 48 | Kansas | 9,037 | +34.6% | 2,116 | −2.3% | −9.3% | 13,154 | +1.8% |
| 49 | District of Columbia | 1,466 | +35.6% | — | — | −13.6% | 1,866 | +4.0% |
| 50 | Rhode Island | 1,496 | +42.7% | 926 | −6.3% | +21.6% | 4,624 | +1.7% |
| 51 | New York | 31,217 | +49.4% | 12,784 | −7.6% | −0.5% | 67,266 | −0.3% |
Permits: new privately owned housing units authorized, all structure types, not seasonally adjusted. Jobs: private employment in the third month of the quarter. New single-family builders = NAICS 236115; for-sale builders (who build on their own land) = 236117; plumbing and HVAC contractors = 23822.
Download the data (CSV)Are housing starts and completions falling?
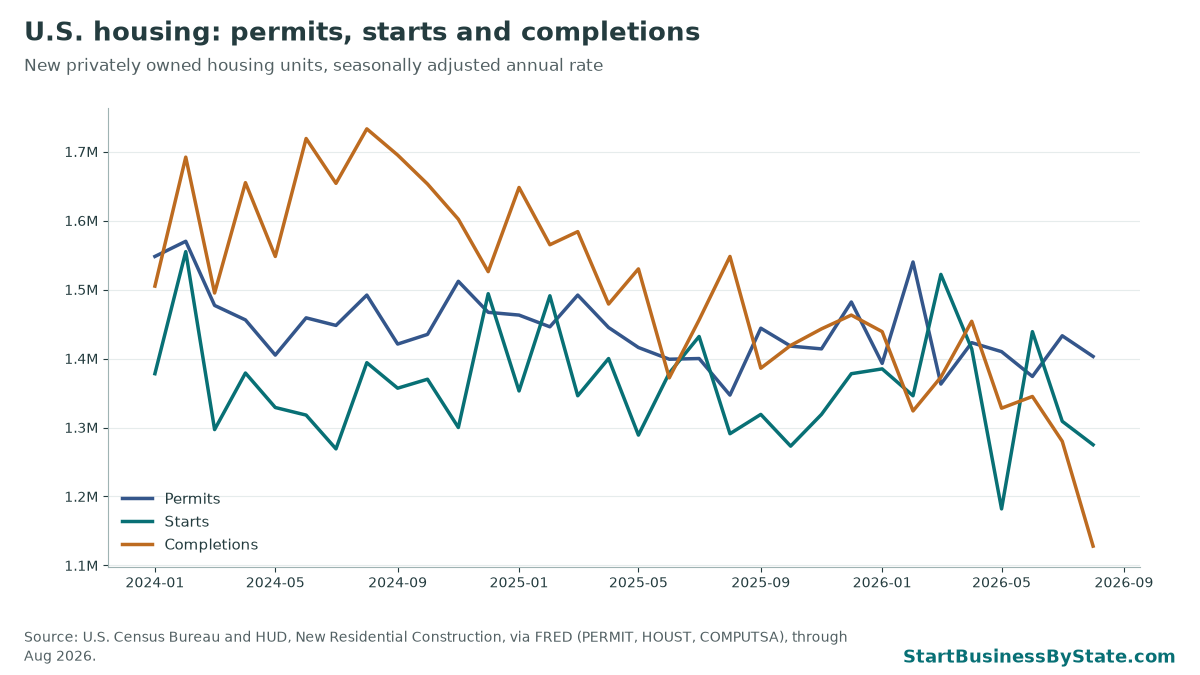
Completions are the number to watch for trade contractors. Every finished house needs its plumbing, wiring, HVAC and landscaping done in the final months. When completions drop, finish trades feel it before the permit numbers show anything.
What a builder slowdown means for your business
New-home work is a big source of jobs for young trade companies, often as a subcontractor to a builder. When builders slow down, that pipeline thins out first. Materials are the other moving cost; see building material prices since the tariffs.
- Plumbing and HVAC. New-construction rough-ins dry up first. Service and replacement work kept growing in most states. If you are starting out, build a base of service customers and maintenance plans. See how to price an HVAC maintenance agreement and the state-by-state HVAC business guides.
- Electricians. Same pattern: less new-home wiring, steadier repair and upgrade work. Our electrician business guide covers licensing by state.
- Landscaping. New-home sod and planting jobs follow completions. Recurring maintenance contracts with homeowners and HOAs hold up better. Use the landscaping job pricing calculator to price them.
- Cleaning services. Post-construction cleanup work falls with completions. Commercial and recurring residential cleaning are steadier.
- Getting paid as a sub. When builders get squeezed, they pay subs slower. Get deposits and milestone payments in writing, and keep enough cash to wait. Read how much cash you need before taking a commercial contract.
Builders still struggle to find workers in many states. See immigrant workers by trade and state and trade labor density by state.
How we did this
- Permits. U.S. Census Bureau Building Permits Survey, new private housing units authorized by building permits, monthly, not seasonally adjusted, series [state]BPPRIV in FRED (Federal Reserve Bank of St. Louis). We sum January through August for 2026 and 2025. Recent months include Census imputation for places that did not report.
- Builder and trade jobs. BLS Quarterly Census of Employment and Wages (QCEW), 2026 Q1, industry files for NAICS 236115, 236117 and 23822, private ownership (own_code 5), state rows. We use third-month employment (March 2026) and BLS’s own over-the-year change field.
- National series. Census and HUD New Residential Construction via FRED: PERMIT (permits), HOUST (starts), COMPUTSA (completions), seasonally adjusted annual rates, through August 2026.
Caveats
- Permits and jobs cover different periods: permits through August 2026, jobs through March 2026. QCEW runs about six months behind.
- Permits count all housing units, including apartments. The builder job series cover single-family builders only. A state with an apartment permit boom can show rising permits and falling single-family builder jobs at the same time.
- Many builders hire subcontractors for most of the work. Those workers are counted under their own trades, not under 236115.
- QCEW counts jobs covered by unemployment insurance. It misses self-employed workers and some independent contractors, who are common in construction.
Census and BLS data are public domain. This page has no ads or affiliate links. Cite as: StartBusinessByState, “Housing Permits vs. Builder Jobs by State,” updated October 6, 2026, https://startbusinessbystate.com/housing-permits-vs-builder-jobs-by-state/
Related research
- Home prices vs. home services employment.
- Home services demand by state.
- Immigrant workers by trade, by state.
- HVAC industry statistics.
- Best states to start an HVAC business.
- mortgage rate lock-in by state: how many owners hold sub-4% mortgages.
- where home prices are falling: one-year and peak-to-now home price changes.
- real estate share of GDP by state: real estate’s share of each state’s economy, 2015-2025.
- moving companies by state: moving company jobs vs. the share of residents who moved.
FAQ
Are home builders cutting jobs in 2026?
Yes, at new single-family builders. BLS payroll records show private employment at new single-family general contractors fell 4.5% between March 2025 and March 2026, with declines in 41 of 49 states that report data.
Which states issued fewer building permits in 2026?
26 of 51 states permitted fewer new private housing units from January through August 2026 than in the same months of 2025. Connecticut (−24.0%) and Nevada (−20.3%) fell most.
Why would builder jobs fall when permits are flat?
A permit is a plan to build. Jobs follow starts and completions, which have dropped. Builders also lean on subcontractors, so some work shifts to trade contractors rather than the builder’s own payroll. Labor supply matters too: builders report trouble finding crews.
Is it a bad time to start a construction trade business?
Not for every trade. New-home framing and finishing work depends on builder demand, which is soft in many states. Plumbing and HVAC contractors added jobs in 39 of 51 states, because repair and replacement work goes on regardless of new construction.
Where does this data come from?
Building permits come from the Census Bureau’s Building Permits Survey, accessed through the St. Louis Fed’s FRED database. Employment comes from the BLS Quarterly Census of Employment and Wages, which counts nearly every job covered by unemployment insurance.
How often is this updated?
Monthly for permits (Census releases them about 12 business days after each month ends) and quarterly for employment (QCEW runs about five to six months behind).
Last updated October 6, 2026. Permits through August 2026; QCEW employment through March 2026.