Census mover data for 2024, BLS jobs through 2025, HMDA loans through 2025 · Updated by StartBusinessByState
Short answer: Moving companies depend on people changing homes, and fewer people are doing that. The share of residents who moved in the past year fell in 50 of 51 states between 2019 and 2024. Home purchase loans are a third below 2021. This page shows mover rates, moving company jobs and pay, and home purchase activity for every state.
Key facts for reporters
- 39,597,954 people moved in the year before the 2024 survey: 19,924,391 within the same county, 9,963,763 from another county in the same state, 7,157,607 from another state and 2,552,193 from abroad (Census ACS).
- Highest mover rates in 2024: District of Columbia (19.9%), Alaska (14.8%), Colorado (14.2%). Lowest: New Jersey (8.8%), New York (9.3%), West Virginia (10.0%). Largest drops since 2019: Wyoming (-4.9 points), North Dakota (-3.9 points), Montana (-3.7 points).
- Moving companies (NAICS 484210) averaged 91,247 payroll jobs in 2025, vs 93,872 in 2024 and 100,033 in 2019 (BLS QCEW). Jobs fell from 2019 in 42 of the 47 states with published data.
- Average weekly pay at moving companies rose from $783 in 2019 to $984 in 2025 (+25.7%). The number of business locations rose from 8,628 to 9,736.
- Lenders made 3,576,617 home purchase loans in 2025, +4.0% from 2023 and -33.6% from 2021 (HMDA).
- Across states, the change in moving company jobs since 2019 isn’t related to the change in the number of movers (correlation -0.01) or in home purchase loans (-0.03).
How many people move in each state
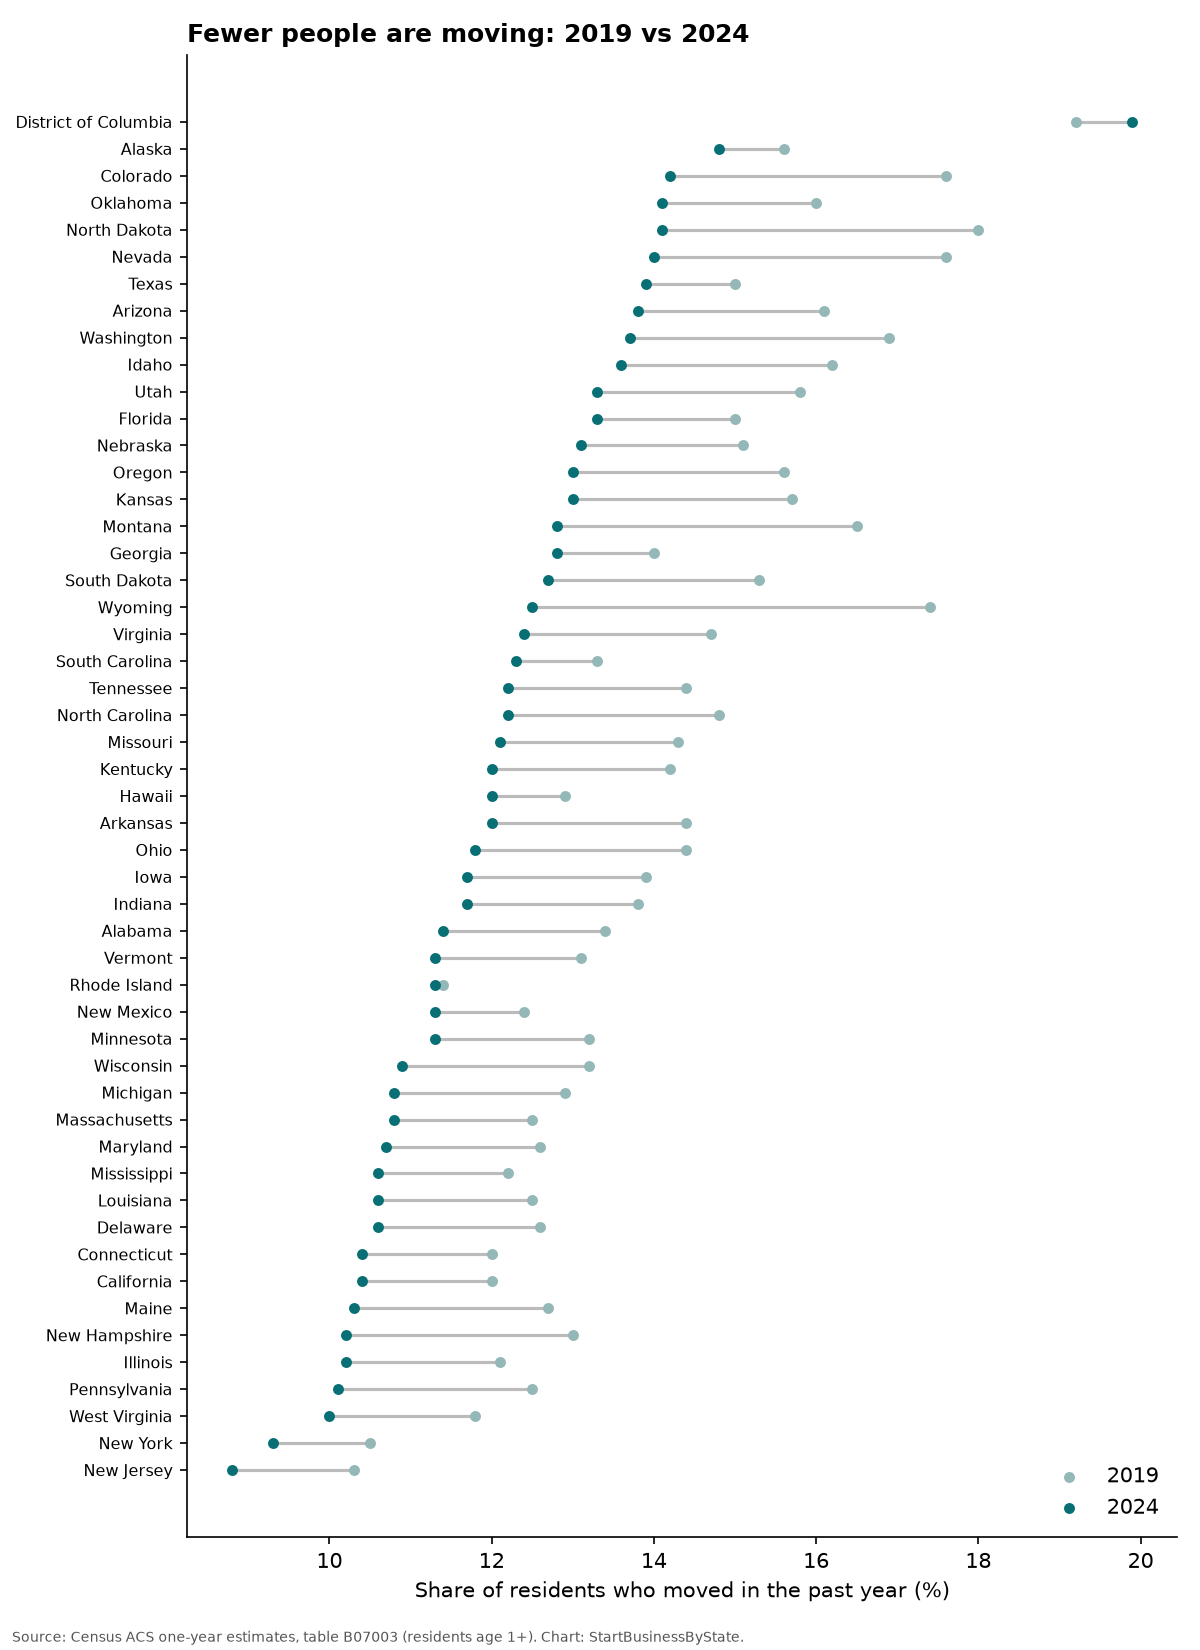
Census asks every survey respondent where they lived a year earlier. In 2024, 11.8% gave a different address, down 1.9 percentage points from 2019. Only District of Columbia saw no decline. Half of all moves are within the same county, which is the bread and butter of local movers. Interstate moves, the long-haul business, were 2.1% of residents nationally and highest in District of Columbia (7.7%), Wyoming (4.4%), Alaska (4.1%).
Several things push the mover rate down: an older population, homeowners holding low-rate mortgages (see mortgage rate lock-in by state), high home prices and rents, and more people working from home without having to move for a job. The survey data can’t say how much each one matters.
Moving company jobs since 2019
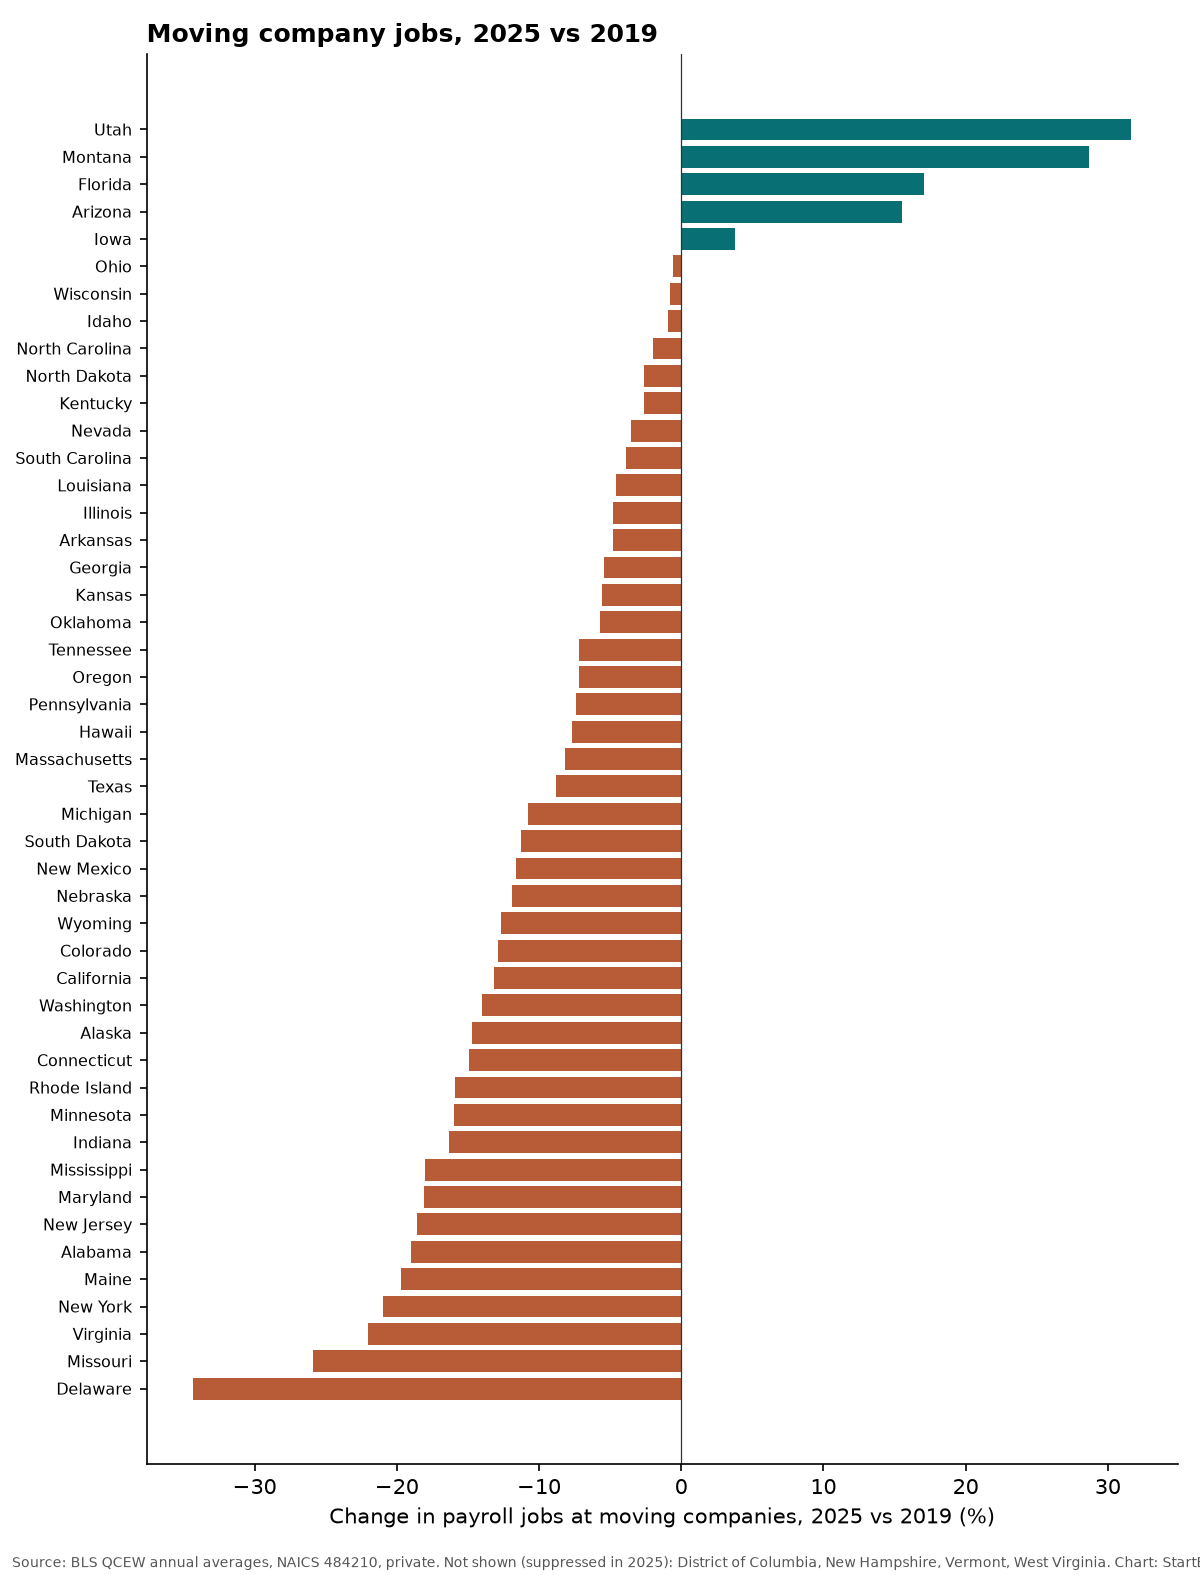
Nationally, moving companies had 8.8% fewer payroll jobs in 2025 than in 2019, but more business locations and higher average pay. The largest job declines were in Delaware (-34.3%), Missouri (-25.9%), Virginia (-22.0%). Jobs grew in Utah (+31.6%), Montana (+28.7%), Florida (+17.1%), Arizona (+15.5%), Iowa (+3.8%). Moves are seasonal and peak in summer, so compare annual averages, not single months.
QCEW counts only W-2 jobs. Many movers hire seasonal crews through staffing agencies or use contract drivers, and those workers are counted elsewhere. Owner-operators with no employees aren’t in these counts either.
Moving company jobs per 10,000 movers
Dividing moving company jobs by the number of people who moved gives a rough sense of how much moving business there is relative to moving activity. Nationally there were 23.0 jobs per 10,000 movers. The highest ratios were in Alaska (57.9), Hawaii (38.2), Montana (35.5); the lowest in Mississippi (13.2), Oklahoma (13.3), Louisiana (13.7). States where more residents moved in from another state tend to have more moving company jobs per resident (correlation 0.46). Long-distance moves are more likely to use a paid moving company than local moves, but this data can’t confirm that.
Moving companies vs housing turnover by state
| State | Moved in past year, 2024 | 2019 | Change (points) | Moved from another state | Moving company jobs, 2025 | Jobs vs 2019 | Jobs vs 2024 | Jobs per 10k movers | Avg weekly pay, 2025 | Home purchase loans, 2025 | Loans vs 2021 |
|---|---|---|---|---|---|---|---|---|---|---|---|
| U.S. total | 11.8% | 13.7% | -1.9 | 2.1% | 91,247 | -8.8% | -2.8% | 23.0 | $984 | 3,576,617 | -33.6% |
| Alabama | 11.4% | 13.4% | -2.0 | 2.3% | 1,123 | -19.0% | -7.9% | 19.4 | $797 | 63,509 | -28.3% |
| Alaska | 14.8% | 15.6% | -0.8 | 4.1% | 625 | -14.7% | -3.7% | 57.9 | $1,105 | 7,564 | -36.4% |
| Arizona | 13.8% | 16.1% | -2.3 | 3.1% | 1,986 | +15.5% | -0.2% | 19.2 | $923 | 95,029 | -37.7% |
| Arkansas | 12.0% | 14.4% | -2.4 | 2.1% | 792 | -4.8% | -7.0% | 21.6 | $887 | 38,597 | -24.7% |
| California | 10.4% | 12.0% | -1.6 | 1.0% | 9,002 | -13.2% | -5.1% | 22.2 | $1,069 | 257,970 | -46.1% |
| Colorado | 14.2% | 17.6% | -3.4 | 3.1% | 2,299 | -12.9% | -8.4% | 27.5 | $900 | 81,568 | -41.5% |
| Connecticut | 10.4% | 12.0% | -1.6 | 2.3% | 1,003 | -14.9% | -3.1% | 26.5 | $1,158 | 35,676 | -36.7% |
| Delaware | 10.6% | 12.6% | -2.0 | 3.3% | 261 | -34.3% | -8.7% | 23.6 | $983 | 14,078 | -34.3% |
| District of Columbia | 19.9% | 19.2% | +0.7 | 7.7% | suppressed | n/a | n/a | n/a | suppressed | 5,474 | -48.0% |
| Florida | 13.3% | 15.0% | -1.7 | 2.5% | 7,680 | +17.1% | +5.1% | 24.9 | $1,005 | 292,562 | -36.5% |
| Georgia | 12.8% | 14.0% | -1.2 | 2.4% | 2,793 | -5.4% | -7.8% | 19.7 | $856 | 129,478 | -33.6% |
| Hawaii | 12.0% | 12.9% | -0.9 | 3.8% | 656 | -7.7% | +1.4% | 38.2 | $1,047 | 9,935 | -45.2% |
| Idaho | 13.6% | 16.2% | -2.6 | 3.7% | 535 | -0.9% | -8.1% | 19.8 | $774 | 29,211 | -26.7% |
| Illinois | 10.2% | 12.1% | -1.9 | 1.6% | 3,273 | -4.8% | -2.2% | 25.4 | $1,054 | 126,465 | -36.6% |
| Indiana | 11.7% | 13.8% | -2.1 | 2.0% | 1,714 | -16.3% | -0.6% | 21.3 | $994 | 87,808 | -23.5% |
| Iowa | 11.7% | 13.9% | -2.2 | 1.9% | 632 | +3.8% | -5.1% | 16.8 | $758 | 41,879 | -26.2% |
| Kansas | 13.0% | 15.7% | -2.7 | 2.8% | 953 | -5.6% | -1.7% | 24.9 | $801 | 33,265 | -24.1% |
| Kentucky | 12.0% | 14.2% | -2.2 | 2.1% | 787 | -2.6% | -5.7% | 14.4 | $798 | 51,753 | -24.8% |
| Louisiana | 10.6% | 12.5% | -1.9 | 1.6% | 657 | -4.6% | +0.8% | 13.7 | $673 | 41,291 | -38.7% |
| Maine | 10.3% | 12.7% | -2.4 | 2.6% | 375 | -19.7% | -5.1% | 26.2 | $1,076 | 16,396 | -29.4% |
| Maryland | 10.7% | 12.6% | -1.9 | 2.7% | 1,584 | -18.1% | -0.2% | 24.0 | $1,040 | 63,681 | -41.4% |
| Massachusetts | 10.8% | 12.5% | -1.7 | 2.2% | 2,445 | -8.2% | +0.1% | 32.1 | $1,232 | 62,800 | -35.7% |
| Michigan | 10.8% | 12.9% | -2.1 | 1.4% | 1,926 | -10.8% | -1.2% | 17.8 | $965 | 107,241 | -28.9% |
| Minnesota | 11.3% | 13.2% | -1.9 | 1.8% | 1,160 | -16.0% | +2.4% | 17.9 | $931 | 68,946 | -33.2% |
| Mississippi | 10.6% | 12.2% | -1.6 | 2.2% | 409 | -18.0% | +1.5% | 13.2 | $847 | 30,006 | -23.4% |
| Missouri | 12.1% | 14.3% | -2.2 | 2.3% | 2,251 | -25.9% | -6.9% | 30.1 | $1,026 | 79,711 | -25.9% |
| Montana | 12.8% | 16.5% | -3.7 | 3.2% | 511 | +28.7% | +25.6% | 35.5 | $818 | 11,766 | -37.1% |
| Nebraska | 13.1% | 15.1% | -2.0 | 2.5% | 560 | -11.9% | -2.9% | 21.5 | $756 | 24,507 | -20.5% |
| Nevada | 14.0% | 17.6% | -3.6 | 4.0% | 834 | -3.5% | +3.3% | 18.4 | $869 | 38,593 | -42.1% |
| New Hampshire | 10.2% | 13.0% | -2.8 | 3.5% | suppressed | n/a | n/a | n/a | suppressed | 15,283 | -30.6% |
| New Jersey | 8.8% | 10.3% | -1.5 | 1.6% | 2,559 | -18.6% | -3.6% | 31.0 | $1,107 | 81,024 | -38.6% |
| New Mexico | 11.3% | 12.4% | -1.1 | 2.6% | 434 | -11.6% | +10.7% | 18.3 | $691 | 22,743 | -29.9% |
| New York | 9.3% | 10.5% | -1.2 | 1.5% | 4,900 | -21.0% | -2.9% | 26.7 | $1,157 | 119,881 | -35.9% |
| North Carolina | 12.2% | 14.8% | -2.6 | 2.7% | 3,053 | -2.0% | -7.3% | 22.9 | $801 | 149,850 | -27.7% |
| North Dakota | 14.1% | 18.0% | -3.9 | 3.5% | 260 | -2.6% | -0.4% | 23.4 | $730 | 8,375 | -31.3% |
| Ohio | 11.8% | 14.4% | -2.6 | 1.7% | 3,186 | -0.6% | -1.3% | 23.0 | $914 | 133,015 | -24.2% |
| Oklahoma | 14.1% | 16.0% | -1.9 | 2.7% | 756 | -5.7% | -4.4% | 13.3 | $744 | 47,287 | -24.5% |
| Oregon | 13.0% | 15.6% | -2.6 | 2.8% | 1,209 | -7.2% | -2.5% | 22.0 | $865 | 43,910 | -41.8% |
| Pennsylvania | 10.1% | 12.5% | -2.4 | 1.8% | 2,733 | -7.4% | -1.8% | 20.9 | $932 | 123,644 | -29.9% |
| Rhode Island | 11.3% | 11.4% | -0.1 | 3.3% | 254 | -15.9% | -6.3% | 20.3 | $782 | 10,600 | -36.1% |
| South Carolina | 12.3% | 13.3% | -1.0 | 3.5% | 1,194 | -3.9% | -0.6% | 17.9 | $781 | 85,452 | -24.9% |
| South Dakota | 12.7% | 15.3% | -2.6 | 2.6% | 252 | -11.3% | +0.8% | 21.8 | $724 | 9,881 | -29.7% |
| Tennessee | 12.2% | 14.4% | -2.2 | 2.7% | 1,905 | -7.2% | -8.2% | 21.9 | $932 | 91,425 | -28.5% |
| Texas | 13.9% | 15.0% | -1.1 | 1.8% | 9,410 | -8.8% | -4.7% | 21.9 | $1,082 | 356,285 | -26.9% |
| Utah | 13.3% | 15.8% | -2.5 | 2.8% | 1,038 | +31.6% | +2.0% | 22.6 | $861 | 44,237 | -35.9% |
| Vermont | 11.3% | 13.1% | -1.8 | 3.8% | suppressed | n/a | n/a | n/a | suppressed | 6,445 | -29.5% |
| Virginia | 12.4% | 14.7% | -2.3 | 3.0% | 3,770 | -22.0% | -4.3% | 34.7 | $1,036 | 103,337 | -38.1% |
| Washington | 13.7% | 16.9% | -3.2 | 2.8% | 2,884 | -14.0% | -2.6% | 26.7 | $911 | 85,968 | -41.9% |
| West Virginia | 10.0% | 11.8% | -1.8 | 2.5% | suppressed | n/a | n/a | n/a | suppressed | 17,150 | -23.0% |
| Wisconsin | 10.9% | 13.2% | -2.3 | 2.0% | 1,779 | -0.8% | -4.1% | 27.6 | $894 | 66,746 | -28.7% |
| Wyoming | 12.5% | 17.4% | -4.9 | 4.4% | 144 | -12.7% | +5.1% | 19.9 | $846 | 7,320 | -32.7% |
“Suppressed” means BLS didn’t publish the figure to protect the confidentiality of individual firms. We leave these blank rather than estimate them. 2025 jobs are suppressed for District of Columbia, New Hampshire, Vermont, West Virginia.
State-by-state takeaways
Alabama
11.4% of Alabama residents moved in the past year (2024), down from 13.4% in 2019 (rank 31 of 51 for mover rate). 2.3% moved in from another state (U.S. 2.1%). Moving companies had 1,123 payroll jobs in 2025, -19.0% vs 2019 and -7.9% vs 2024, or 19.4 per 10,000 movers. Average weekly pay was $797. Home purchase loans were 63,509 in 2025, -28.3% vs 2021.
Alaska
14.8% of Alaska residents moved in the past year (2024), down from 15.6% in 2019 (rank 2 of 51 for mover rate). 4.1% moved in from another state (U.S. 2.1%). Moving companies had 625 payroll jobs in 2025, -14.7% vs 2019 and -3.7% vs 2024, or 57.9 per 10,000 movers. Average weekly pay was $1,105. Home purchase loans were 7,564 in 2025, -36.4% vs 2021.
Arizona
13.8% of Arizona residents moved in the past year (2024), down from 16.1% in 2019 (rank 8 of 51 for mover rate). 3.1% moved in from another state (U.S. 2.1%). Moving companies had 1,986 payroll jobs in 2025, +15.5% vs 2019 and -0.2% vs 2024, or 19.2 per 10,000 movers. Average weekly pay was $923. Home purchase loans were 95,029 in 2025, -37.7% vs 2021.
Arkansas
12.0% of Arkansas residents moved in the past year (2024), down from 14.4% in 2019 (rank 25 of 51 for mover rate). 2.1% moved in from another state (U.S. 2.1%). Moving companies had 792 payroll jobs in 2025, -4.8% vs 2019 and -7.0% vs 2024, or 21.6 per 10,000 movers. Average weekly pay was $887. Home purchase loans were 38,597 in 2025, -24.7% vs 2021.
California
10.4% of California residents moved in the past year (2024), down from 12.0% in 2019 (rank 43 of 51 for mover rate). 1.0% moved in from another state (U.S. 2.1%). Moving companies had 9,002 payroll jobs in 2025, -13.2% vs 2019 and -5.1% vs 2024, or 22.2 per 10,000 movers. Average weekly pay was $1,069. Home purchase loans were 257,970 in 2025, -46.1% vs 2021.
Colorado
14.2% of Colorado residents moved in the past year (2024), down from 17.6% in 2019 (rank 3 of 51 for mover rate). 3.1% moved in from another state (U.S. 2.1%). Moving companies had 2,299 payroll jobs in 2025, -12.9% vs 2019 and -8.4% vs 2024, or 27.5 per 10,000 movers. Average weekly pay was $900. Home purchase loans were 81,568 in 2025, -41.5% vs 2021.
Connecticut
10.4% of Connecticut residents moved in the past year (2024), down from 12.0% in 2019 (rank 44 of 51 for mover rate). 2.3% moved in from another state (U.S. 2.1%). Moving companies had 1,003 payroll jobs in 2025, -14.9% vs 2019 and -3.1% vs 2024, or 26.5 per 10,000 movers. Average weekly pay was $1,158. Home purchase loans were 35,676 in 2025, -36.7% vs 2021.
Delaware
10.6% of Delaware residents moved in the past year (2024), down from 12.6% in 2019 (rank 40 of 51 for mover rate). 3.3% moved in from another state (U.S. 2.1%). Moving companies had 261 payroll jobs in 2025, -34.3% vs 2019 and -8.7% vs 2024, or 23.6 per 10,000 movers. Average weekly pay was $983. Home purchase loans were 14,078 in 2025, -34.3% vs 2021.
District of Columbia
19.9% of District of Columbia residents moved in the past year (2024), up from 19.2% in 2019 (rank 1 of 51 for mover rate). 7.7% moved in from another state (U.S. 2.1%). BLS suppressed 2025 moving company jobs for this state to protect confidentiality. Home purchase loans were 5,474 in 2025, -48.0% vs 2021.
Florida
13.3% of Florida residents moved in the past year (2024), down from 15.0% in 2019 (rank 11 of 51 for mover rate). 2.5% moved in from another state (U.S. 2.1%). Moving companies had 7,680 payroll jobs in 2025, +17.1% vs 2019 and +5.1% vs 2024, or 24.9 per 10,000 movers. Average weekly pay was $1,005. Home purchase loans were 292,562 in 2025, -36.5% vs 2021.
Georgia
12.8% of Georgia residents moved in the past year (2024), down from 14.0% in 2019 (rank 16 of 51 for mover rate). 2.4% moved in from another state (U.S. 2.1%). Moving companies had 2,793 payroll jobs in 2025, -5.4% vs 2019 and -7.8% vs 2024, or 19.7 per 10,000 movers. Average weekly pay was $856. Home purchase loans were 129,478 in 2025, -33.6% vs 2021.
Hawaii
12.0% of Hawaii residents moved in the past year (2024), down from 12.9% in 2019 (rank 26 of 51 for mover rate). 3.8% moved in from another state (U.S. 2.1%). Moving companies had 656 payroll jobs in 2025, -7.7% vs 2019 and +1.4% vs 2024, or 38.2 per 10,000 movers. Average weekly pay was $1,047. Home purchase loans were 9,935 in 2025, -45.2% vs 2021.
Idaho
13.6% of Idaho residents moved in the past year (2024), down from 16.2% in 2019 (rank 10 of 51 for mover rate). 3.7% moved in from another state (U.S. 2.1%). Moving companies had 535 payroll jobs in 2025, -0.9% vs 2019 and -8.1% vs 2024, or 19.8 per 10,000 movers. Average weekly pay was $774. Home purchase loans were 29,211 in 2025, -26.7% vs 2021.
Illinois
10.2% of Illinois residents moved in the past year (2024), down from 12.1% in 2019 (rank 46 of 51 for mover rate). 1.6% moved in from another state (U.S. 2.1%). Moving companies had 3,273 payroll jobs in 2025, -4.8% vs 2019 and -2.2% vs 2024, or 25.4 per 10,000 movers. Average weekly pay was $1,054. Home purchase loans were 126,465 in 2025, -36.6% vs 2021.
Indiana
11.7% of Indiana residents moved in the past year (2024), down from 13.8% in 2019 (rank 29 of 51 for mover rate). 2.0% moved in from another state (U.S. 2.1%). Moving companies had 1,714 payroll jobs in 2025, -16.3% vs 2019 and -0.6% vs 2024, or 21.3 per 10,000 movers. Average weekly pay was $994. Home purchase loans were 87,808 in 2025, -23.5% vs 2021.
Iowa
11.7% of Iowa residents moved in the past year (2024), down from 13.9% in 2019 (rank 30 of 51 for mover rate). 1.9% moved in from another state (U.S. 2.1%). Moving companies had 632 payroll jobs in 2025, +3.8% vs 2019 and -5.1% vs 2024, or 16.8 per 10,000 movers. Average weekly pay was $758. Home purchase loans were 41,879 in 2025, -26.2% vs 2021.
Kansas
13.0% of Kansas residents moved in the past year (2024), down from 15.7% in 2019 (rank 14 of 51 for mover rate). 2.8% moved in from another state (U.S. 2.1%). Moving companies had 953 payroll jobs in 2025, -5.6% vs 2019 and -1.7% vs 2024, or 24.9 per 10,000 movers. Average weekly pay was $801. Home purchase loans were 33,265 in 2025, -24.1% vs 2021.
Kentucky
12.0% of Kentucky residents moved in the past year (2024), down from 14.2% in 2019 (rank 27 of 51 for mover rate). 2.1% moved in from another state (U.S. 2.1%). Moving companies had 787 payroll jobs in 2025, -2.6% vs 2019 and -5.7% vs 2024, or 14.4 per 10,000 movers. Average weekly pay was $798. Home purchase loans were 51,753 in 2025, -24.8% vs 2021.
Louisiana
10.6% of Louisiana residents moved in the past year (2024), down from 12.5% in 2019 (rank 41 of 51 for mover rate). 1.6% moved in from another state (U.S. 2.1%). Moving companies had 657 payroll jobs in 2025, -4.6% vs 2019 and +0.8% vs 2024, or 13.7 per 10,000 movers. Average weekly pay was $673. Home purchase loans were 41,291 in 2025, -38.7% vs 2021.
Maine
10.3% of Maine residents moved in the past year (2024), down from 12.7% in 2019 (rank 45 of 51 for mover rate). 2.6% moved in from another state (U.S. 2.1%). Moving companies had 375 payroll jobs in 2025, -19.7% vs 2019 and -5.1% vs 2024, or 26.2 per 10,000 movers. Average weekly pay was $1,076. Home purchase loans were 16,396 in 2025, -29.4% vs 2021.
Maryland
10.7% of Maryland residents moved in the past year (2024), down from 12.6% in 2019 (rank 39 of 51 for mover rate). 2.7% moved in from another state (U.S. 2.1%). Moving companies had 1,584 payroll jobs in 2025, -18.1% vs 2019 and -0.2% vs 2024, or 24.0 per 10,000 movers. Average weekly pay was $1,040. Home purchase loans were 63,681 in 2025, -41.4% vs 2021.
Massachusetts
10.8% of Massachusetts residents moved in the past year (2024), down from 12.5% in 2019 (rank 37 of 51 for mover rate). 2.2% moved in from another state (U.S. 2.1%). Moving companies had 2,445 payroll jobs in 2025, -8.2% vs 2019 and +0.1% vs 2024, or 32.1 per 10,000 movers. Average weekly pay was $1,232. Home purchase loans were 62,800 in 2025, -35.7% vs 2021.
Michigan
10.8% of Michigan residents moved in the past year (2024), down from 12.9% in 2019 (rank 38 of 51 for mover rate). 1.4% moved in from another state (U.S. 2.1%). Moving companies had 1,926 payroll jobs in 2025, -10.8% vs 2019 and -1.2% vs 2024, or 17.8 per 10,000 movers. Average weekly pay was $965. Home purchase loans were 107,241 in 2025, -28.9% vs 2021.
Minnesota
11.3% of Minnesota residents moved in the past year (2024), down from 13.2% in 2019 (rank 32 of 51 for mover rate). 1.8% moved in from another state (U.S. 2.1%). Moving companies had 1,160 payroll jobs in 2025, -16.0% vs 2019 and +2.4% vs 2024, or 17.9 per 10,000 movers. Average weekly pay was $931. Home purchase loans were 68,946 in 2025, -33.2% vs 2021.
Mississippi
10.6% of Mississippi residents moved in the past year (2024), down from 12.2% in 2019 (rank 42 of 51 for mover rate). 2.2% moved in from another state (U.S. 2.1%). Moving companies had 409 payroll jobs in 2025, -18.0% vs 2019 and +1.5% vs 2024, or 13.2 per 10,000 movers. Average weekly pay was $847. Home purchase loans were 30,006 in 2025, -23.4% vs 2021.
Missouri
12.1% of Missouri residents moved in the past year (2024), down from 14.3% in 2019 (rank 24 of 51 for mover rate). 2.3% moved in from another state (U.S. 2.1%). Moving companies had 2,251 payroll jobs in 2025, -25.9% vs 2019 and -6.9% vs 2024, or 30.1 per 10,000 movers. Average weekly pay was $1,026. Home purchase loans were 79,711 in 2025, -25.9% vs 2021.
Montana
12.8% of Montana residents moved in the past year (2024), down from 16.5% in 2019 (rank 17 of 51 for mover rate). 3.2% moved in from another state (U.S. 2.1%). Moving companies had 511 payroll jobs in 2025, +28.7% vs 2019 and +25.6% vs 2024, or 35.5 per 10,000 movers. Average weekly pay was $818. Home purchase loans were 11,766 in 2025, -37.1% vs 2021.
Nebraska
13.1% of Nebraska residents moved in the past year (2024), down from 15.1% in 2019 (rank 13 of 51 for mover rate). 2.5% moved in from another state (U.S. 2.1%). Moving companies had 560 payroll jobs in 2025, -11.9% vs 2019 and -2.9% vs 2024, or 21.5 per 10,000 movers. Average weekly pay was $756. Home purchase loans were 24,507 in 2025, -20.5% vs 2021.
Nevada
14.0% of Nevada residents moved in the past year (2024), down from 17.6% in 2019 (rank 6 of 51 for mover rate). 4.0% moved in from another state (U.S. 2.1%). Moving companies had 834 payroll jobs in 2025, -3.5% vs 2019 and +3.3% vs 2024, or 18.4 per 10,000 movers. Average weekly pay was $869. Home purchase loans were 38,593 in 2025, -42.1% vs 2021.
New Hampshire
10.2% of New Hampshire residents moved in the past year (2024), down from 13.0% in 2019 (rank 47 of 51 for mover rate). 3.5% moved in from another state (U.S. 2.1%). BLS suppressed 2025 moving company jobs for this state to protect confidentiality. Home purchase loans were 15,283 in 2025, -30.6% vs 2021.
New Jersey
8.8% of New Jersey residents moved in the past year (2024), down from 10.3% in 2019 (rank 51 of 51 for mover rate). 1.6% moved in from another state (U.S. 2.1%). Moving companies had 2,559 payroll jobs in 2025, -18.6% vs 2019 and -3.6% vs 2024, or 31.0 per 10,000 movers. Average weekly pay was $1,107. Home purchase loans were 81,024 in 2025, -38.6% vs 2021.
New Mexico
11.3% of New Mexico residents moved in the past year (2024), down from 12.4% in 2019 (rank 33 of 51 for mover rate). 2.6% moved in from another state (U.S. 2.1%). Moving companies had 434 payroll jobs in 2025, -11.6% vs 2019 and +10.7% vs 2024, or 18.3 per 10,000 movers. Average weekly pay was $691. Home purchase loans were 22,743 in 2025, -29.9% vs 2021.
New York
9.3% of New York residents moved in the past year (2024), down from 10.5% in 2019 (rank 50 of 51 for mover rate). 1.5% moved in from another state (U.S. 2.1%). Moving companies had 4,900 payroll jobs in 2025, -21.0% vs 2019 and -2.9% vs 2024, or 26.7 per 10,000 movers. Average weekly pay was $1,157. Home purchase loans were 119,881 in 2025, -35.9% vs 2021.
North Carolina
12.2% of North Carolina residents moved in the past year (2024), down from 14.8% in 2019 (rank 22 of 51 for mover rate). 2.7% moved in from another state (U.S. 2.1%). Moving companies had 3,053 payroll jobs in 2025, -2.0% vs 2019 and -7.3% vs 2024, or 22.9 per 10,000 movers. Average weekly pay was $801. Home purchase loans were 149,850 in 2025, -27.7% vs 2021.
North Dakota
14.1% of North Dakota residents moved in the past year (2024), down from 18.0% in 2019 (rank 4 of 51 for mover rate). 3.5% moved in from another state (U.S. 2.1%). Moving companies had 260 payroll jobs in 2025, -2.6% vs 2019 and -0.4% vs 2024, or 23.4 per 10,000 movers. Average weekly pay was $730. Home purchase loans were 8,375 in 2025, -31.3% vs 2021.
Ohio
11.8% of Ohio residents moved in the past year (2024), down from 14.4% in 2019 (rank 28 of 51 for mover rate). 1.7% moved in from another state (U.S. 2.1%). Moving companies had 3,186 payroll jobs in 2025, -0.6% vs 2019 and -1.3% vs 2024, or 23.0 per 10,000 movers. Average weekly pay was $914. Home purchase loans were 133,015 in 2025, -24.2% vs 2021.
Oklahoma
14.1% of Oklahoma residents moved in the past year (2024), down from 16.0% in 2019 (rank 5 of 51 for mover rate). 2.7% moved in from another state (U.S. 2.1%). Moving companies had 756 payroll jobs in 2025, -5.7% vs 2019 and -4.4% vs 2024, or 13.3 per 10,000 movers. Average weekly pay was $744. Home purchase loans were 47,287 in 2025, -24.5% vs 2021.
Oregon
13.0% of Oregon residents moved in the past year (2024), down from 15.6% in 2019 (rank 15 of 51 for mover rate). 2.8% moved in from another state (U.S. 2.1%). Moving companies had 1,209 payroll jobs in 2025, -7.2% vs 2019 and -2.5% vs 2024, or 22.0 per 10,000 movers. Average weekly pay was $865. Home purchase loans were 43,910 in 2025, -41.8% vs 2021.
Pennsylvania
10.1% of Pennsylvania residents moved in the past year (2024), down from 12.5% in 2019 (rank 48 of 51 for mover rate). 1.8% moved in from another state (U.S. 2.1%). Moving companies had 2,733 payroll jobs in 2025, -7.4% vs 2019 and -1.8% vs 2024, or 20.9 per 10,000 movers. Average weekly pay was $932. Home purchase loans were 123,644 in 2025, -29.9% vs 2021.
Rhode Island
11.3% of Rhode Island residents moved in the past year (2024), down from 11.4% in 2019 (rank 34 of 51 for mover rate). 3.3% moved in from another state (U.S. 2.1%). Moving companies had 254 payroll jobs in 2025, -15.9% vs 2019 and -6.3% vs 2024, or 20.3 per 10,000 movers. Average weekly pay was $782. Home purchase loans were 10,600 in 2025, -36.1% vs 2021.
South Carolina
12.3% of South Carolina residents moved in the past year (2024), down from 13.3% in 2019 (rank 21 of 51 for mover rate). 3.5% moved in from another state (U.S. 2.1%). Moving companies had 1,194 payroll jobs in 2025, -3.9% vs 2019 and -0.6% vs 2024, or 17.9 per 10,000 movers. Average weekly pay was $781. Home purchase loans were 85,452 in 2025, -24.9% vs 2021.
South Dakota
12.7% of South Dakota residents moved in the past year (2024), down from 15.3% in 2019 (rank 18 of 51 for mover rate). 2.6% moved in from another state (U.S. 2.1%). Moving companies had 252 payroll jobs in 2025, -11.3% vs 2019 and +0.8% vs 2024, or 21.8 per 10,000 movers. Average weekly pay was $724. Home purchase loans were 9,881 in 2025, -29.7% vs 2021.
Tennessee
12.2% of Tennessee residents moved in the past year (2024), down from 14.4% in 2019 (rank 23 of 51 for mover rate). 2.7% moved in from another state (U.S. 2.1%). Moving companies had 1,905 payroll jobs in 2025, -7.2% vs 2019 and -8.2% vs 2024, or 21.9 per 10,000 movers. Average weekly pay was $932. Home purchase loans were 91,425 in 2025, -28.5% vs 2021.
Texas
13.9% of Texas residents moved in the past year (2024), down from 15.0% in 2019 (rank 7 of 51 for mover rate). 1.8% moved in from another state (U.S. 2.1%). Moving companies had 9,410 payroll jobs in 2025, -8.8% vs 2019 and -4.7% vs 2024, or 21.9 per 10,000 movers. Average weekly pay was $1,082. Home purchase loans were 356,285 in 2025, -26.9% vs 2021.
Utah
13.3% of Utah residents moved in the past year (2024), down from 15.8% in 2019 (rank 12 of 51 for mover rate). 2.8% moved in from another state (U.S. 2.1%). Moving companies had 1,038 payroll jobs in 2025, +31.6% vs 2019 and +2.0% vs 2024, or 22.6 per 10,000 movers. Average weekly pay was $861. Home purchase loans were 44,237 in 2025, -35.9% vs 2021.
Vermont
11.3% of Vermont residents moved in the past year (2024), down from 13.1% in 2019 (rank 35 of 51 for mover rate). 3.8% moved in from another state (U.S. 2.1%). BLS suppressed 2025 moving company jobs for this state to protect confidentiality. Home purchase loans were 6,445 in 2025, -29.5% vs 2021.
Virginia
12.4% of Virginia residents moved in the past year (2024), down from 14.7% in 2019 (rank 20 of 51 for mover rate). 3.0% moved in from another state (U.S. 2.1%). Moving companies had 3,770 payroll jobs in 2025, -22.0% vs 2019 and -4.3% vs 2024, or 34.7 per 10,000 movers. Average weekly pay was $1,036. Home purchase loans were 103,337 in 2025, -38.1% vs 2021.
Washington
13.7% of Washington residents moved in the past year (2024), down from 16.9% in 2019 (rank 9 of 51 for mover rate). 2.8% moved in from another state (U.S. 2.1%). Moving companies had 2,884 payroll jobs in 2025, -14.0% vs 2019 and -2.6% vs 2024, or 26.7 per 10,000 movers. Average weekly pay was $911. Home purchase loans were 85,968 in 2025, -41.9% vs 2021.
West Virginia
10.0% of West Virginia residents moved in the past year (2024), down from 11.8% in 2019 (rank 49 of 51 for mover rate). 2.5% moved in from another state (U.S. 2.1%). BLS suppressed 2025 moving company jobs for this state to protect confidentiality. Home purchase loans were 17,150 in 2025, -23.0% vs 2021.
Wisconsin
10.9% of Wisconsin residents moved in the past year (2024), down from 13.2% in 2019 (rank 36 of 51 for mover rate). 2.0% moved in from another state (U.S. 2.1%). Moving companies had 1,779 payroll jobs in 2025, -0.8% vs 2019 and -4.1% vs 2024, or 27.6 per 10,000 movers. Average weekly pay was $894. Home purchase loans were 66,746 in 2025, -28.7% vs 2021.
Wyoming
12.5% of Wyoming residents moved in the past year (2024), down from 17.4% in 2019 (rank 19 of 51 for mover rate). 4.4% moved in from another state (U.S. 2.1%). Moving companies had 144 payroll jobs in 2025, -12.7% vs 2019 and +5.1% vs 2024, or 19.9 per 10,000 movers. Average weekly pay was $846. Home purchase loans were 7,320 in 2025, -32.7% vs 2021.
If you are starting a moving company
Interstate household goods movers need a USDOT number and operating authority from the Federal Motor Carrier Safety Administration. Many states also license or register in-state movers through a transportation or public utility commission. Check both before you take your first job. For the business basics, see business license requirements by state, LLC costs by state and diesel and gas prices by state.
Related data
See real estate agents by state, home services demand by state, mortgage rate lock-in by state and housing permits vs. builder jobs.
Methods and limits
- Movers: Census American Community Survey one-year estimates, table B07003 (geographic mobility in the past year, population age 1 and older), 2019 and 2024. Mover rate = 1 − share living in the same house a year earlier. ACS estimates have margins of error, which are larger in small states. The 2020 one-year ACS wasn’t released as standard estimates, so we compare 2024 with 2019.
- Moving company jobs and pay: BLS QCEW, NAICS 484210 used household and office goods moving (van lines, furniture moving, moving and storage), private ownership, annual averages for 2019, 2024 and 2025. Suppressed cells stay blank. The U.S. total includes the suppressed states.
- Business locations: QCEW average establishments. Census County Business Patterns 2023 counted 9,436 moving company establishments with 102,745 employees in mid-March, in the CSV.
- Home purchase loans: HMDA Data Browser (CFPB/FFIEC), originated loans with loan purpose = home purchase, 2021, 2023 and 2025. Cash purchases aren’t included, and renters’ moves don’t show up here at all.
- Correlations are Pearson coefficients across the 47 states with published 2019 and 2025 data, and don’t show cause and effect.
Sources
- U.S. Census Bureau, American Community Survey migration data (API)
- BLS Quarterly Census of Employment and Wages (open data files)
- U.S. Census Bureau, County Business Patterns 2023 (API)
- CFPB/FFIEC HMDA Data Browser (API)
Cite this data
Reporters and bloggers may use these numbers and charts. Please credit StartBusinessByState and link to this page.
Source: StartBusinessByState, “Moving Companies vs. Housing Turnover by State (2026 Data),” https://startbusinessbystate.com/moving-companies-by-state/ (updated October 8, 2026).
FAQ
How many people move each year in the U.S.?
About 39,597,954 people, or 11.8% of residents, lived at a different address a year earlier in the 2024 American Community Survey. In 2019 the rate was 13.7%.
Which state has the highest moving rate?
District of Columbia had the highest share of residents who moved in the past year (19.9%), followed by Alaska (14.8%) and Colorado (14.2%). New Jersey had the lowest (8.8%).
Is the moving industry shrinking?
Payroll jobs at moving companies fell from 100,033 in 2019 to 91,247 in 2025 (-8.8%), even though the number of business locations and average pay rose. Fewer people are moving, but the state data doesn’t show job losses tracking mover declines state by state.
How much do movers make?
Average weekly pay for all workers at moving companies was $984 in 2025 (BLS QCEW), ranging from $673 in Louisiana to $1,232 in Massachusetts. That figure includes office staff and drivers as well as crews.
Where is this data from?
Census American Community Survey and County Business Patterns, BLS QCEW and HMDA loan records from the CFPB. All of it was pulled from official APIs or data files.
Last updated October 8, 2026 by StartBusinessByState.