BEA GDP by state, annual through 2025 and quarterly through Q2 2026 (released Sept. 30, 2026) · Updated by StartBusinessByState
Short answer: Real estate is one of the biggest parts of every state economy, but most of it isn’t buying and selling homes. The largest piece is the rental value of housing, including an estimate of the rent homeowners would pay to live in their own homes. This page shows how big the sector is in each state, how its share has changed since 2015 and how fast it grew after inflation.
Key facts for reporters
- Real estate, rental and leasing (NAICS 53) produced $4.23 trillion of value added in 2025, 13.7% of U.S. GDP, up from 12.8% in 2015 (BEA). Real estate alone (NAICS 531) was 12.6%; rental and leasing services 1.1%.
- Largest shares in 2025: Florida (20.7%), Arizona (16.9%), Hawaii (16.7%), Colorado (15.8%), New Jersey (15.8%). Smallest: Nebraska (8.5%), Iowa (8.8%), District of Columbia (8.9%), North Dakota (9.2%).
- Biggest increases in share since 2015: Florida (+3.0 points), Texas (+2.3 points), South Carolina (+2.2 points), Georgia (+2.0 points). Biggest decreases: North Dakota (-1.9 points), New Hampshire (-1.4 points), West Virginia (-1.1 points).
- Inflation-adjusted output of the sector grew 23.0% nationally from 2019 to 2025, vs 15.6% for GDP overall. Fastest: Idaho (+46.8%), Arizona (+43.4%), Texas (+43.3%), Florida (+42.6%).
- Latest quarter (Q2 2026): the sector’s real output was +1.6% from a year earlier, vs +2.2% for all industries.
- Largest in dollars: California ($598.9B), Texas ($373.1B), Florida ($372.9B), New York ($351.8B).
How much each state’s economy leans on real estate
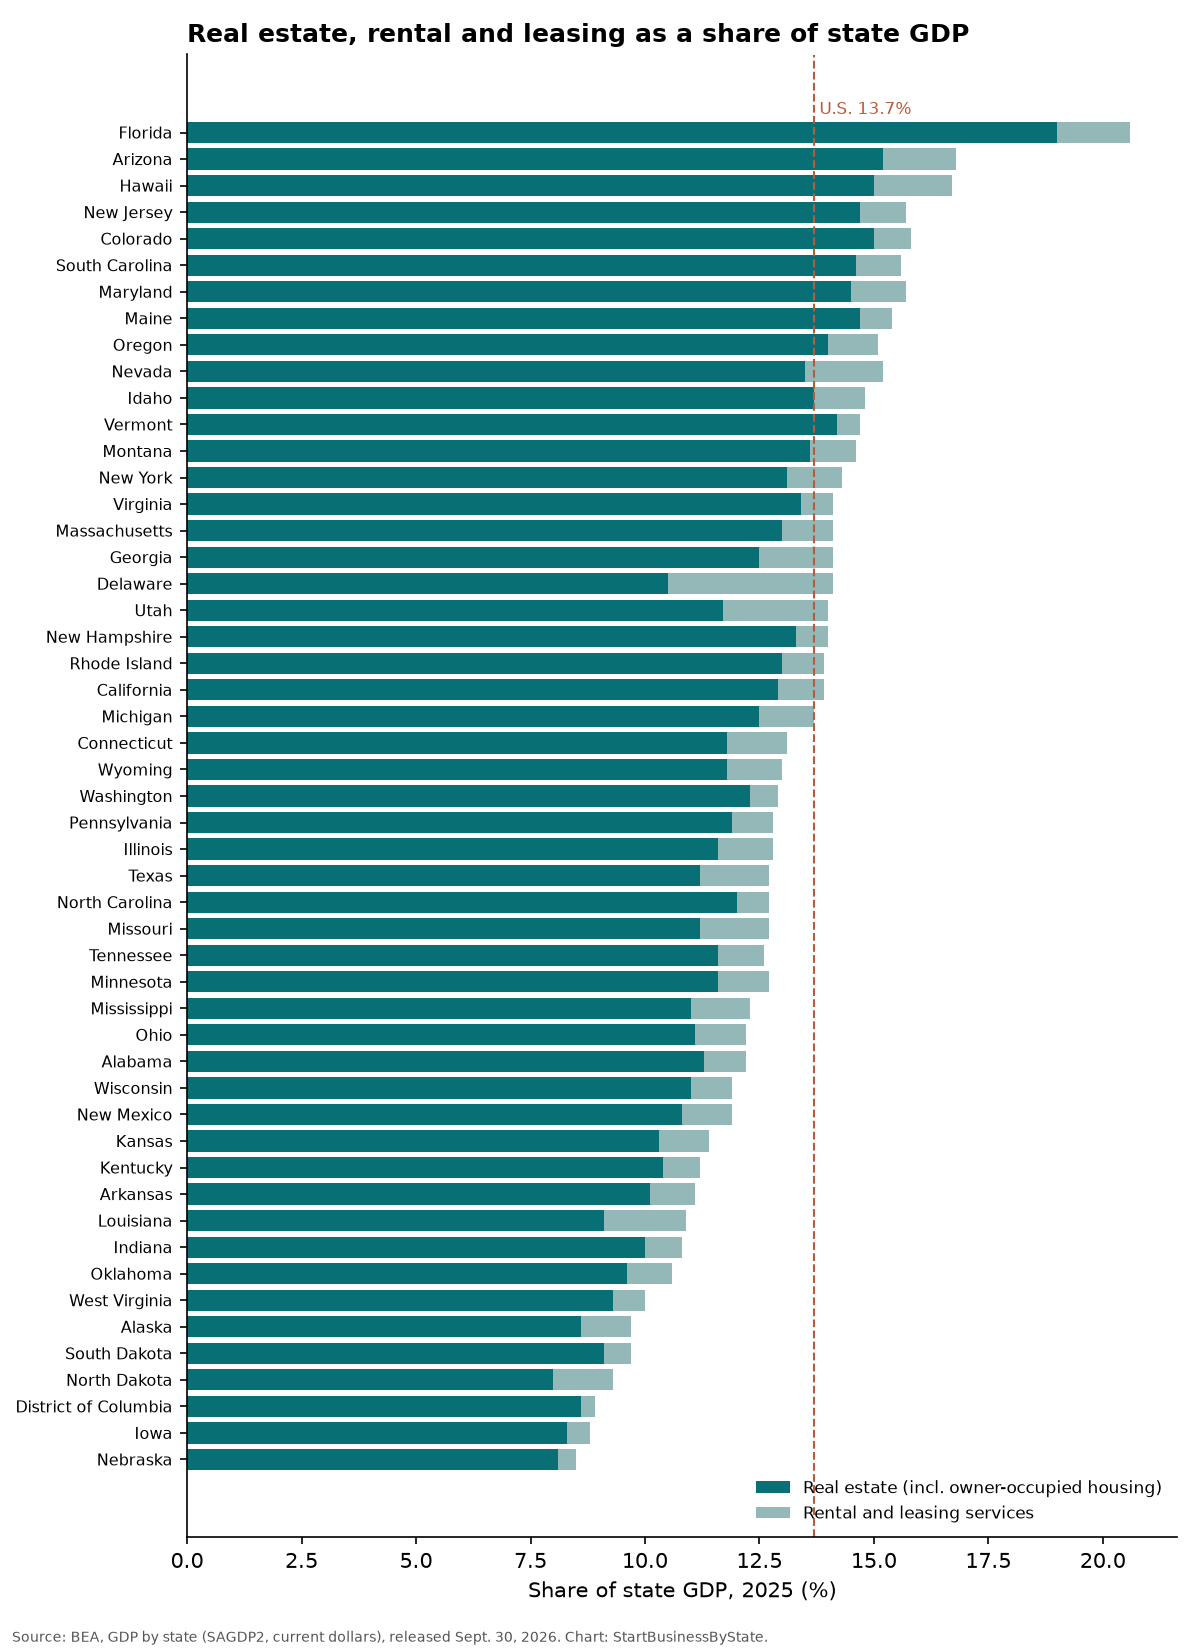
- Florida: 20.7% of GDP ($372.9B)
- Arizona: 16.9% of GDP ($100.0B)
- Hawaii: 16.7% of GDP ($20.6B)
- Colorado: 15.8% of GDP ($90.8B)
- New Jersey: 15.8% of GDP ($140.0B)
- Maryland: 15.6% of GDP ($88.7B)
- South Carolina: 15.6% of GDP ($59.0B)
- Maine: 15.3% of GDP ($15.6B)
- Nevada: 15.1% of GDP ($42.6B)
- Oregon: 15.1% of GDP ($51.7B)
The median state is at 12.9%. Because the rental value of housing is most of the sector, a state’s share depends on how much its housing is worth to live in compared with everything else it produces. A state with a large farm, energy, manufacturing or government sector can have a smaller share even if its housing market is busy.
What “real estate” means in GDP
BEA counts the value of housing services in the real estate industry. For rented homes, that’s based on the rent tenants pay. For owner-occupied homes, BEA estimates the rent owners would pay themselves (called imputed rent). It doesn’t involve any cash changing hands, but it makes up a large part of the sector. Agent commissions, property management fees and appraisal fees are in there too, along with commercial property rents. Rental and leasing services (car rental, equipment leasing and lessors of intangible assets such as franchises and patents) are a separate, much smaller piece: 1.1% of U.S. GDP, highest in Delaware (3.6%), Utah (2.3%), Louisiana (1.8%).
So a high share doesn’t mean a state has more real estate agents or more home sales. It mostly reflects how much housing is worth to live in, relative to everything else the state produces.
Change since 2015
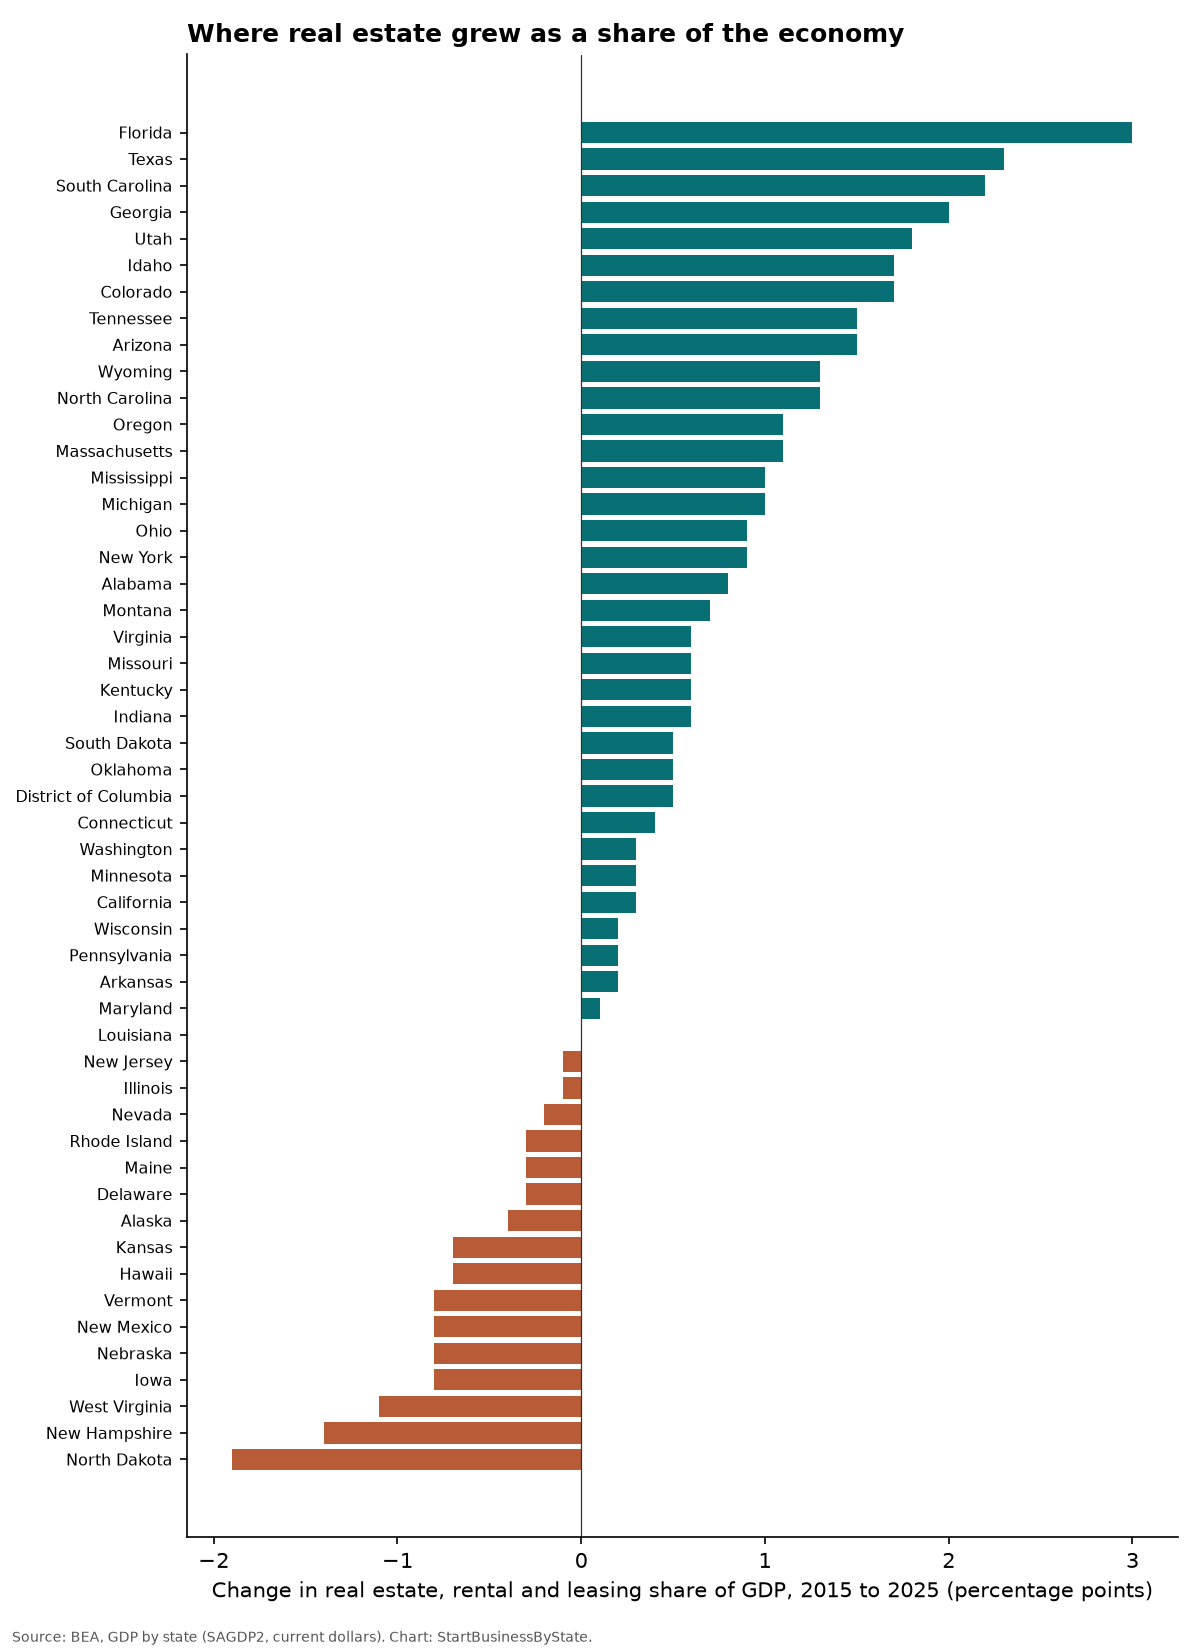
The sector’s share of the national economy rose 0.9 points from 2015 to 2025. The largest increases were in Florida, Texas, South Carolina, Georgia, Utah. Shares fell most in North Dakota, New Hampshire, West Virginia. A share can rise because housing values grew or because other industries shrank, and these figures don’t separate the two.
Growth after inflation
From 2019 to 2025, the sector’s inflation-adjusted output grew 23.0% nationally, faster than the economy as a whole (15.6%). Growth was fastest in Idaho (46.8%), Arizona (43.4%), Texas (43.3%), Florida (42.6%), South Carolina (38.3%). Kansas’s figure (-14.4%) swings from year to year because of its rental and leasing component; its real estate part alone grew 15.4%.
In the latest quarter, the sector grew more slowly than the overall economy nationally (+1.6% vs +2.2% year over year). It grew fastest in Delaware (+4.4%), Idaho (+3.1%), Utah (+3.0%). BEA didn’t publish this quarterly figure for Alaska, District of Columbia, South Dakota, Vermont, Wyoming, to protect confidential data.
Real estate share of GDP by state
| State | Real estate, rental & leasing GDP, 2025 | Share of GDP, 2025 | Real estate only | Rental & leasing | Share, 2015 | Change (points) | Real growth 2019–2025 | Whole economy 2019–2025 | Real growth, Q2 2026 vs Q2 2025 |
|---|---|---|---|---|---|---|---|---|---|
| United States | $4,234.1B | 13.7% | 12.6% | 1.1% | 12.8% | +0.9 | +23.0% | +15.6% | +1.6% |
| Alabama | $41.3B | 12.2% | 11.3% | 0.9% | 11.4% | +0.8 | +25.7% | +15.2% | +2.4% |
| Alaska | $7.2B | 9.8% | 8.6% | 1.1% | 10.2% | -0.4 | +7.9% | +7.6% | not published |
| Arizona | $100.0B | 16.9% | 15.2% | 1.6% | 15.4% | +1.5 | +43.4% | +25.6% | +2.7% |
| Arkansas | $21.7B | 11.1% | 10.1% | 1.0% | 10.9% | +0.2 | +23.0% | +16.3% | +1.1% |
| California | $598.9B | 13.9% | 12.9% | 1.0% | 13.6% | +0.3 | +16.1% | +15.5% | +1.3% |
| Colorado | $90.8B | 15.8% | 15.0% | 0.8% | 14.1% | +1.7 | +25.0% | +18.0% | +1.7% |
| Connecticut | $50.2B | 13.1% | 11.8% | 1.3% | 12.7% | +0.4 | +5.1% | +8.0% | +0.8% |
| Delaware | $17.2B | 14.1% | 10.5% | 3.6% | 14.4% | -0.3 | +3.6% | +20.6% | +4.4% |
| District of Columbia | $17.2B | 8.9% | 8.6% | 0.3% | 8.4% | +0.5 | +12.6% | +5.7% | not published |
| Florida | $372.9B | 20.7% | 19.0% | 1.6% | 17.7% | +3.0 | +42.6% | +26.9% | +2.8% |
| Georgia | $132.2B | 14.1% | 12.5% | 1.6% | 12.1% | +2.0 | +18.2% | +16.0% | +2.5% |
| Hawaii | $20.6B | 16.7% | 15.0% | 1.7% | 17.4% | -0.7 | +6.7% | +5.1% | +1.1% |
| Idaho | $20.3B | 14.8% | 13.7% | 1.1% | 13.1% | +1.7 | +46.8% | +27.8% | +3.1% |
| Illinois | $159.0B | 12.8% | 11.6% | 1.2% | 12.9% | -0.1 | +12.9% | +10.4% | +0.7% |
| Indiana | $58.6B | 10.8% | 10.0% | 0.8% | 10.2% | +0.6 | +19.5% | +14.0% | +1.6% |
| Iowa | $23.9B | 8.8% | 8.3% | 0.5% | 9.6% | -0.8 | +3.2% | +8.7% | +0.9% |
| Kansas | $26.4B | 11.4% | 10.3% | 1.1% | 12.1% | -0.7 | -14.4% | +5.3% | +1.0% |
| Kentucky | $35.2B | 11.2% | 10.4% | 0.8% | 10.6% | +0.6 | +20.9% | +13.1% | +1.5% |
| Louisiana | $37.4B | 10.9% | 9.1% | 1.8% | 10.9% | +0.0 | +4.9% | +7.0% | +1.3% |
| Maine | $15.6B | 15.3% | 14.7% | 0.7% | 15.6% | -0.3 | +18.9% | +15.7% | +1.6% |
| Maryland | $88.7B | 15.6% | 14.5% | 1.2% | 15.5% | +0.1 | +14.9% | +8.7% | +1.2% |
| Massachusetts | $114.7B | 14.1% | 13.0% | 1.1% | 13.0% | +1.1 | +20.0% | +13.2% | +1.3% |
| Michigan | $100.6B | 13.7% | 12.5% | 1.2% | 12.7% | +1.0 | +15.6% | +10.4% | +1.4% |
| Minnesota | $65.0B | 12.6% | 11.6% | 1.1% | 12.3% | +0.3 | +17.0% | +6.2% | +0.6% |
| Mississippi | $20.0B | 12.3% | 11.0% | 1.3% | 11.3% | +1.0 | +28.0% | +11.0% | +1.6% |
| Missouri | $60.3B | 12.7% | 11.2% | 1.5% | 12.1% | +0.6 | +26.3% | +12.8% | +1.6% |
| Montana | $11.8B | 14.6% | 13.6% | 1.0% | 13.9% | +0.7 | +31.9% | +21.6% | +2.0% |
| Nebraska | $17.6B | 8.5% | 8.1% | 0.4% | 9.3% | -0.8 | +13.5% | +22.9% | +0.8% |
| Nevada | $42.6B | 15.1% | 13.5% | 1.7% | 15.3% | -0.2 | +31.5% | +19.4% | +1.7% |
| New Hampshire | $18.0B | 14.0% | 13.3% | 0.7% | 15.4% | -1.4 | +24.0% | +17.3% | +0.9% |
| New Jersey | $140.0B | 15.8% | 14.7% | 1.0% | 15.9% | -0.1 | +13.3% | +11.3% | +0.9% |
| New Mexico | $18.1B | 11.9% | 10.8% | 1.1% | 12.7% | -0.8 | +19.7% | +22.2% | +1.3% |
| New York | $351.8B | 14.3% | 13.1% | 1.2% | 13.4% | +0.9 | +20.8% | +10.9% | +0.9% |
| North Carolina | $113.7B | 12.7% | 12.0% | 0.7% | 11.4% | +1.3 | +33.6% | +20.2% | +2.2% |
| North Dakota | $7.6B | 9.2% | 8.0% | 1.3% | 11.1% | -1.9 | +8.3% | +10.0% | +1.2% |
| Ohio | $119.1B | 12.2% | 11.1% | 1.1% | 11.3% | +0.9 | +23.6% | +9.5% | +1.3% |
| Oklahoma | $29.2B | 10.6% | 9.6% | 1.0% | 10.1% | +0.5 | +13.9% | +8.1% | +0.8% |
| Oregon | $51.7B | 15.1% | 14.0% | 1.1% | 14.0% | +1.1 | +15.0% | +10.4% | +1.2% |
| Pennsylvania | $135.0B | 12.8% | 11.9% | 0.9% | 12.6% | +0.2 | +14.0% | +5.7% | +0.9% |
| Rhode Island | $12.3B | 13.9% | 13.0% | 0.9% | 14.2% | -0.3 | +20.1% | +11.8% | +1.3% |
| South Carolina | $59.0B | 15.6% | 14.6% | 1.0% | 13.4% | +2.2 | +38.3% | +20.1% | +2.8% |
| South Dakota | $8.0B | 9.7% | 9.1% | 0.6% | 9.2% | +0.5 | +35.3% | +14.1% | not published |
| Tennessee | $74.1B | 12.6% | 11.6% | 1.0% | 11.1% | +1.5 | +34.8% | +20.9% | +2.7% |
| Texas | $373.1B | 12.7% | 11.2% | 1.5% | 10.4% | +2.3 | +43.3% | +29.2% | +2.3% |
| Utah | $44.8B | 14.0% | 11.7% | 2.3% | 12.2% | +1.8 | +38.3% | +26.1% | +3.0% |
| Vermont | $7.3B | 14.6% | 14.2% | 0.5% | 15.4% | -0.8 | +27.9% | +14.2% | not published |
| Virginia | $113.9B | 14.1% | 13.4% | 0.7% | 13.5% | +0.6 | +23.6% | +16.8% | +1.6% |
| Washington | $114.7B | 12.9% | 12.3% | 0.6% | 12.6% | +0.3 | +23.4% | +21.6% | +1.3% |
| West Virginia | $11.2B | 10.1% | 9.3% | 0.7% | 11.2% | -1.1 | +6.0% | +10.1% | +0.9% |
| Wisconsin | $57.1B | 11.9% | 11.0% | 0.9% | 11.7% | +0.2 | +18.4% | +9.3% | +1.1% |
| Wyoming | $6.8B | 13.0% | 11.8% | 1.2% | 11.7% | +1.3 | +24.2% | +4.1% | not published |
State-by-state takeaways
Alabama
Real estate, rental and leasing produced $41.3B of Alabama’s $339.0B economy in 2025, or 12.2% (rank 35 of 51; U.S. 13.7%). That share was 11.4% in 2015 (+0.8 points). After adjusting for inflation, the sector’s output grew 25.7% from 2019 to 2025, vs 15.2% for the whole state economy. In Q2 2026 it was +2.4% from a year earlier (whole economy +1.6%).
Alaska
Real estate, rental and leasing produced $7.2B of Alaska’s $73.6B economy in 2025, or 9.8% (rank 46 of 51; U.S. 13.7%). That share was 10.2% in 2015 (-0.4 points). After adjusting for inflation, the sector’s output grew 7.9% from 2019 to 2025, vs 7.6% for the whole state economy. BEA did not publish quarterly inflation-adjusted figures for this sector in Alaska.
Arizona
Real estate, rental and leasing produced $100.0B of Arizona’s $592.1B economy in 2025, or 16.9% (rank 2 of 51; U.S. 13.7%). That share was 15.4% in 2015 (+1.5 points). After adjusting for inflation, the sector’s output grew 43.4% from 2019 to 2025, vs 25.6% for the whole state economy. In Q2 2026 it was +2.7% from a year earlier (whole economy +1.6%).
Arkansas
Real estate, rental and leasing produced $21.7B of Arkansas’s $196.0B economy in 2025, or 11.1% (rank 41 of 51; U.S. 13.7%). That share was 10.9% in 2015 (+0.2 points). After adjusting for inflation, the sector’s output grew 23.0% from 2019 to 2025, vs 16.3% for the whole state economy. In Q2 2026 it was +1.1% from a year earlier (whole economy +1.1%).
California
Real estate, rental and leasing produced $598.9B of California’s $4,297.4B economy in 2025, or 13.9% (rank 21 of 51; U.S. 13.7%). That share was 13.6% in 2015 (+0.3 points). After adjusting for inflation, the sector’s output grew 16.1% from 2019 to 2025, vs 15.5% for the whole state economy. In Q2 2026 it was +1.3% from a year earlier (whole economy +3.6%).
Colorado
Real estate, rental and leasing produced $90.8B of Colorado’s $574.9B economy in 2025, or 15.8% (rank 4 of 51; U.S. 13.7%). That share was 14.1% in 2015 (+1.7 points). After adjusting for inflation, the sector’s output grew 25.0% from 2019 to 2025, vs 18.0% for the whole state economy. In Q2 2026 it was +1.7% from a year earlier (whole economy +2.4%).
Connecticut
Real estate, rental and leasing produced $50.2B of Connecticut’s $382.6B economy in 2025, or 13.1% (rank 24 of 51; U.S. 13.7%). That share was 12.7% in 2015 (+0.4 points). After adjusting for inflation, the sector’s output grew 5.1% from 2019 to 2025, vs 8.0% for the whole state economy. In Q2 2026 it was +0.8% from a year earlier (whole economy +2.6%).
Delaware
Real estate, rental and leasing produced $17.2B of Delaware’s $121.9B economy in 2025, or 14.1% (rank 15 of 51; U.S. 13.7%). That share was 14.4% in 2015 (-0.3 points). After adjusting for inflation, the sector’s output grew 3.6% from 2019 to 2025, vs 20.6% for the whole state economy. In Q2 2026 it was +4.4% from a year earlier (whole economy +2.3%).
District of Columbia
Real estate, rental and leasing produced $17.2B of District of Columbia’s $193.0B economy in 2025, or 8.9% (rank 49 of 51; U.S. 13.7%). That share was 8.4% in 2015 (+0.5 points). After adjusting for inflation, the sector’s output grew 12.6% from 2019 to 2025, vs 5.7% for the whole state economy. BEA did not publish quarterly inflation-adjusted figures for this sector in District of Columbia.
Florida
Real estate, rental and leasing produced $372.9B of Florida’s $1,805.6B economy in 2025, or 20.7% (rank 1 of 51; U.S. 13.7%). That share was 17.7% in 2015 (+3.0 points). After adjusting for inflation, the sector’s output grew 42.6% from 2019 to 2025, vs 26.9% for the whole state economy. In Q2 2026 it was +2.8% from a year earlier (whole economy +3.0%).
Georgia
Real estate, rental and leasing produced $132.2B of Georgia’s $936.1B economy in 2025, or 14.1% (rank 15 of 51; U.S. 13.7%). That share was 12.1% in 2015 (+2.0 points). After adjusting for inflation, the sector’s output grew 18.2% from 2019 to 2025, vs 16.0% for the whole state economy. In Q2 2026 it was +2.5% from a year earlier (whole economy +1.9%).
Hawaii
Real estate, rental and leasing produced $20.6B of Hawaii’s $123.2B economy in 2025, or 16.7% (rank 3 of 51; U.S. 13.7%). That share was 17.4% in 2015 (-0.7 points). After adjusting for inflation, the sector’s output grew 6.7% from 2019 to 2025, vs 5.1% for the whole state economy. In Q2 2026 it was +1.1% from a year earlier (whole economy +0.7%).
Idaho
Real estate, rental and leasing produced $20.3B of Idaho’s $137.4B economy in 2025, or 14.8% (rank 11 of 51; U.S. 13.7%). That share was 13.1% in 2015 (+1.7 points). After adjusting for inflation, the sector’s output grew 46.8% from 2019 to 2025, vs 27.8% for the whole state economy. In Q2 2026 it was +3.1% from a year earlier (whole economy +4.4%).
Illinois
Real estate, rental and leasing produced $159.0B of Illinois’s $1,241.0B economy in 2025, or 12.8% (rank 27 of 51; U.S. 13.7%). That share was 12.9% in 2015 (-0.1 points). After adjusting for inflation, the sector’s output grew 12.9% from 2019 to 2025, vs 10.4% for the whole state economy. In Q2 2026 it was +0.7% from a year earlier (whole economy +1.8%).
Indiana
Real estate, rental and leasing produced $58.6B of Indiana’s $542.5B economy in 2025, or 10.8% (rank 43 of 51; U.S. 13.7%). That share was 10.2% in 2015 (+0.6 points). After adjusting for inflation, the sector’s output grew 19.5% from 2019 to 2025, vs 14.0% for the whole state economy. In Q2 2026 it was +1.6% from a year earlier (whole economy +1.2%).
Iowa
Real estate, rental and leasing produced $23.9B of Iowa’s $271.9B economy in 2025, or 8.8% (rank 50 of 51; U.S. 13.7%). That share was 9.6% in 2015 (-0.8 points). After adjusting for inflation, the sector’s output grew 3.2% from 2019 to 2025, vs 8.7% for the whole state economy. In Q2 2026 it was +0.9% from a year earlier (whole economy +2.0%).
Kansas
Real estate, rental and leasing produced $26.4B of Kansas’s $232.1B economy in 2025, or 11.4% (rank 39 of 51; U.S. 13.7%). That share was 12.1% in 2015 (-0.7 points). After adjusting for inflation, the sector’s output changed -14.4% from 2019 to 2025, vs +5.3% for the whole state economy. In Q2 2026 it was +1.0% from a year earlier (whole economy +2.3%).
Kentucky
Real estate, rental and leasing produced $35.2B of Kentucky’s $313.6B economy in 2025, or 11.2% (rank 40 of 51; U.S. 13.7%). That share was 10.6% in 2015 (+0.6 points). After adjusting for inflation, the sector’s output grew 20.9% from 2019 to 2025, vs 13.1% for the whole state economy. In Q2 2026 it was +1.5% from a year earlier (whole economy +0.5%).
Louisiana
Real estate, rental and leasing produced $37.4B of Louisiana’s $342.3B economy in 2025, or 10.9% (rank 42 of 51; U.S. 13.7%). That share was 10.9% in 2015 (+0.0 points). After adjusting for inflation, the sector’s output grew 4.9% from 2019 to 2025, vs 7.0% for the whole state economy. In Q2 2026 it was +1.3% from a year earlier (whole economy +0.3%).
Maine
Real estate, rental and leasing produced $15.6B of Maine’s $101.7B economy in 2025, or 15.3% (rank 8 of 51; U.S. 13.7%). That share was 15.6% in 2015 (-0.3 points). After adjusting for inflation, the sector’s output grew 18.9% from 2019 to 2025, vs 15.7% for the whole state economy. In Q2 2026 it was +1.6% from a year earlier (whole economy -0.2%).
Maryland
Real estate, rental and leasing produced $88.7B of Maryland’s $567.0B economy in 2025, or 15.6% (rank 6 of 51; U.S. 13.7%). That share was 15.5% in 2015 (+0.1 points). After adjusting for inflation, the sector’s output grew 14.9% from 2019 to 2025, vs 8.7% for the whole state economy. In Q2 2026 it was +1.2% from a year earlier (whole economy -0.6%).
Massachusetts
Real estate, rental and leasing produced $114.7B of Massachusetts’s $813.6B economy in 2025, or 14.1% (rank 15 of 51; U.S. 13.7%). That share was 13.0% in 2015 (+1.1 points). After adjusting for inflation, the sector’s output grew 20.0% from 2019 to 2025, vs 13.2% for the whole state economy. In Q2 2026 it was +1.3% from a year earlier (whole economy +1.8%).
Michigan
Real estate, rental and leasing produced $100.6B of Michigan’s $733.9B economy in 2025, or 13.7% (rank 23 of 51; U.S. 13.7%). That share was 12.7% in 2015 (+1.0 points). After adjusting for inflation, the sector’s output grew 15.6% from 2019 to 2025, vs 10.4% for the whole state economy. In Q2 2026 it was +1.4% from a year earlier (whole economy +1.9%).
Minnesota
Real estate, rental and leasing produced $65.0B of Minnesota’s $515.1B economy in 2025, or 12.6% (rank 32 of 51; U.S. 13.7%). That share was 12.3% in 2015 (+0.3 points). After adjusting for inflation, the sector’s output grew 17.0% from 2019 to 2025, vs 6.2% for the whole state economy. In Q2 2026 it was +0.6% from a year earlier (whole economy +1.8%).
Mississippi
Real estate, rental and leasing produced $20.0B of Mississippi’s $162.8B economy in 2025, or 12.3% (rank 34 of 51; U.S. 13.7%). That share was 11.3% in 2015 (+1.0 points). After adjusting for inflation, the sector’s output grew 28.0% from 2019 to 2025, vs 11.0% for the whole state economy. In Q2 2026 it was +1.6% from a year earlier (whole economy +0.2%).
Missouri
Real estate, rental and leasing produced $60.3B of Missouri’s $475.4B economy in 2025, or 12.7% (rank 29 of 51; U.S. 13.7%). That share was 12.1% in 2015 (+0.6 points). After adjusting for inflation, the sector’s output grew 26.3% from 2019 to 2025, vs 12.8% for the whole state economy. In Q2 2026 it was +1.6% from a year earlier (whole economy +1.6%).
Montana
Real estate, rental and leasing produced $11.8B of Montana’s $80.9B economy in 2025, or 14.6% (rank 12 of 51; U.S. 13.7%). That share was 13.9% in 2015 (+0.7 points). After adjusting for inflation, the sector’s output grew 31.9% from 2019 to 2025, vs 21.6% for the whole state economy. In Q2 2026 it was +2.0% from a year earlier (whole economy +2.1%).
Nebraska
Real estate, rental and leasing produced $17.6B of Nebraska’s $206.6B economy in 2025, or 8.5% (rank 51 of 51; U.S. 13.7%). That share was 9.3% in 2015 (-0.8 points). After adjusting for inflation, the sector’s output grew 13.5% from 2019 to 2025, vs 22.9% for the whole state economy. In Q2 2026 it was +0.8% from a year earlier (whole economy +2.7%).
Nevada
Real estate, rental and leasing produced $42.6B of Nevada’s $281.4B economy in 2025, or 15.1% (rank 9 of 51; U.S. 13.7%). That share was 15.3% in 2015 (-0.2 points). After adjusting for inflation, the sector’s output grew 31.5% from 2019 to 2025, vs 19.4% for the whole state economy. In Q2 2026 it was +1.7% from a year earlier (whole economy +1.6%).
New Hampshire
Real estate, rental and leasing produced $18.0B of New Hampshire’s $128.3B economy in 2025, or 14.0% (rank 19 of 51; U.S. 13.7%). That share was 15.4% in 2015 (-1.4 points). After adjusting for inflation, the sector’s output grew 24.0% from 2019 to 2025, vs 17.3% for the whole state economy. In Q2 2026 it was +0.9% from a year earlier (whole economy +1.5%).
New Jersey
Real estate, rental and leasing produced $140.0B of New Jersey’s $887.8B economy in 2025, or 15.8% (rank 4 of 51; U.S. 13.7%). That share was 15.9% in 2015 (-0.1 points). After adjusting for inflation, the sector’s output grew 13.3% from 2019 to 2025, vs 11.3% for the whole state economy. In Q2 2026 it was +0.9% from a year earlier (whole economy +1.2%).
New Mexico
Real estate, rental and leasing produced $18.1B of New Mexico’s $152.1B economy in 2025, or 11.9% (rank 37 of 51; U.S. 13.7%). That share was 12.7% in 2015 (-0.8 points). After adjusting for inflation, the sector’s output grew 19.7% from 2019 to 2025, vs 22.2% for the whole state economy. In Q2 2026 it was +1.3% from a year earlier (whole economy -0.4%).
New York
Real estate, rental and leasing produced $351.8B of New York’s $2,465.7B economy in 2025, or 14.3% (rank 14 of 51; U.S. 13.7%). That share was 13.4% in 2015 (+0.9 points). After adjusting for inflation, the sector’s output grew 20.8% from 2019 to 2025, vs 10.9% for the whole state economy. In Q2 2026 it was +0.9% from a year earlier (whole economy +4.6%).
North Carolina
Real estate, rental and leasing produced $113.7B of North Carolina’s $895.9B economy in 2025, or 12.7% (rank 29 of 51; U.S. 13.7%). That share was 11.4% in 2015 (+1.3 points). After adjusting for inflation, the sector’s output grew 33.6% from 2019 to 2025, vs 20.2% for the whole state economy. In Q2 2026 it was +2.2% from a year earlier (whole economy +2.1%).
North Dakota
Real estate, rental and leasing produced $7.6B of North Dakota’s $82.3B economy in 2025, or 9.2% (rank 48 of 51; U.S. 13.7%). That share was 11.1% in 2015 (-1.9 points). After adjusting for inflation, the sector’s output grew 8.3% from 2019 to 2025, vs 10.0% for the whole state economy. In Q2 2026 it was +1.2% from a year earlier (whole economy -0.8%).
Ohio
Real estate, rental and leasing produced $119.1B of Ohio’s $976.9B economy in 2025, or 12.2% (rank 35 of 51; U.S. 13.7%). That share was 11.3% in 2015 (+0.9 points). After adjusting for inflation, the sector’s output grew 23.6% from 2019 to 2025, vs 9.5% for the whole state economy. In Q2 2026 it was +1.3% from a year earlier (whole economy +1.9%).
Oklahoma
Real estate, rental and leasing produced $29.2B of Oklahoma’s $274.3B economy in 2025, or 10.6% (rank 44 of 51; U.S. 13.7%). That share was 10.1% in 2015 (+0.5 points). After adjusting for inflation, the sector’s output grew 13.9% from 2019 to 2025, vs 8.1% for the whole state economy. In Q2 2026 it was +0.8% from a year earlier (whole economy +1.3%).
Oregon
Real estate, rental and leasing produced $51.7B of Oregon’s $343.2B economy in 2025, or 15.1% (rank 9 of 51; U.S. 13.7%). That share was 14.0% in 2015 (+1.1 points). After adjusting for inflation, the sector’s output grew 15.0% from 2019 to 2025, vs 10.4% for the whole state economy. In Q2 2026 it was +1.2% from a year earlier (whole economy +1.1%).
Pennsylvania
Real estate, rental and leasing produced $135.0B of Pennsylvania’s $1,056.5B economy in 2025, or 12.8% (rank 27 of 51; U.S. 13.7%). That share was 12.6% in 2015 (+0.2 points). After adjusting for inflation, the sector’s output grew 14.0% from 2019 to 2025, vs 5.7% for the whole state economy. In Q2 2026 it was +0.9% from a year earlier (whole economy +1.3%).
Rhode Island
Real estate, rental and leasing produced $12.3B of Rhode Island’s $88.2B economy in 2025, or 13.9% (rank 21 of 51; U.S. 13.7%). That share was 14.2% in 2015 (-0.3 points). After adjusting for inflation, the sector’s output grew 20.1% from 2019 to 2025, vs 11.8% for the whole state economy. In Q2 2026 it was +1.3% from a year earlier (whole economy +1.6%).
South Carolina
Real estate, rental and leasing produced $59.0B of South Carolina’s $378.4B economy in 2025, or 15.6% (rank 6 of 51; U.S. 13.7%). That share was 13.4% in 2015 (+2.2 points). After adjusting for inflation, the sector’s output grew 38.3% from 2019 to 2025, vs 20.1% for the whole state economy. In Q2 2026 it was +2.8% from a year earlier (whole economy +2.6%).
South Dakota
Real estate, rental and leasing produced $8.0B of South Dakota’s $82.0B economy in 2025, or 9.7% (rank 47 of 51; U.S. 13.7%). That share was 9.2% in 2015 (+0.5 points). After adjusting for inflation, the sector’s output grew 35.3% from 2019 to 2025, vs 14.1% for the whole state economy. BEA did not publish quarterly inflation-adjusted figures for this sector in South Dakota.
Tennessee
Real estate, rental and leasing produced $74.1B of Tennessee’s $586.2B economy in 2025, or 12.6% (rank 32 of 51; U.S. 13.7%). That share was 11.1% in 2015 (+1.5 points). After adjusting for inflation, the sector’s output grew 34.8% from 2019 to 2025, vs 20.9% for the whole state economy. In Q2 2026 it was +2.7% from a year earlier (whole economy +1.7%).
Texas
Real estate, rental and leasing produced $373.1B of Texas’s $2,932.3B economy in 2025, or 12.7% (rank 29 of 51; U.S. 13.7%). That share was 10.4% in 2015 (+2.3 points). After adjusting for inflation, the sector’s output grew 43.3% from 2019 to 2025, vs 29.2% for the whole state economy. In Q2 2026 it was +2.3% from a year earlier (whole economy +1.7%).
Utah
Real estate, rental and leasing produced $44.8B of Utah’s $319.2B economy in 2025, or 14.0% (rank 19 of 51; U.S. 13.7%). That share was 12.2% in 2015 (+1.8 points). After adjusting for inflation, the sector’s output grew 38.3% from 2019 to 2025, vs 26.1% for the whole state economy. In Q2 2026 it was +3.0% from a year earlier (whole economy +2.5%).
Vermont
Real estate, rental and leasing produced $7.3B of Vermont’s $49.7B economy in 2025, or 14.6% (rank 12 of 51; U.S. 13.7%). That share was 15.4% in 2015 (-0.8 points). After adjusting for inflation, the sector’s output grew 27.9% from 2019 to 2025, vs 14.2% for the whole state economy. BEA did not publish quarterly inflation-adjusted figures for this sector in Vermont.
Virginia
Real estate, rental and leasing produced $113.9B of Virginia’s $807.9B economy in 2025, or 14.1% (rank 15 of 51; U.S. 13.7%). That share was 13.5% in 2015 (+0.6 points). After adjusting for inflation, the sector’s output grew 23.6% from 2019 to 2025, vs 16.8% for the whole state economy. In Q2 2026 it was +1.6% from a year earlier (whole economy +1.0%).
Washington
Real estate, rental and leasing produced $114.7B of Washington’s $892.3B economy in 2025, or 12.9% (rank 26 of 51; U.S. 13.7%). That share was 12.6% in 2015 (+0.3 points). After adjusting for inflation, the sector’s output grew 23.4% from 2019 to 2025, vs 21.6% for the whole state economy. In Q2 2026 it was +1.3% from a year earlier (whole economy +1.7%).
West Virginia
Real estate, rental and leasing produced $11.2B of West Virginia’s $111.3B economy in 2025, or 10.1% (rank 45 of 51; U.S. 13.7%). That share was 11.2% in 2015 (-1.1 points). After adjusting for inflation, the sector’s output grew 6.0% from 2019 to 2025, vs 10.1% for the whole state economy. In Q2 2026 it was +0.9% from a year earlier (whole economy -0.3%).
Wisconsin
Real estate, rental and leasing produced $57.1B of Wisconsin’s $478.8B economy in 2025, or 11.9% (rank 37 of 51; U.S. 13.7%). That share was 11.7% in 2015 (+0.2 points). After adjusting for inflation, the sector’s output grew 18.4% from 2019 to 2025, vs 9.3% for the whole state economy. In Q2 2026 it was +1.1% from a year earlier (whole economy +1.2%).
Wyoming
Real estate, rental and leasing produced $6.8B of Wyoming’s $52.5B economy in 2025, or 13.0% (rank 25 of 51; U.S. 13.7%). That share was 11.7% in 2015 (+1.3 points). After adjusting for inflation, the sector’s output grew 24.2% from 2019 to 2025, vs 4.1% for the whole state economy. BEA did not publish quarterly inflation-adjusted figures for this sector in Wyoming.
Why it matters for small businesses
Where real estate is a big part of the economy, a lot of local spending is tied to housing: agents, property managers, appraisers, cleaners, landscapers and repair trades. That work tends to follow home sales and rents. For the people side of the sector, see real estate agents by state and home services demand by state. For housing market conditions, see where home prices are falling and housing permits vs. builder jobs.
Methods and limits
- Source: U.S. Bureau of Economic Analysis (BEA) Regional API: SAGDP2 (GDP by state in current dollars, annual), SAGDP9 (real GDP, chained 2017 dollars, annual), SQGDP2 and SQGDP9 (quarterly, seasonally adjusted annual rates). BEA last updated these tables Sept. 30, 2026, with revised 2019–2025 annual figures and new figures for Q2 2026.
- Lines used: All industry total (line 1); Real estate and rental and leasing, NAICS 53 (line 56); Real estate, NAICS 531 (line 57); Rental and leasing services and lessors of nonfinancial intangible assets, NAICS 532–533 (line 58).
- Share = sector GDP ÷ all-industry GDP, both in current dollars. Real growth uses chained-dollar values. Chained-dollar components don’t add up exactly to totals.
- The U.S. all-industry total includes a small amount of overseas federal activity not assigned to any state.
- Quarterly real figures not shown by BEA (to avoid disclosing confidential data) are left blank.
Sources
- U.S. Bureau of Economic Analysis, GDP by State (Regional API)
Cite this data
Reporters and bloggers may use these numbers and charts. Please credit StartBusinessByState and link to this page.
Source: StartBusinessByState, “How Much Each State's Economy Leans on Real Estate (2026 Data),” https://startbusinessbystate.com/real-estate-share-of-gdp-by-state/ (updated October 8, 2026).
FAQ
What share of GDP is real estate?
Real estate, rental and leasing was 13.7% of U.S. GDP in 2025, about $4.2 trillion (BEA). Real estate alone was 12.6%.
Which state economy depends most on real estate?
Florida, where real estate, rental and leasing was 20.7% of GDP in 2025, followed by Arizona (16.9%) and Hawaii (16.7%). Nebraska had the smallest share (8.5%).
Why is real estate such a large part of GDP?
Mostly because GDP includes the value of housing. BEA counts rent paid by tenants and an estimate of the rent homeowners would pay to live in their own homes (imputed rent). Commissions, management fees and commercial rents add the rest.
Is the real estate sector growing?
Yes. Its inflation-adjusted output rose 23.0% from 2019 to 2025, faster than total GDP (15.6%). In Q2 2026 it was +1.6% from a year earlier.
Where is this data from?
The U.S. Bureau of Economic Analysis GDP by state tables, pulled through the BEA Regional API.
Last updated October 8, 2026 by StartBusinessByState.