Updated October 13, 2026. Data: U.S. Labor Department weekly initial claims for unemployment benefits by state, not seasonally adjusted, for the 40 weeks ending October 3, 2026, compared with the 40 weeks ending October 4, 2025. New state numbers come out every Thursday.
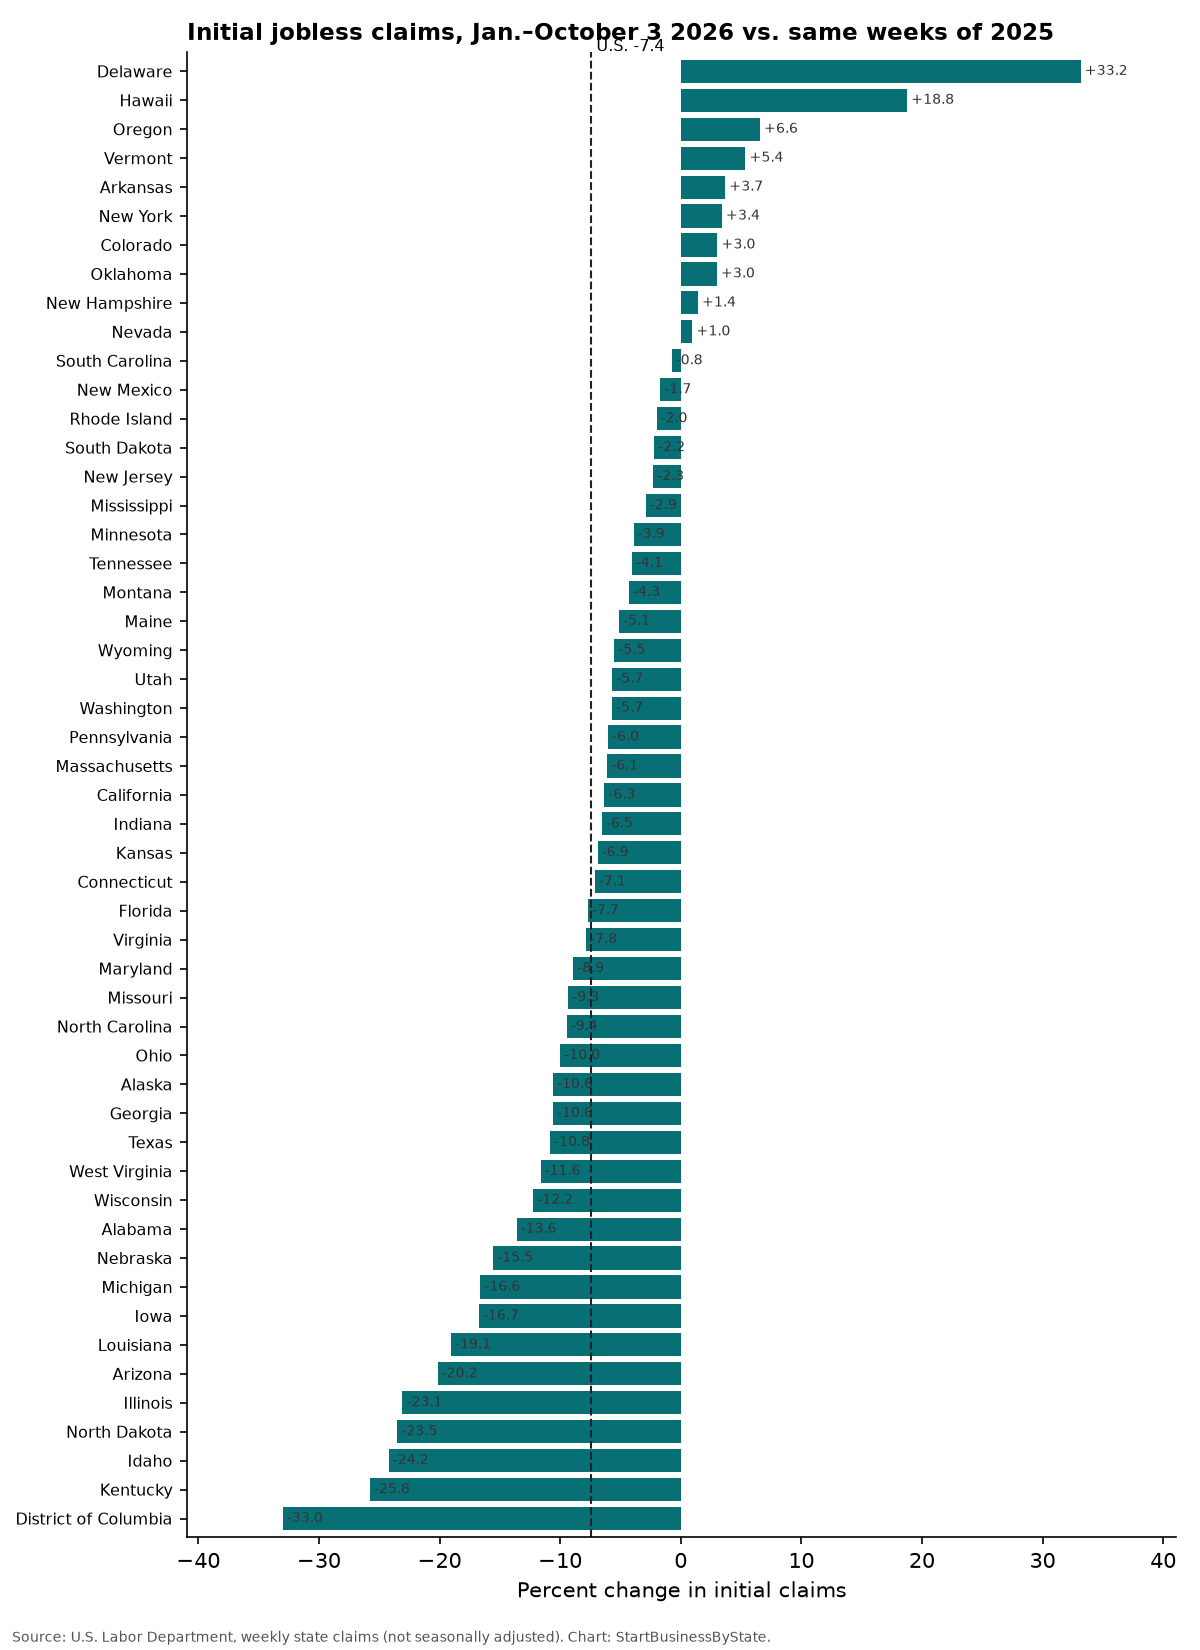
Workers filed 8.12 million first-time claims for unemployment benefits in the 50 states and DC from January through October 3, 2026, 7.4% fewer than in the same weeks of 2025 (8.77 million). Claims rose in 10 states, led by Delaware (+33.2%), Hawaii (+18.8%) and Oregon (+6.6%). The biggest drops were in District of Columbia (-33.0%), Kentucky (-25.8%) and Idaho (-24.2%).
A first-time (initial) claim is filed when someone who lost a job applies for unemployment benefits. It’s one of the quickest signs of layoffs in a state, since the numbers come out weekly. A rise can reflect one large employer, a seasonal pattern or a rule change, so it’s worth checking local news before reading too much into one state.
Change in jobless claims by state
State-by-state table
Click a column to sort.
| State | Claims, Jan.–October 3 2026 | Same weeks, 2025 | Change | Week ending October 3 | Same week, 2025 |
|---|---|---|---|---|---|
| U.S. (50 states + DC) | 8,122,742 | 8,772,806 | -7.4% | 169,707 | 205,526 |
| Alabama | 72,444 | 83,856 | -13.6% | 1,666 | 2,014 |
| Alaska | 18,447 | 20,634 | -10.6% | 496 | 536 |
| Arizona | 111,472 | 139,633 | -20.2% | 2,318 | 2,783 |
| Arkansas | 55,537 | 53,562 | +3.7% | 1,029 | 1,341 |
| California | 1,616,253 | 1,725,394 | -6.3% | 38,757 | 41,254 |
| Colorado | 123,389 | 119,744 | +3.0% | 3,185 | 3,275 |
| Connecticut | 131,125 | 141,179 | -7.1% | 2,061 | 2,264 |
| Delaware | 16,155 | 12,132 | +33.2% | 446 | 253 |
| District of Columbia | 25,993 | 38,791 | -33.0% | 645 | 1,263 |
| Florida | 232,349 | 251,720 | -7.7% | 5,312 | 6,075 |
| Georgia | 186,968 | 209,135 | -10.6% | 3,684 | 4,944 |
| Hawaii | 47,988 | 40,403 | +18.8% | 1,459 | 1,028 |
| Idaho | 32,798 | 43,278 | -24.2% | 674 | 719 |
| Illinois | 318,778 | 414,379 | -23.1% | 6,747 | 10,188 |
| Indiana | 109,445 | 117,098 | -6.5% | 2,240 | 2,945 |
| Iowa | 71,135 | 85,432 | -16.7% | 1,259 | 1,394 |
| Kansas | 50,050 | 53,752 | -6.9% | 931 | 1,161 |
| Kentucky | 86,494 | 116,520 | -25.8% | 1,224 | 4,378 |
| Louisiana | 55,010 | 67,958 | -19.1% | 1,179 | 1,559 |
| Maine | 21,456 | 22,612 | -5.1% | 491 | 474 |
| Maryland | 97,018 | 106,510 | -8.9% | 2,270 | 2,766 |
| Massachusetts | 206,012 | 219,385 | -6.1% | 4,441 | 5,051 |
| Michigan | 258,526 | 310,017 | -16.6% | 4,417 | 6,440 |
| Minnesota | 180,881 | 188,227 | -3.9% | 3,045 | 3,396 |
| Mississippi | 42,312 | 43,571 | -2.9% | 827 | 924 |
| Missouri | 129,369 | 142,684 | -9.3% | 2,177 | 6,244 |
| Montana | 22,005 | 22,988 | -4.3% | 558 | 604 |
| Nebraska | 29,316 | 34,712 | -15.5% | 530 | 1,140 |
| Nevada | 106,958 | 105,934 | +1.0% | 3,271 | 2,689 |
| New Hampshire | 19,148 | 18,878 | +1.4% | 355 | 430 |
| New Jersey | 403,428 | 412,873 | -2.3% | 8,248 | 8,836 |
| New Mexico | 33,405 | 33,977 | -1.7% | 716 | 915 |
| New York | 680,633 | 658,134 | +3.4% | 12,898 | 14,356 |
| North Carolina | 126,541 | 139,745 | -9.4% | 2,802 | 3,316 |
| North Dakota | 13,600 | 17,778 | -23.5% | 227 | 205 |
| Ohio | 220,523 | 245,009 | -10.0% | 4,709 | 5,171 |
| Oklahoma | 57,994 | 56,305 | +3.0% | 1,128 | 1,572 |
| Oregon | 200,871 | 188,484 | +6.6% | 4,100 | 4,605 |
| Pennsylvania | 432,608 | 460,364 | -6.0% | 7,473 | 9,060 |
| Rhode Island | 44,251 | 45,158 | -2.0% | 598 | 831 |
| South Carolina | 95,762 | 96,486 | -0.8% | 1,950 | 2,109 |
| South Dakota | 7,965 | 8,144 | -2.2% | 146 | 172 |
| Tennessee | 128,430 | 133,853 | -4.1% | 2,350 | 3,097 |
| Texas | 625,021 | 700,915 | -10.8% | 13,074 | 17,468 |
| Utah | 55,641 | 58,992 | -5.7% | 1,268 | 1,443 |
| Vermont | 15,556 | 14,764 | +5.4% | 328 | 262 |
| Virginia | 106,926 | 116,024 | -7.8% | 2,344 | 2,803 |
| Washington | 219,903 | 233,165 | -5.7% | 4,788 | 6,105 |
| West Virginia | 28,910 | 32,714 | -11.6% | 487 | 622 |
| Wisconsin | 137,185 | 156,303 | -12.2% | 2,117 | 2,711 |
| Wyoming | 12,758 | 13,501 | -5.5% | 262 | 335 |
What it means for small businesses
- Hiring may be easier where claims are rising, as more experienced workers look for jobs.
- Your tax rate can move. Employers pay state unemployment taxes, and heavy claims can push rates up. See unemployment insurance tax changes by state.
- Laid off and thinking about going solo? Many people start a business after a layoff. See unemployment vs. service hiring by state.
Starting a business after a layoff?
An LLC can separate your business from your personal finances. Form your LLC with ZenBusiness.
We may earn a commission if you use this link. It doesn’t change what you pay, and it doesn’t affect the data on this page.
About the data
- Source: U.S. Labor Department, weekly initial claims by state (not seasonally adjusted), as published by the Federal Reserve Bank of St. Louis. Data as of October 3, 2026.
- Comparison: the 40 weeks ending October 3, 2026 vs. the 40 weeks ending October 4, 2025.
- Revisions: the latest week is an advance figure and may be revised.
- Totals are the sum of the 50 states and DC and leave out Puerto Rico and the Virgin Islands.
Sources
Cite this data
Reporters and bloggers may use these numbers and charts. Please credit StartBusinessByState and link to this page.
Source: StartBusinessByState, “Jobless Claims by State: 2026 vs. 2025,” https://startbusinessbystate.com/jobless-claims-by-state/ (updated October 13, 2026).
FAQ
How many people filed for unemployment in 2026?
8,122,742 first-time claims were filed in the 50 states and DC from January through October 3, 2026, 7.4% fewer than the same weeks of 2025.
Which state has the biggest rise in jobless claims?
Delaware (+33.2%), followed by Hawaii (+18.8%) and Oregon (+6.6%).
Where did claims fall the most?
District of Columbia (-33.0%), Kentucky (-25.8%) and Idaho (-24.2%).
How often is this updated?
The U.S. Labor Department releases claims every Thursday. State figures lag the national number by a week.
What is an initial jobless claim?
A first application for unemployment benefits, usually filed soon after a job loss.
Last updated October 13, 2026 by StartBusinessByState.