2024 data (latest; 2025 data due Dec. 16, 2026) · Source: BLS Census of Fatal Occupational Injuries · Updated by StartBusinessByState
Short answer: What kills workers depends on the trade. Roofers mostly die in falls. Truck drivers mostly die in roadway crashes. At landscaping firms, deaths split almost evenly among vehicles, falls (often from trees) and being struck by objects. Federal data for 2024 show logging, roofing and ironwork have the highest fatality rates among trades.
Key facts (2024)
- 5,070 U.S. workers died from work injuries, a rate of 3.3 per 100,000 full-time-equivalent workers.
- Roofers: 48.7 per 100,000 (104 deaths). At roofing contractors, falls caused 96 of 120 deaths (80%).
- Driver/sales workers and truck drivers: 950 deaths, more than any other occupation. Rate 25.7. At trucking companies, 76% of deaths were transportation incidents.
- Grounds maintenance workers: 20.9 per 100,000 (239 deaths, up from 226 in 2023). Landscaping-services firms lost 246 workers: 69 in transportation incidents, 69 in falls and 66 from contact with objects or equipment.
- Construction had 1,034 deaths, more than any other industry sector; 38% were falls.
Fatal injury rates by trade
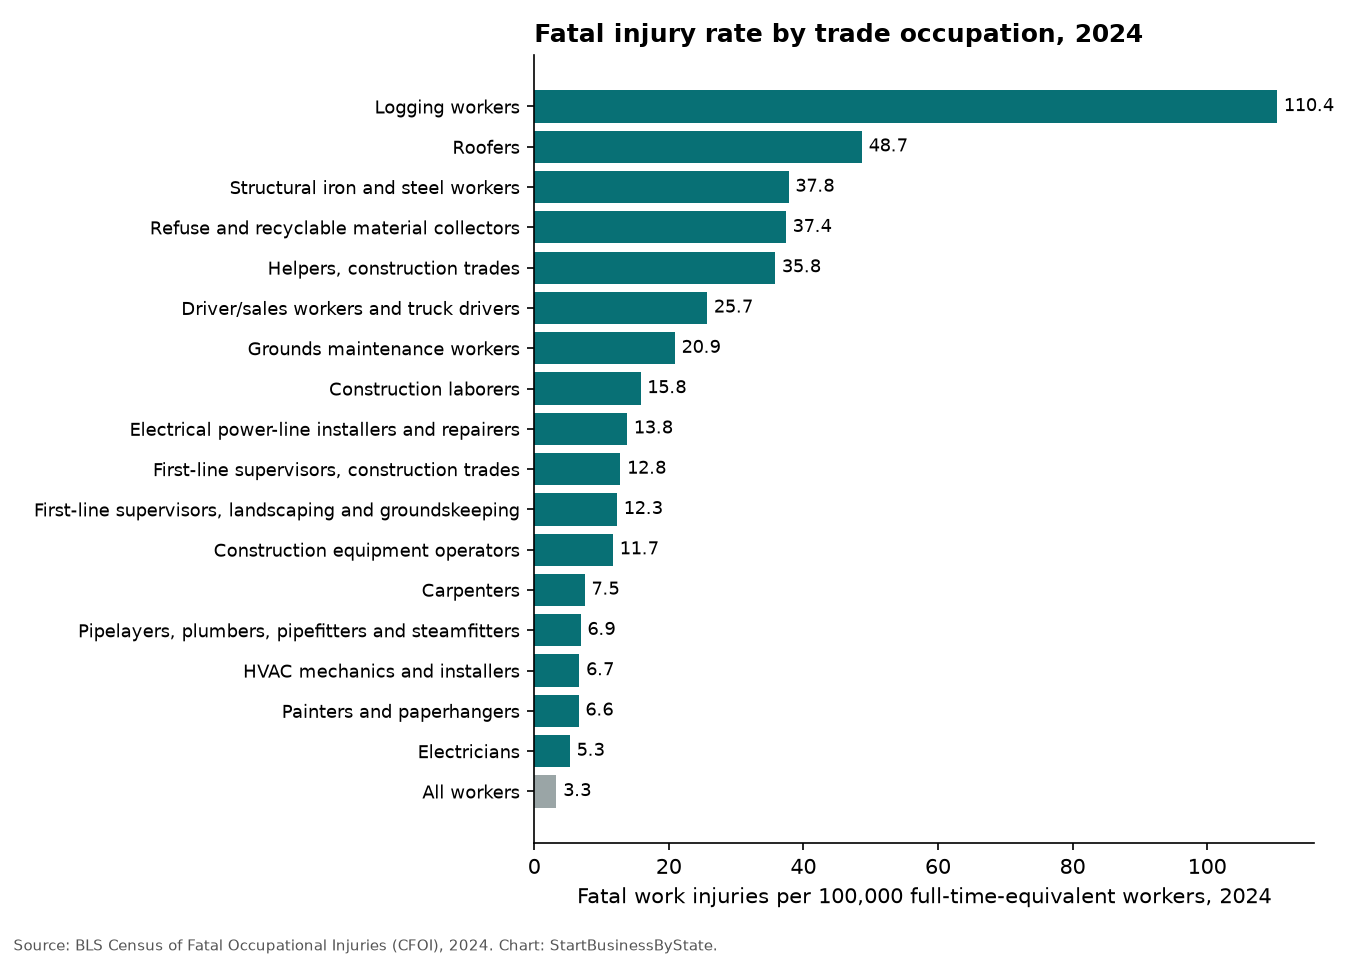
| Occupation | Rate per 100k FTE | Deaths, 2024 | Times all-worker rate |
|---|---|---|---|
| Logging workers | 110.4 | 51 | 33.5× |
| Roofers | 48.7 | 104 | 14.8× |
| Structural iron and steel workers | 37.8 | 14 | 11.5× |
| Refuse and recyclable material collectors | 37.4 | 36 | 11.3× |
| Helpers, construction trades | 35.8 | 18 | 10.8× |
| Driver/sales workers and truck drivers | 25.7 | 950 | 7.8× |
| Grounds maintenance workers | 20.9 | 239 | 6.3× |
| Construction laborers | 15.8 | 334 | 4.8× |
| Electrical power-line installers and repairers | 13.8 | 21 | 4.2× |
| First-line supervisors, construction trades | 12.8 | 105 | 3.9× |
| First-line supervisors, landscaping and groundskeeping | 12.3 | 33 | 3.7× |
| Construction equipment operators | 11.7 | 49 | 3.5× |
| Carpenters | 7.5 | 89 | 2.3× |
| Pipelayers, plumbers, pipefitters and steamfitters | 6.9 | 47 | 2.1× |
| HVAC mechanics and installers | 6.7 | 33 | 2.0× |
| Painters and paperhangers | 6.6 | 32 | 2.0× |
| Electricians | 5.3 | 53 | 1.6× |
| All workers | 3.3 | 5,070 | 1.0× |
Rates are hours-based: deaths per 100,000 full-time-equivalent workers (200 million hours = 100,000 FTE). Small groups have wide error margins; BLS lists ±7.4 for roofers and ±1.3 for grounds maintenance workers. Source: BLS CFOI hours-based rates, 2024.
How deaths happen, by industry
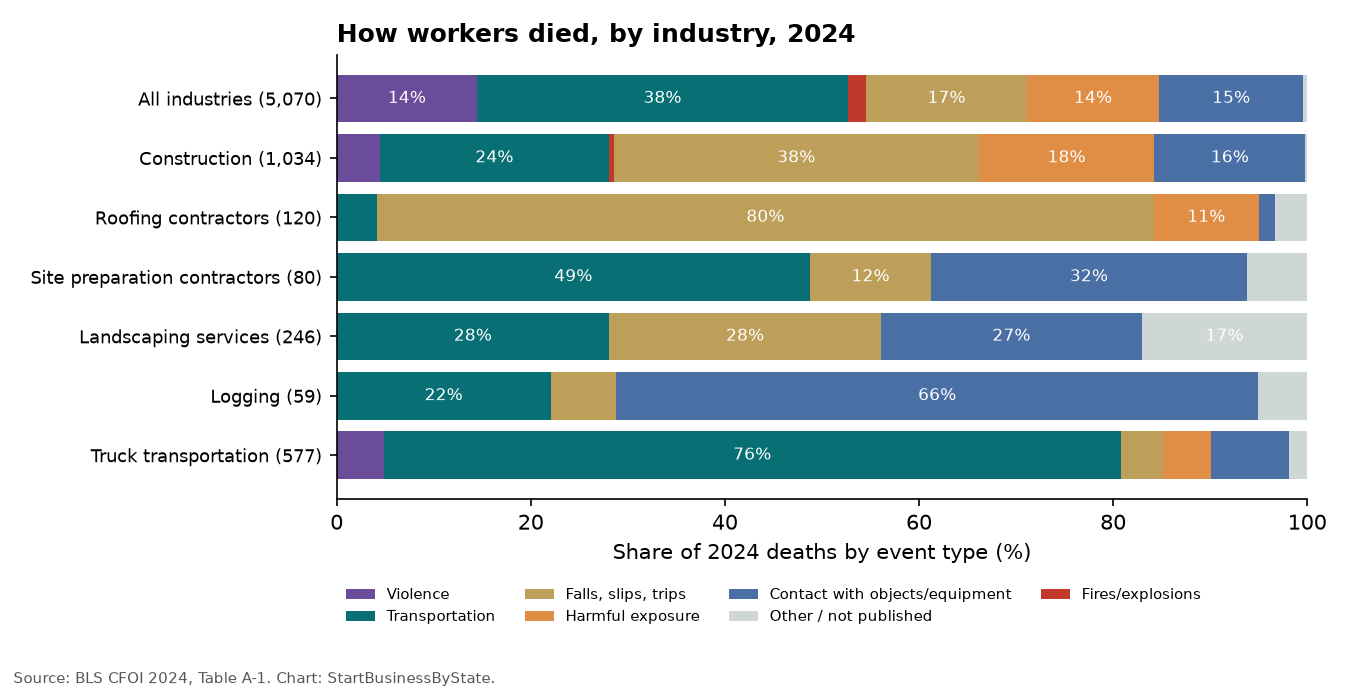
Counts are workers who died at firms classified in each industry (NAICS code), whatever their job title. A dash means BLS didn’t publish the number, usually because it was too small or to protect confidentiality.
| Industry (NAICS) | Total deaths | Violence | Transportation | Fires/explosions | Falls, slips, trips | Harmful exposure | Contact with objects/equipment |
|---|---|---|---|---|---|---|---|
| All industries | 5,070 | 733 | 1,937 | 93 | 844 | 687 | 756 |
| Construction (23) | 1,034 | 46 | 244 | 5 | 389 | 187 | 161 |
| Specialty trade contractors (238) | 606 | 27 | 134 | – | 253 | 106 | 82 |
| Roofing contractors (23816) | 120 | – | 5 | – | 96 | 13 | 2 |
| Framing contractors (23813) | 39 | – | 9 | – | 22 | – | – |
| Electrical contractors (23821) | 59 | – | – | – | 17 | – | 7 |
| Plumbing and HVAC contractors (23822) | 75 | – | 17 | – | 23 | 22 | 8 |
| Residential remodelers (236118) | 64 | – | – | – | 29 | 19 | 6 |
| Site preparation contractors (23891) | 80 | – | 39 | – | 10 | – | 26 |
| Landscaping services (56173) | 246 | – | 69 | – | 69 | – | 66 |
| Logging (1133) | 59 | – | 13 | – | 4 | – | 39 |
| Truck transportation (484) | 577 | 28 | 438 | – | 25 | 29 | 46 |
| Restaurants and other eating places (7225) | 108 | 51 | 10 | – | – | 26 | – |
Source: BLS CFOI 2024, Table A-1. “Contact with objects/equipment” includes being struck by a falling tree or limb and being caught in machinery.
Fatal injury rates by state
The all-industry rate ranges from 1.1 per 100,000 in Rhode Island to 13.9 in Wyoming. States with more mining, oil and gas, farming and long-haul trucking tend to rank higher.
| State | All industries, 2024 (per 100k FTE) |
|---|---|
| Wyoming | 13.9 |
| Mississippi | 8.0 |
| Alaska | 7.1 |
| North Dakota | 6.8 |
| Arkansas | 6.2 |
| Montana | 5.8 |
| South Dakota | 5.8 |
| West Virginia | 5.8 |
| New Jersey | 1.9 |
| New Hampshire | 1.7 |
| Rhode Island | 1.1 |
| U.S. | 3.3 |
Construction alone (selected states, 2024):
| State | Construction rate, 2024 |
|---|---|
| South Dakota | 32.2 |
| Wyoming | 27.1 |
| Mississippi | 22.8 |
| Idaho | 21.5 |
| Louisiana | 13.8 |
| Virginia | 13.6 |
| Maine | 13.2 |
| South Carolina | 12.8 |
| Iowa | 12.5 |
| Pennsylvania | 11.9 |
| Texas | 9.5 |
| Florida | 9.4 |
| California | 6.2 |
Source: BLS fatal injury rates by state and industry, 2024. BLS cautions that state industry rates rest on small counts and differ in worker mix, so they’re not a clean ranking of how safe each state is.
Download the data (CSV)Trade guides and related data
For tree-crew detail, see tree work safety statistics and the arborist license guide. For non-fatal injuries, see workplace injury rates by industry. Trade owners can compare workers’ comp requirements by state, heat protection laws and insurance for landscaping and HVAC businesses. Trade starter guides: landscaping, HVAC, plumbing, electrician. Trucking: trucking industry by state.
Methods and limits
- All figures come from the BLS Census of Fatal Occupational Injuries (CFOI) for 2024, released Feb. 19, 2026 (delayed from its usual December date). We didn’t adjust or estimate anything.
- Occupation rates cover workers in that job in any industry. Industry counts cover all workers at firms in that industry.
- Event categories follow the BLS OIICS system. “Transportation incidents” include roadway crashes and workers struck by vehicles.
- BLS will release 2025 CFOI data on December 16, 2026. We plan to update this page then.
Cite this data
Reporters and bloggers may use these numbers and charts. Please credit StartBusinessByState and link to this page.
Source: StartBusinessByState, “Fatal Injury Rates by Trade: How Roofers, Landscapers, Truckers and Tree Crews Die on the Job,” https://startbusinessbystate.com/fatal-injury-rates-by-trade/ (updated October 7, 2026).
FAQ
What is the most dangerous trade?
Among large construction and outdoor trades, roofers had the highest 2024 fatal injury rate at 48.7 per 100,000 full-time workers. Logging workers were higher still at 110.4.
How do most roofers die?
Falls. At roofing contractors, falls caused 96 of 120 worker deaths in 2024.
How dangerous is landscaping?
Grounds maintenance workers had a 2024 fatal injury rate of 20.9 per 100,000, more than six times the all-worker rate, with 239 deaths.
How many truck drivers die on the job?
950 driver/sales workers and truck drivers died from work injuries in 2024, the most of any occupation. Most deaths were roadway incidents.
Which state has the highest workplace death rate?
Wyoming, at 13.9 per 100,000 full-time workers in 2024. Rhode Island had the lowest at 1.1.
Last updated October 7, 2026 by StartBusinessByState.