Census ACS 2024 (latest) + FHFA prices through Q2 2026 + mortgage rate of 7.40% (October 2026) · Updated by StartBusinessByState
Short answer: Right now, buying a typical home costs more each month than renting one in every state. The gap is biggest in Hawaii, Rhode Island, Montana, Wyoming and Massachusetts, and smallest in Florida, Mississippi, Texas. These monthly costs are modeled: we combine Census home values and rents with the latest home price index and this week’s mortgage rate. A mortgage payment includes principal, which builds equity, so buying isn’t the same as losing that money. The comparison here is only the monthly cash needed.
Key facts for reporters
- Modeled cost to buy the typical U.S. home today: about $2,794 a month ($2,402 principal and interest, $268 property tax, $125 insurance), on a $385,423 home with $38,542 down at 7.40% (Freddie Mac PMMS, 2026-10-08).
- Estimated typical U.S. rent today: $1,397 a month (Census 2024 median contract rent of $1,307, raised 6.9% by the BLS CPI rent index through August 2026).
- Biggest buy-vs-rent gaps (ratio): Hawaii (3.24x), Rhode Island (2.88x), Montana (2.84x), Wyoming (2.80x), Massachusetts (2.67x). Smallest: Florida (1.67x), Mississippi (1.81x), Texas (1.84x), Arizona (1.85x), Georgia (1.87x).
- Biggest gaps in dollars per month: Hawaii (+$4,312), California (+$3,402), District of Columbia (+$3,057), Massachusetts (+$2,964).
- Actual survey costs, 2024: owners with a mortgage paid a median $2,035 a month in total housing costs, and renters paid a median $1,487 in gross rent (Census ACS). In 2019 those were $1,609 and $1,097.
- Since 2019, median gross rent rose 36% and median owner costs with a mortgage rose 26%. Many owners with a mortgage locked in lower rates before 2022.
Cost to buy vs. rent, by state
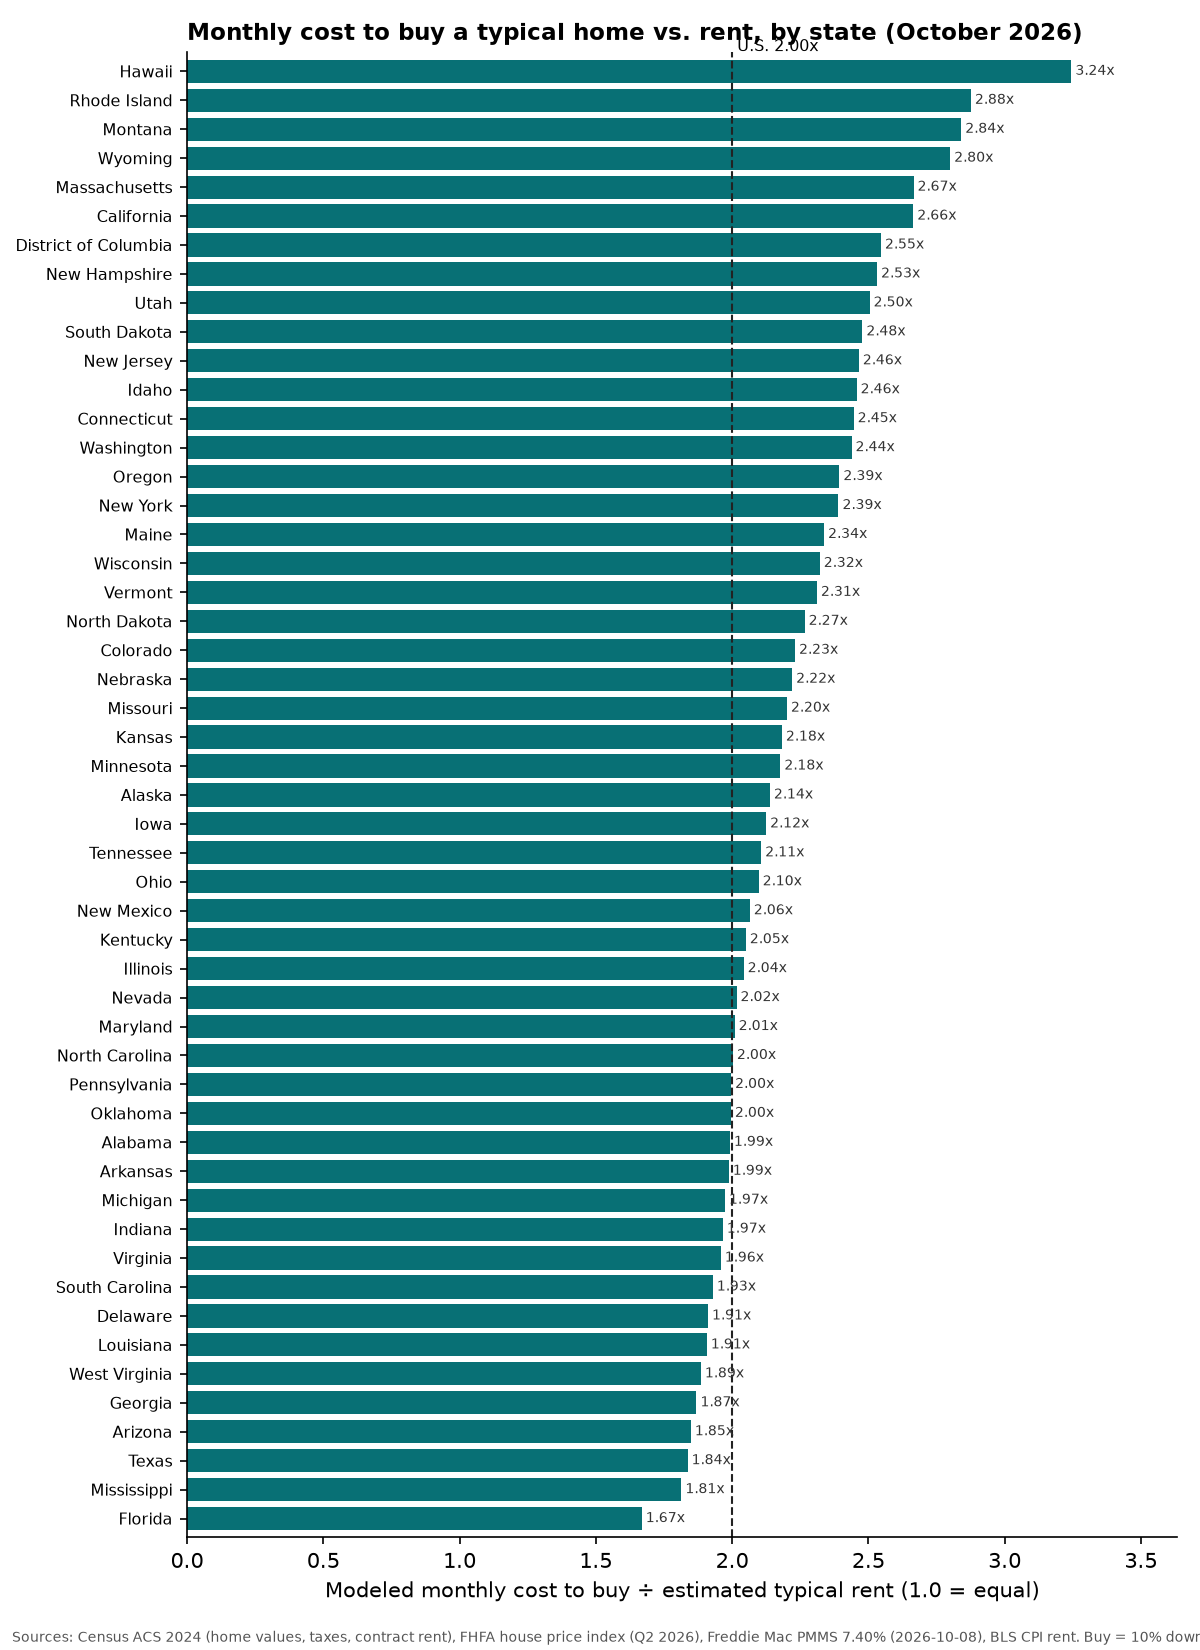
- Hawaii: buy $6,232 vs. rent $1,921 a month (3.24x)
- Rhode Island: buy $3,723 vs. rent $1,294 a month (2.88x)
- Montana: buy $3,197 vs. rent $1,126 a month (2.84x)
- Wyoming: buy $2,604 vs. rent $930 a month (2.80x)
- Massachusetts: buy $4,744 vs. rent $1,780 a month (2.67x)
- California: buy $5,446 vs. rent $2,044 a month (2.66x)
- District of Columbia: buy $5,034 vs. rent $1,977 a month (2.55x)
- New Hampshire: buy $3,807 vs. rent $1,504 a month (2.53x)
- Utah: buy $3,908 vs. rent $1,561 a month (2.50x)
- South Dakota: buy $2,302 vs. rent $929 a month (2.48x)
The ratio is highest where home prices are high compared with rents, as in Hawaii, Rhode Island and Montana. It’s lowest where rents are high compared with home prices, or where prices have grown slowly since 2024, as in Florida (prices +2.1% since 2024 on the FHFA index). The mortgage rate matters a lot. Freddie Mac’s weekly average was 7.40% on October 8, 2026. At a lower rate, every buy figure on this page would drop.
What owners and renters actually pay
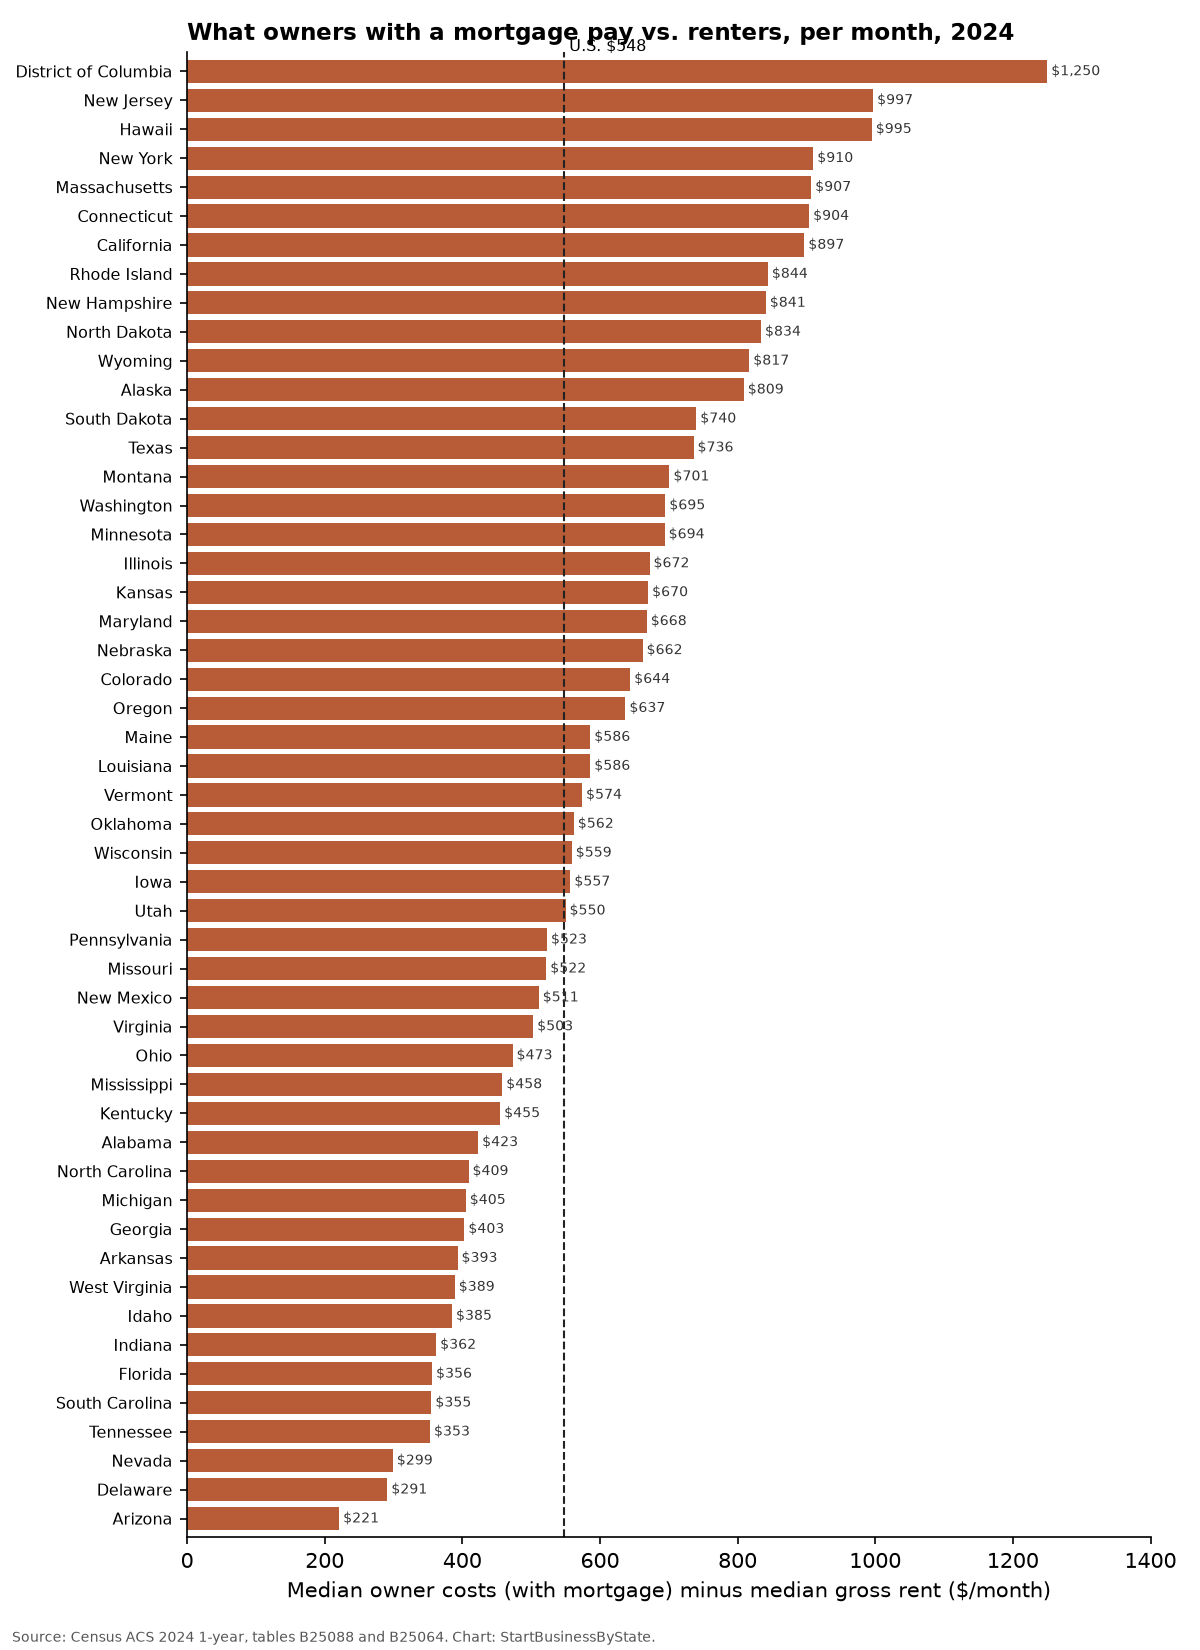
The modeled numbers above are for someone buying today. People already in their homes usually pay less, partly because many locked in low rates before 2022 and bought at lower prices. In 2024, the median owner with a mortgage paid $2,035 a month for all housing costs, including utilities. The median renter paid $1,487, also including utilities. That’s a gap of $548. The gap was largest in District of Columbia ($1,250), New Jersey ($997), Hawaii ($995), New York ($910). Owners who have paid off their mortgage paid a median of just $664 a month. For more on locked-in rates, see mortgage rate lock-in by state. For rents, see fair market rent by state and minimum wage vs. rent.
Rent rose fastest from 2019 to 2024 in Idaho (+57%), Arizona (+52%), Florida (+46%), Nevada (+46%). Nationally, renters spent a median 30.9% of household income on rent, and owners with a mortgage spent 21.4%.
Rent vs. own costs by state
Monthly dollars. “Buy” and “rent” are modeled for October 2026. The last three columns are actual 2024 Census survey figures. Click a column to sort.
| State | Buy: monthly cost | Rent: estimated | Ratio | Modeled home price | Principal + interest | Property tax | Insurance | Owners with mortgage, 2024 | Gross rent, 2024 | Homeownership rate |
|---|---|---|---|---|---|---|---|---|---|---|
| U.S. | $2,794 | $1,397 | 2.00x | $385,423 | $2,402 | $268 | $125 | $2,035 | $1,487 | 65% |
| Alabama | $1,765 | $886 | 1.99x | $251,259 | $1,566 | $74 | $125 | $1,500 | $1,077 | 71% |
| Alaska | $2,992 | $1,399 | 2.14x | $409,615 | $2,552 | $331 | $108 | $2,253 | $1,444 | 67% |
| Arizona | $2,985 | $1,615 | 1.85x | $438,601 | $2,733 | $152 | $100 | $1,893 | $1,672 | 68% |
| Arkansas | $1,653 | $832 | 1.99x | $230,325 | $1,435 | $93 | $125 | $1,375 | $982 | 67% |
| California | $5,446 | $2,044 | 2.66x | $782,037 | $4,873 | $447 | $125 | $3,001 | $2,104 | 56% |
| Colorado | $4,065 | $1,822 | 2.23x | $583,800 | $3,638 | $236 | $192 | $2,466 | $1,822 | 66% |
| Connecticut | $3,482 | $1,424 | 2.45x | $449,551 | $2,801 | $548 | $133 | $2,454 | $1,550 | 67% |
| Delaware | $2,725 | $1,426 | 1.91x | $400,602 | $2,496 | $146 | $83 | $1,821 | $1,530 | 74% |
| District of Columbia | $5,034 | $1,977 | 2.55x | $730,428 | $4,552 | $383 | $100 | $3,181 | $1,931 | 41% |
| Florida | $2,982 | $1,787 | 1.67x | $405,041 | $2,524 | $249 | $208 | $2,168 | $1,812 | 68% |
| Georgia | $2,585 | $1,383 | 1.87x | $360,645 | $2,247 | $213 | $125 | $1,909 | $1,506 | 66% |
| Hawaii | $6,232 | $1,921 | 3.24x | $948,191 | $5,909 | $199 | $125 | $2,937 | $1,942 | 62% |
| Idaho | $3,209 | $1,306 | 2.46x | $474,669 | $2,958 | $159 | $92 | $1,769 | $1,384 | 72% |
| Illinois | $2,530 | $1,239 | 2.04x | $316,442 | $1,972 | $450 | $108 | $1,994 | $1,322 | 68% |
| Indiana | $1,922 | $978 | 1.97x | $267,078 | $1,664 | $150 | $108 | $1,466 | $1,104 | 71% |
| Iowa | $1,892 | $890 | 2.12x | $244,236 | $1,522 | $245 | $125 | $1,538 | $981 | 71% |
| Kansas | $2,032 | $931 | 2.18x | $259,439 | $1,617 | $249 | $167 | $1,749 | $1,079 | 68% |
| Kentucky | $1,790 | $873 | 2.05x | $247,044 | $1,539 | $134 | $117 | $1,453 | $998 | 68% |
| Louisiana | $1,767 | $927 | 1.91x | $235,652 | $1,468 | $99 | $200 | $1,650 | $1,064 | 68% |
| Maine | $2,668 | $1,142 | 2.34x | $373,311 | $2,326 | $259 | $83 | $1,796 | $1,210 | 73% |
| Maryland | $3,344 | $1,664 | 2.01x | $462,462 | $2,882 | $345 | $117 | $2,389 | $1,721 | 68% |
| Massachusetts | $4,744 | $1,780 | 2.67x | $657,244 | $4,096 | $507 | $142 | $2,755 | $1,848 | 62% |
| Michigan | $2,088 | $1,058 | 1.97x | $280,439 | $1,748 | $249 | $92 | $1,573 | $1,168 | 73% |
| Minnesota | $2,748 | $1,262 | 2.18x | $368,760 | $2,298 | $292 | $158 | $1,985 | $1,291 | 72% |
| Mississippi | $1,497 | $825 | 1.81x | $201,125 | $1,253 | $102 | $142 | $1,448 | $990 | 71% |
| Missouri | $2,023 | $919 | 2.20x | $276,249 | $1,721 | $168 | $133 | $1,589 | $1,067 | 69% |
| Montana | $3,197 | $1,126 | 2.84x | $452,383 | $2,819 | $245 | $133 | $1,878 | $1,177 | 69% |
| Nebraska | $2,245 | $1,011 | 2.22x | $282,161 | $1,758 | $312 | $175 | $1,764 | $1,102 | 67% |
| Nevada | $3,252 | $1,613 | 2.02x | $479,782 | $2,990 | $179 | $83 | $2,008 | $1,709 | 60% |
| New Hampshire | $3,807 | $1,504 | 2.53x | $505,251 | $3,148 | $559 | $100 | $2,399 | $1,558 | 73% |
| New Jersey | $4,363 | $1,770 | 2.46x | $557,605 | $3,475 | $780 | $108 | $2,797 | $1,800 | 64% |
| New Mexico | $2,110 | $1,022 | 2.06x | $298,791 | $1,862 | $148 | $100 | $1,628 | $1,117 | 71% |
| New York | $3,799 | $1,589 | 2.39x | $506,102 | $3,154 | $545 | $100 | $2,544 | $1,634 | 54% |
| North Carolina | $2,477 | $1,237 | 2.00x | $352,746 | $2,198 | $170 | $108 | $1,747 | $1,338 | 67% |
| North Dakota | $2,165 | $956 | 2.27x | $293,324 | $1,828 | $212 | $125 | $1,814 | $980 | 61% |
| Ohio | $1,993 | $950 | 2.10x | $264,513 | $1,648 | $245 | $100 | $1,563 | $1,090 | 68% |
| Oklahoma | $1,796 | $900 | 2.00x | $236,414 | $1,473 | $139 | $183 | $1,606 | $1,044 | 66% |
| Oregon | $3,643 | $1,522 | 2.39x | $517,825 | $3,227 | $325 | $92 | $2,234 | $1,597 | 63% |
| Pennsylvania | $2,264 | $1,134 | 2.00x | $306,927 | $1,913 | $268 | $83 | $1,775 | $1,252 | 69% |
| Rhode Island | $3,723 | $1,294 | 2.88x | $508,003 | $3,166 | $407 | $150 | $2,262 | $1,418 | 63% |
| South Carolina | $2,243 | $1,163 | 1.93x | $324,749 | $2,024 | $111 | $108 | $1,627 | $1,272 | 72% |
| South Dakota | $2,302 | $929 | 2.48x | $307,291 | $1,915 | $245 | $142 | $1,739 | $999 | 68% |
| Tennessee | $2,439 | $1,158 | 2.11x | $352,714 | $2,198 | $124 | $117 | $1,637 | $1,284 | 67% |
| Texas | $2,540 | $1,383 | 1.84x | $323,281 | $2,014 | $342 | $183 | $2,211 | $1,475 | 62% |
| Utah | $3,908 | $1,561 | 2.50x | $577,035 | $3,596 | $221 | $92 | $2,143 | $1,593 | 70% |
| Vermont | $2,893 | $1,252 | 2.31x | $383,612 | $2,390 | $419 | $83 | $1,893 | $1,319 | 73% |
| Virginia | $3,071 | $1,568 | 1.96x | $438,322 | $2,731 | $239 | $100 | $2,149 | $1,646 | 67% |
| Washington | $4,409 | $1,809 | 2.44x | $628,292 | $3,915 | $394 | $100 | $2,519 | $1,824 | 63% |
| West Virginia | $1,348 | $715 | 1.89x | $191,189 | $1,191 | $73 | $83 | $1,272 | $883 | 76% |
| Wisconsin | $2,457 | $1,058 | 2.32x | $330,304 | $2,058 | $307 | $92 | $1,701 | $1,142 | 68% |
| Wyoming | $2,604 | $930 | 2.80x | $370,415 | $2,308 | $162 | $133 | $1,815 | $998 | 72% |
State-by-state notes
Alabama
In Alabama, a buyer of a typical home today would pay about $1,765 a month (mortgage, property tax and insurance), compared with an estimated $886 in typical rent. That’s 1.99 times as much (rank 38 of 51, where 1 is the biggest gap). The modeled price is $251,259, based on the 2024 Census median value ($233,300) and the state’s FHFA price index (+7.7% since 2024). Among people already in their homes in 2024, owners with a mortgage paid a median $1,500 a month in total costs, and renters paid $1,077 including utilities. Since 2019, median rent rose 33% and owner costs rose 28%. 71% of homes are owner-occupied.
Alaska
In Alaska, a buyer of a typical home today would pay about $2,992 a month (mortgage, property tax and insurance), compared with an estimated $1,399 in typical rent. That’s 2.14 times as much (rank 26 of 51, where 1 is the biggest gap). The modeled price is $409,615, based on the 2024 Census median value ($376,500) and the state’s FHFA price index (+8.8% since 2024). Among people already in their homes in 2024, owners with a mortgage paid a median $2,253 a month in total costs, and renters paid $1,444 including utilities. Since 2019, median rent rose 20% and owner costs rose 20%. 67% of homes are owner-occupied.
Arizona
In Arizona, a buyer of a typical home today would pay about $2,985 a month (mortgage, property tax and insurance), compared with an estimated $1,615 in typical rent. That’s 1.85 times as much (rank 48 of 51, where 1 is the biggest gap). The modeled price is $438,601, based on the 2024 Census median value ($426,000) and the state’s FHFA price index (+3.0% since 2024). Among people already in their homes in 2024, owners with a mortgage paid a median $1,893 a month in total costs, and renters paid $1,672 including utilities. Since 2019, median rent rose 52% and owner costs rose 30%. 68% of homes are owner-occupied.
Arkansas
In Arkansas, a buyer of a typical home today would pay about $1,653 a month (mortgage, property tax and insurance), compared with an estimated $832 in typical rent. That’s 1.99 times as much (rank 39 of 51, where 1 is the biggest gap). The modeled price is $230,325, based on the 2024 Census median value ($215,600) and the state’s FHFA price index (+6.8% since 2024). Among people already in their homes in 2024, owners with a mortgage paid a median $1,375 a month in total costs, and renters paid $982 including utilities. Since 2019, median rent rose 32% and owner costs rose 26%. 67% of homes are owner-occupied.
California
In California, a buyer of a typical home today would pay about $5,446 a month (mortgage, property tax and insurance), compared with an estimated $2,044 in typical rent. That’s 2.66 times as much (rank 6 of 51, where 1 is the biggest gap). The modeled price is $782,037, based on the 2024 Census median value ($759,500) and the state’s FHFA price index (+3.0% since 2024). Among people already in their homes in 2024, owners with a mortgage paid a median $3,001 a month in total costs, and renters paid $2,104 including utilities. Since 2019, median rent rose 30% and owner costs rose 24%. 56% of homes are owner-occupied.
Colorado
In Colorado, a buyer of a typical home today would pay about $4,065 a month (mortgage, property tax and insurance), compared with an estimated $1,822 in typical rent. That’s 2.23 times as much (rank 21 of 51, where 1 is the biggest gap). The modeled price is $583,800, based on the 2024 Census median value ($574,600) and the state’s FHFA price index (+1.6% since 2024). Among people already in their homes in 2024, owners with a mortgage paid a median $2,466 a month in total costs, and renters paid $1,822 including utilities. Since 2019, median rent rose 33% and owner costs rose 34%. 66% of homes are owner-occupied.
Connecticut
In Connecticut, a buyer of a typical home today would pay about $3,482 a month (mortgage, property tax and insurance), compared with an estimated $1,424 in typical rent. That’s 2.45 times as much (rank 13 of 51, where 1 is the biggest gap). The modeled price is $449,551, based on the 2024 Census median value ($396,900) and the state’s FHFA price index (+13.3% since 2024). Among people already in their homes in 2024, owners with a mortgage paid a median $2,454 a month in total costs, and renters paid $1,550 including utilities. Since 2019, median rent rose 32% and owner costs rose 18%. 67% of homes are owner-occupied.
Delaware
In Delaware, a buyer of a typical home today would pay about $2,725 a month (mortgage, property tax and insurance), compared with an estimated $1,426 in typical rent. That’s 1.91 times as much (rank 44 of 51, where 1 is the biggest gap). The modeled price is $400,602, based on the 2024 Census median value ($371,600) and the state’s FHFA price index (+7.8% since 2024). Among people already in their homes in 2024, owners with a mortgage paid a median $1,821 a month in total costs, and renters paid $1,530 including utilities. Since 2019, median rent rose 37% and owner costs rose 17%. 74% of homes are owner-occupied.
District of Columbia
In District of Columbia, a buyer of a typical home today would pay about $5,034 a month (mortgage, property tax and insurance), compared with an estimated $1,977 in typical rent. That’s 2.55 times as much (rank 7 of 51, where 1 is the biggest gap). The modeled price is $730,428, based on the 2024 Census median value ($733,400) and the state’s FHFA price index (-0.4% since 2024). Among people already in their homes in 2024, owners with a mortgage paid a median $3,181 a month in total costs, and renters paid $1,931 including utilities. Since 2019, median rent rose 20% and owner costs rose 19%. 41% of homes are owner-occupied.
Florida
In Florida, a buyer of a typical home today would pay about $2,982 a month (mortgage, property tax and insurance), compared with an estimated $1,787 in typical rent. That’s 1.67 times as much (rank 51 of 51, where 1 is the biggest gap). The modeled price is $405,041, based on the 2024 Census median value ($396,900) and the state’s FHFA price index (+2.1% since 2024). Among people already in their homes in 2024, owners with a mortgage paid a median $2,168 a month in total costs, and renters paid $1,812 including utilities. Since 2019, median rent rose 46% and owner costs rose 42%. 68% of homes are owner-occupied.
Georgia
In Georgia, a buyer of a typical home today would pay about $2,585 a month (mortgage, property tax and insurance), compared with an estimated $1,383 in typical rent. That’s 1.87 times as much (rank 47 of 51, where 1 is the biggest gap). The modeled price is $360,645, based on the 2024 Census median value ($343,300) and the state’s FHFA price index (+5.1% since 2024). Among people already in their homes in 2024, owners with a mortgage paid a median $1,909 a month in total costs, and renters paid $1,506 including utilities. Since 2019, median rent rose 44% and owner costs rose 32%. 66% of homes are owner-occupied.
Hawaii
In Hawaii, a buyer of a typical home today would pay about $6,232 a month (mortgage, property tax and insurance), compared with an estimated $1,921 in typical rent. That’s 3.24 times as much (rank 1 of 51, where 1 is the biggest gap). The modeled price is $948,191, based on the 2024 Census median value ($875,900) and the state’s FHFA price index (+8.3% since 2024). Among people already in their homes in 2024, owners with a mortgage paid a median $2,937 a month in total costs, and renters paid $1,942 including utilities. Since 2019, median rent rose 18% and owner costs rose 19%. 62% of homes are owner-occupied.
Idaho
In Idaho, a buyer of a typical home today would pay about $3,209 a month (mortgage, property tax and insurance), compared with an estimated $1,306 in typical rent. That’s 2.46 times as much (rank 12 of 51, where 1 is the biggest gap). The modeled price is $474,669, based on the 2024 Census median value ($446,400) and the state’s FHFA price index (+6.3% since 2024). Among people already in their homes in 2024, owners with a mortgage paid a median $1,769 a month in total costs, and renters paid $1,384 including utilities. Since 2019, median rent rose 57% and owner costs rose 35%. 72% of homes are owner-occupied.
Illinois
In Illinois, a buyer of a typical home today would pay about $2,530 a month (mortgage, property tax and insurance), compared with an estimated $1,239 in typical rent. That’s 2.04 times as much (rank 32 of 51, where 1 is the biggest gap). The modeled price is $316,442, based on the 2024 Census median value ($280,700) and the state’s FHFA price index (+12.7% since 2024). Among people already in their homes in 2024, owners with a mortgage paid a median $1,994 a month in total costs, and renters paid $1,322 including utilities. Since 2019, median rent rose 30% and owner costs rose 18%. 68% of homes are owner-occupied.
Indiana
In Indiana, a buyer of a typical home today would pay about $1,922 a month (mortgage, property tax and insurance), compared with an estimated $978 in typical rent. That’s 1.97 times as much (rank 41 of 51, where 1 is the biggest gap). The modeled price is $267,078, based on the 2024 Census median value ($243,500) and the state’s FHFA price index (+9.7% since 2024). Among people already in their homes in 2024, owners with a mortgage paid a median $1,466 a month in total costs, and renters paid $1,104 including utilities. Since 2019, median rent rose 31% and owner costs rose 28%. 71% of homes are owner-occupied.
Iowa
In Iowa, a buyer of a typical home today would pay about $1,892 a month (mortgage, property tax and insurance), compared with an estimated $890 in typical rent. That’s 2.12 times as much (rank 27 of 51, where 1 is the biggest gap). The modeled price is $244,236, based on the 2024 Census median value ($227,300) and the state’s FHFA price index (+7.5% since 2024). Among people already in their homes in 2024, owners with a mortgage paid a median $1,538 a month in total costs, and renters paid $981 including utilities. Since 2019, median rent rose 21% and owner costs rose 21%. 71% of homes are owner-occupied.
Kansas
In Kansas, a buyer of a typical home today would pay about $2,032 a month (mortgage, property tax and insurance), compared with an estimated $931 in typical rent. That’s 2.18 times as much (rank 24 of 51, where 1 is the biggest gap). The modeled price is $259,439, based on the 2024 Census median value ($238,700) and the state’s FHFA price index (+8.7% since 2024). Among people already in their homes in 2024, owners with a mortgage paid a median $1,749 a month in total costs, and renters paid $1,079 including utilities. Since 2019, median rent rose 25% and owner costs rose 26%. 68% of homes are owner-occupied.
Kentucky
In Kentucky, a buyer of a typical home today would pay about $1,790 a month (mortgage, property tax and insurance), compared with an estimated $873 in typical rent. That’s 2.05 times as much (rank 31 of 51, where 1 is the biggest gap). The modeled price is $247,044, based on the 2024 Census median value ($226,000) and the state’s FHFA price index (+9.3% since 2024). Among people already in their homes in 2024, owners with a mortgage paid a median $1,453 a month in total costs, and renters paid $998 including utilities. Since 2019, median rent rose 29% and owner costs rose 23%. 68% of homes are owner-occupied.
Louisiana
In Louisiana, a buyer of a typical home today would pay about $1,767 a month (mortgage, property tax and insurance), compared with an estimated $927 in typical rent. That’s 1.91 times as much (rank 45 of 51, where 1 is the biggest gap). The modeled price is $235,652, based on the 2024 Census median value ($223,200) and the state’s FHFA price index (+5.6% since 2024). Among people already in their homes in 2024, owners with a mortgage paid a median $1,650 a month in total costs, and renters paid $1,064 including utilities. Since 2019, median rent rose 23% and owner costs rose 29%. 68% of homes are owner-occupied.
Maine
In Maine, a buyer of a typical home today would pay about $2,668 a month (mortgage, property tax and insurance), compared with an estimated $1,142 in typical rent. That’s 2.34 times as much (rank 17 of 51, where 1 is the biggest gap). The modeled price is $373,311, based on the 2024 Census median value ($341,900) and the state’s FHFA price index (+9.2% since 2024). Among people already in their homes in 2024, owners with a mortgage paid a median $1,796 a month in total costs, and renters paid $1,210 including utilities. Since 2019, median rent rose 39% and owner costs rose 29%. 73% of homes are owner-occupied.
Maryland
In Maryland, a buyer of a typical home today would pay about $3,344 a month (mortgage, property tax and insurance), compared with an estimated $1,664 in typical rent. That’s 2.01 times as much (rank 34 of 51, where 1 is the biggest gap). The modeled price is $462,462, based on the 2024 Census median value ($436,300) and the state’s FHFA price index (+6.0% since 2024). Among people already in their homes in 2024, owners with a mortgage paid a median $2,389 a month in total costs, and renters paid $1,721 including utilities. Since 2019, median rent rose 23% and owner costs rose 19%. 68% of homes are owner-occupied.
Massachusetts
In Massachusetts, a buyer of a typical home today would pay about $4,744 a month (mortgage, property tax and insurance), compared with an estimated $1,780 in typical rent. That’s 2.67 times as much (rank 5 of 51, where 1 is the biggest gap). The modeled price is $657,244, based on the 2024 Census median value ($607,400) and the state’s FHFA price index (+8.2% since 2024). Among people already in their homes in 2024, owners with a mortgage paid a median $2,755 a month in total costs, and renters paid $1,848 including utilities. Since 2019, median rent rose 36% and owner costs rose 21%. 62% of homes are owner-occupied.
Michigan
In Michigan, a buyer of a typical home today would pay about $2,088 a month (mortgage, property tax and insurance), compared with an estimated $1,058 in typical rent. That’s 1.97 times as much (rank 40 of 51, where 1 is the biggest gap). The modeled price is $280,439, based on the 2024 Census median value ($254,200) and the state’s FHFA price index (+10.3% since 2024). Among people already in their homes in 2024, owners with a mortgage paid a median $1,573 a month in total costs, and renters paid $1,168 including utilities. Since 2019, median rent rose 32% and owner costs rose 22%. 73% of homes are owner-occupied.
Minnesota
In Minnesota, a buyer of a typical home today would pay about $2,748 a month (mortgage, property tax and insurance), compared with an estimated $1,262 in typical rent. That’s 2.18 times as much (rank 25 of 51, where 1 is the biggest gap). The modeled price is $368,760, based on the 2024 Census median value ($344,600) and the state’s FHFA price index (+7.0% since 2024). Among people already in their homes in 2024, owners with a mortgage paid a median $1,985 a month in total costs, and renters paid $1,291 including utilities. Since 2019, median rent rose 27% and owner costs rose 24%. 72% of homes are owner-occupied.
Mississippi
In Mississippi, a buyer of a typical home today would pay about $1,497 a month (mortgage, property tax and insurance), compared with an estimated $825 in typical rent. That’s 1.81 times as much (rank 50 of 51, where 1 is the biggest gap). The modeled price is $201,125, based on the 2024 Census median value ($186,500) and the state’s FHFA price index (+7.8% since 2024). Among people already in their homes in 2024, owners with a mortgage paid a median $1,448 a month in total costs, and renters paid $990 including utilities. Since 2019, median rent rose 27% and owner costs rose 26%. 71% of homes are owner-occupied.
Missouri
In Missouri, a buyer of a typical home today would pay about $2,023 a month (mortgage, property tax and insurance), compared with an estimated $919 in typical rent. That’s 2.20 times as much (rank 23 of 51, where 1 is the biggest gap). The modeled price is $276,249, based on the 2024 Census median value ($254,400) and the state’s FHFA price index (+8.6% since 2024). Among people already in their homes in 2024, owners with a mortgage paid a median $1,589 a month in total costs, and renters paid $1,067 including utilities. Since 2019, median rent rose 28% and owner costs rose 25%. 69% of homes are owner-occupied.
Montana
In Montana, a buyer of a typical home today would pay about $3,197 a month (mortgage, property tax and insurance), compared with an estimated $1,126 in typical rent. That’s 2.84 times as much (rank 3 of 51, where 1 is the biggest gap). The modeled price is $452,383, based on the 2024 Census median value ($425,400) and the state’s FHFA price index (+6.3% since 2024). Among people already in their homes in 2024, owners with a mortgage paid a median $1,878 a month in total costs, and renters paid $1,177 including utilities. Since 2019, median rent rose 42% and owner costs rose 28%. 69% of homes are owner-occupied.
Nebraska
In Nebraska, a buyer of a typical home today would pay about $2,245 a month (mortgage, property tax and insurance), compared with an estimated $1,011 in typical rent. That’s 2.22 times as much (rank 22 of 51, where 1 is the biggest gap). The modeled price is $282,161, based on the 2024 Census median value ($263,100) and the state’s FHFA price index (+7.2% since 2024). Among people already in their homes in 2024, owners with a mortgage paid a median $1,764 a month in total costs, and renters paid $1,102 including utilities. Since 2019, median rent rose 28% and owner costs rose 24%. 67% of homes are owner-occupied.
Nevada
In Nevada, a buyer of a typical home today would pay about $3,252 a month (mortgage, property tax and insurance), compared with an estimated $1,613 in typical rent. That’s 2.02 times as much (rank 33 of 51, where 1 is the biggest gap). The modeled price is $479,782, based on the 2024 Census median value ($455,500) and the state’s FHFA price index (+5.3% since 2024). Among people already in their homes in 2024, owners with a mortgage paid a median $2,008 a month in total costs, and renters paid $1,709 including utilities. Since 2019, median rent rose 46% and owner costs rose 26%. 60% of homes are owner-occupied.
New Hampshire
In New Hampshire, a buyer of a typical home today would pay about $3,807 a month (mortgage, property tax and insurance), compared with an estimated $1,504 in typical rent. That’s 2.53 times as much (rank 8 of 51, where 1 is the biggest gap). The modeled price is $505,251, based on the 2024 Census median value ($458,800) and the state’s FHFA price index (+10.1% since 2024). Among people already in their homes in 2024, owners with a mortgage paid a median $2,399 a month in total costs, and renters paid $1,558 including utilities. Since 2019, median rent rose 36% and owner costs rose 22%. 73% of homes are owner-occupied.
New Jersey
In New Jersey, a buyer of a typical home today would pay about $4,363 a month (mortgage, property tax and insurance), compared with an estimated $1,770 in typical rent. That’s 2.46 times as much (rank 11 of 51, where 1 is the biggest gap). The modeled price is $557,605, based on the 2024 Census median value ($496,000) and the state’s FHFA price index (+12.4% since 2024). Among people already in their homes in 2024, owners with a mortgage paid a median $2,797 a month in total costs, and renters paid $1,800 including utilities. Since 2019, median rent rose 31% and owner costs rose 16%. 64% of homes are owner-occupied.
New Mexico
In New Mexico, a buyer of a typical home today would pay about $2,110 a month (mortgage, property tax and insurance), compared with an estimated $1,022 in typical rent. That’s 2.06 times as much (rank 30 of 51, where 1 is the biggest gap). The modeled price is $298,791, based on the 2024 Census median value ($279,900) and the state’s FHFA price index (+6.7% since 2024). Among people already in their homes in 2024, owners with a mortgage paid a median $1,628 a month in total costs, and renters paid $1,117 including utilities. Since 2019, median rent rose 32% and owner costs rose 28%. 71% of homes are owner-occupied.
New York
In New York, a buyer of a typical home today would pay about $3,799 a month (mortgage, property tax and insurance), compared with an estimated $1,589 in typical rent. That’s 2.39 times as much (rank 16 of 51, where 1 is the biggest gap). The modeled price is $506,102, based on the 2024 Census median value ($449,800) and the state’s FHFA price index (+12.5% since 2024). Among people already in their homes in 2024, owners with a mortgage paid a median $2,544 a month in total costs, and renters paid $1,634 including utilities. Since 2019, median rent rose 25% and owner costs rose 18%. 54% of homes are owner-occupied.
North Carolina
In North Carolina, a buyer of a typical home today would pay about $2,477 a month (mortgage, property tax and insurance), compared with an estimated $1,237 in typical rent. That’s 2.00 times as much (rank 35 of 51, where 1 is the biggest gap). The modeled price is $352,746, based on the 2024 Census median value ($333,000) and the state’s FHFA price index (+5.9% since 2024). Among people already in their homes in 2024, owners with a mortgage paid a median $1,747 a month in total costs, and renters paid $1,338 including utilities. Since 2019, median rent rose 44% and owner costs rose 33%. 67% of homes are owner-occupied.
North Dakota
In North Dakota, a buyer of a typical home today would pay about $2,165 a month (mortgage, property tax and insurance), compared with an estimated $956 in typical rent. That’s 2.27 times as much (rank 20 of 51, where 1 is the biggest gap). The modeled price is $293,324, based on the 2024 Census median value ($266,100) and the state’s FHFA price index (+10.2% since 2024). Among people already in their homes in 2024, owners with a mortgage paid a median $1,814 a month in total costs, and renters paid $980 including utilities. Since 2019, median rent rose 22% and owner costs rose 27%. 61% of homes are owner-occupied.
Ohio
In Ohio, a buyer of a typical home today would pay about $1,993 a month (mortgage, property tax and insurance), compared with an estimated $950 in typical rent. That’s 2.10 times as much (rank 29 of 51, where 1 is the biggest gap). The modeled price is $264,513, based on the 2024 Census median value ($239,800) and the state’s FHFA price index (+10.3% since 2024). Among people already in their homes in 2024, owners with a mortgage paid a median $1,563 a month in total costs, and renters paid $1,090 including utilities. Since 2019, median rent rose 34% and owner costs rose 25%. 68% of homes are owner-occupied.
Oklahoma
In Oklahoma, a buyer of a typical home today would pay about $1,796 a month (mortgage, property tax and insurance), compared with an estimated $900 in typical rent. That’s 2.00 times as much (rank 37 of 51, where 1 is the biggest gap). The modeled price is $236,414, based on the 2024 Census median value ($222,100) and the state’s FHFA price index (+6.4% since 2024). Among people already in their homes in 2024, owners with a mortgage paid a median $1,606 a month in total costs, and renters paid $1,044 including utilities. Since 2019, median rent rose 28% and owner costs rose 30%. 66% of homes are owner-occupied.
Oregon
In Oregon, a buyer of a typical home today would pay about $3,643 a month (mortgage, property tax and insurance), compared with an estimated $1,522 in typical rent. That’s 2.39 times as much (rank 15 of 51, where 1 is the biggest gap). The modeled price is $517,825, based on the 2024 Census median value ($497,500) and the state’s FHFA price index (+4.1% since 2024). Among people already in their homes in 2024, owners with a mortgage paid a median $2,234 a month in total costs, and renters paid $1,597 including utilities. Since 2019, median rent rose 35% and owner costs rose 28%. 63% of homes are owner-occupied.
Pennsylvania
In Pennsylvania, a buyer of a typical home today would pay about $2,264 a month (mortgage, property tax and insurance), compared with an estimated $1,134 in typical rent. That’s 2.00 times as much (rank 36 of 51, where 1 is the biggest gap). The modeled price is $306,927, based on the 2024 Census median value ($277,600) and the state’s FHFA price index (+10.6% since 2024). Among people already in their homes in 2024, owners with a mortgage paid a median $1,775 a month in total costs, and renters paid $1,252 including utilities. Since 2019, median rent rose 32% and owner costs rose 20%. 69% of homes are owner-occupied.
Rhode Island
In Rhode Island, a buyer of a typical home today would pay about $3,723 a month (mortgage, property tax and insurance), compared with an estimated $1,294 in typical rent. That’s 2.88 times as much (rank 2 of 51, where 1 is the biggest gap). The modeled price is $508,003, based on the 2024 Census median value ($455,700) and the state’s FHFA price index (+11.5% since 2024). Among people already in their homes in 2024, owners with a mortgage paid a median $2,262 a month in total costs, and renters paid $1,418 including utilities. Since 2019, median rent rose 36% and owner costs rose 23%. 63% of homes are owner-occupied.
South Carolina
In South Carolina, a buyer of a typical home today would pay about $2,243 a month (mortgage, property tax and insurance), compared with an estimated $1,163 in typical rent. That’s 1.93 times as much (rank 43 of 51, where 1 is the biggest gap). The modeled price is $324,749, based on the 2024 Census median value ($299,500) and the state’s FHFA price index (+8.4% since 2024). Among people already in their homes in 2024, owners with a mortgage paid a median $1,627 a month in total costs, and renters paid $1,272 including utilities. Since 2019, median rent rose 38% and owner costs rose 30%. 72% of homes are owner-occupied.
South Dakota
In South Dakota, a buyer of a typical home today would pay about $2,302 a month (mortgage, property tax and insurance), compared with an estimated $929 in typical rent. That’s 2.48 times as much (rank 10 of 51, where 1 is the biggest gap). The modeled price is $307,291, based on the 2024 Census median value ($289,600) and the state’s FHFA price index (+6.1% since 2024). Among people already in their homes in 2024, owners with a mortgage paid a median $1,739 a month in total costs, and renters paid $999 including utilities. Since 2019, median rent rose 30% and owner costs rose 27%. 68% of homes are owner-occupied.
Tennessee
In Tennessee, a buyer of a typical home today would pay about $2,439 a month (mortgage, property tax and insurance), compared with an estimated $1,158 in typical rent. That’s 2.11 times as much (rank 28 of 51, where 1 is the biggest gap). The modeled price is $352,714, based on the 2024 Census median value ($332,600) and the state’s FHFA price index (+6.0% since 2024). Among people already in their homes in 2024, owners with a mortgage paid a median $1,637 a month in total costs, and renters paid $1,284 including utilities. Since 2019, median rent rose 42% and owner costs rose 30%. 67% of homes are owner-occupied.
Texas
In Texas, a buyer of a typical home today would pay about $2,540 a month (mortgage, property tax and insurance), compared with an estimated $1,383 in typical rent. That’s 1.84 times as much (rank 49 of 51, where 1 is the biggest gap). The modeled price is $323,281, based on the 2024 Census median value ($313,200) and the state’s FHFA price index (+3.2% since 2024). Among people already in their homes in 2024, owners with a mortgage paid a median $2,211 a month in total costs, and renters paid $1,475 including utilities. Since 2019, median rent rose 35% and owner costs rose 32%. 62% of homes are owner-occupied.
Utah
In Utah, a buyer of a typical home today would pay about $3,908 a month (mortgage, property tax and insurance), compared with an estimated $1,561 in typical rent. That’s 2.50 times as much (rank 9 of 51, where 1 is the biggest gap). The modeled price is $577,035, based on the 2024 Census median value ($545,200) and the state’s FHFA price index (+5.8% since 2024). Among people already in their homes in 2024, owners with a mortgage paid a median $2,143 a month in total costs, and renters paid $1,593 including utilities. Since 2019, median rent rose 45% and owner costs rose 34%. 70% of homes are owner-occupied.
Vermont
In Vermont, a buyer of a typical home today would pay about $2,893 a month (mortgage, property tax and insurance), compared with an estimated $1,252 in typical rent. That’s 2.31 times as much (rank 19 of 51, where 1 is the biggest gap). The modeled price is $383,612, based on the 2024 Census median value ($352,800) and the state’s FHFA price index (+8.7% since 2024). Among people already in their homes in 2024, owners with a mortgage paid a median $1,893 a month in total costs, and renters paid $1,319 including utilities. Since 2019, median rent rose 35% and owner costs rose 18%. 73% of homes are owner-occupied.
Virginia
In Virginia, a buyer of a typical home today would pay about $3,071 a month (mortgage, property tax and insurance), compared with an estimated $1,568 in typical rent. That’s 1.96 times as much (rank 42 of 51, where 1 is the biggest gap). The modeled price is $438,322, based on the 2024 Census median value ($403,500) and the state’s FHFA price index (+8.6% since 2024). Among people already in their homes in 2024, owners with a mortgage paid a median $2,149 a month in total costs, and renters paid $1,646 including utilities. Since 2019, median rent rose 31% and owner costs rose 20%. 67% of homes are owner-occupied.
Washington
In Washington, a buyer of a typical home today would pay about $4,409 a month (mortgage, property tax and insurance), compared with an estimated $1,809 in typical rent. That’s 2.44 times as much (rank 14 of 51, where 1 is the biggest gap). The modeled price is $628,292, based on the 2024 Census median value ($602,200) and the state’s FHFA price index (+4.3% since 2024). Among people already in their homes in 2024, owners with a mortgage paid a median $2,519 a month in total costs, and renters paid $1,824 including utilities. Since 2019, median rent rose 34% and owner costs rose 29%. 63% of homes are owner-occupied.
West Virginia
In West Virginia, a buyer of a typical home today would pay about $1,348 a month (mortgage, property tax and insurance), compared with an estimated $715 in typical rent. That’s 1.89 times as much (rank 46 of 51, where 1 is the biggest gap). The modeled price is $191,189, based on the 2024 Census median value ($170,800) and the state’s FHFA price index (+11.9% since 2024). Among people already in their homes in 2024, owners with a mortgage paid a median $1,272 a month in total costs, and renters paid $883 including utilities. Since 2019, median rent rose 21% and owner costs rose 21%. 76% of homes are owner-occupied.
Wisconsin
In Wisconsin, a buyer of a typical home today would pay about $2,457 a month (mortgage, property tax and insurance), compared with an estimated $1,058 in typical rent. That’s 2.32 times as much (rank 18 of 51, where 1 is the biggest gap). The modeled price is $330,304, based on the 2024 Census median value ($294,700) and the state’s FHFA price index (+12.1% since 2024). Among people already in their homes in 2024, owners with a mortgage paid a median $1,701 a month in total costs, and renters paid $1,142 including utilities. Since 2019, median rent rose 32% and owner costs rose 20%. 68% of homes are owner-occupied.
Wyoming
In Wyoming, a buyer of a typical home today would pay about $2,604 a month (mortgage, property tax and insurance), compared with an estimated $930 in typical rent. That’s 2.80 times as much (rank 4 of 51, where 1 is the biggest gap). The modeled price is $370,415, based on the 2024 Census median value ($339,500) and the state’s FHFA price index (+9.1% since 2024). Among people already in their homes in 2024, owners with a mortgage paid a median $1,815 a month in total costs, and renters paid $998 including utilities. Since 2019, median rent rose 21% and owner costs rose 28%. 72% of homes are owner-occupied.
Own a rental, or thinking of buying one?
When buying costs much more than renting, more people rent, and that’s the market landlords serve. Many small landlords hold each rental in an LLC to keep it separate from their personal assets. Rules and costs differ by state, and an LLC doesn’t replace good insurance or a solid lease. See also property taxes by state and home insurance cost by state.
Forming an LLC for a rental property?
Start your LLC with ZenBusiness. They handle the state filing and the registered agent for you.
We may earn a commission if you use this link. It doesn’t change what you pay, and it doesn’t affect the data on this page.
Methods and limits
- Buy (modeled): the Census ACS 2024 1-year median home value (B25077, the owner’s estimate) times the change in the state’s FHFA all-transactions house price index from its 2024 average to Q2 2026 (the latest quarter). We assume 10% down and a 30-year fixed loan at the Freddie Mac PMMS weekly average (7.40%, 2026-10-08). Then we add the 2024 median real estate tax (B25103, not adjusted) and the 2024 median home insurance premium from our home insurance cost by state page (Census PUMS). Mortgage insurance (PMI), HOA fees, maintenance and closing costs are left out, so the real monthly cost of buying is usually higher.
- Rent (estimated): the ACS 2024 median contract rent (B25058, rent without utilities) raised by the national BLS CPI rent of primary residence index (CUUR0000SEHA), from its 2024 average to August 2026 (+6.9%). We used the same national rent growth for every state, because the CPI doesn’t publish rent indexes by state. We used rent without utilities so it lines up with a buy cost that also leaves utilities out.
- Actual costs: median selected monthly owner costs for homes with a mortgage (B25088_002, which includes mortgage, taxes, insurance, utilities, fuel and fees) and median gross rent (B25064, rent plus utilities), from ACS 2024 and 2019. The 2025 ACS release has been delayed.
- Medians: a typical home’s value, tax, insurance and rent are each medians of different groups of homes, so the buy cost is an estimate for a typical home, not any one real listing. Figures are in current dollars.
Sources
- U.S. Census Bureau, American Community Survey 2024 and 2019 1-year (Census API)
- FHFA House Price Index, state and U.S. all-transactions (via FRED)
- Freddie Mac Primary Mortgage Market Survey (MORTGAGE30US, via FRED)
- BLS Consumer Price Index, rent of primary residence (via FRED)
Cite this data
Reporters and bloggers may use these numbers and charts. Please credit StartBusinessByState and link to this page.
Source: StartBusinessByState, “Rent vs. Own: What It Costs Each Month, by State,” https://startbusinessbystate.com/rent-vs-own-cost-by-state/ (updated October 8, 2026).
FAQ
Is it cheaper to rent or buy a house?
Measured by monthly cash, renting is cheaper in every state right now. At a 7.40% mortgage rate with 10% down, buying a typical U.S. home costs about $2,794 a month for the mortgage, tax and insurance, compared with about $1,397 in typical rent. Part of a mortgage payment is principal, which builds equity.
Which state has the biggest gap between renting and owning?
Hawaii, where buying a typical home costs about 3.2 times typical rent, followed by Rhode Island and Montana.
Where is buying closest to renting?
Florida (1.67x), Mississippi (1.81x) and Texas (1.84x).
What do homeowners with a mortgage actually pay?
In 2024, the median owner with a mortgage paid $2,035 a month in total housing costs, including utilities, and the median renter paid $1,487 (Census ACS). Most current owners have lower rates than buyers get today.
How often is this updated?
The mortgage rate changes weekly and the home price index quarterly. We refresh the page when the Census, FHFA or Freddie Mac data update.
Last updated October 8, 2026 by StartBusinessByState.