By StartBusinessByStatePublisher: Robert SmithResearch process
Data year 2025 · U.S. Bureau of Labor Statistics Survey of Occupational Injuries and Illnesses, released November 18, 2026 · By StartBusinessByState · Published November 18, 2026
Short answer: in 2025, Maine had the highest private industry injury and illness rate of the 42 states and DC with their own estimates, at 3.7 cases per 100 full-time workers, and District of Columbia had the lowest, at 1.2. The rate rose from 2024 in 9 states and fell in 23. These state numbers are for 2025, not 2026.
What the 2025 numbers show nationally
Private employers reported 2.4 million nonfatal workplace injuries and illnesses in 2025, down 3.0% from 2024. BLS says it is the third drop in a row and the lowest count in this data series, which goes back to 2003. The rate was 2.3 cases per 100 full-time workers, the same as 2024 when rounded.
- Illnesses fell sharply. Illness cases dropped 26.1% to 109,400, led by a 67.6% drop in respiratory illness cases. Injuries fell 1.5% to 2.3 million.
- Time off work. 842,500 cases involved days away from work (0.8 per 100 workers) and 558,300 involved a job transfer or restricted duty (0.5 per 100).
- Health care and social assistance fell to 3.2 per 100 workers from 3.4, with 535,500 cases. Retail cases fell 5.9% and manufacturing cases fell 8.5%.
- Increases: educational services cases rose 13.5% to 42,000, and real estate and rental and leasing rose to 2.0 per 100 workers from 1.6. Couriers and messengers had 11.4% more cases.
National 2025 rates for some common small business types: construction 2.0, plumbing and HVAC contractors 2.9, electrical contractors 1.6, landscaping 2.4, janitorial services 2.1, retail 2.8, restaurants and bars 2.4, child care 1.8 and pet care 5.6. BLS notes that the 2025 survey switched to the 2022 industry codes, with major revisions in retail trade and information, so compare those two sectors with 2024 carefully.
Workplace injury rates by state, 2025
Rates are recordable cases per 100 full-time workers in private industry. DART means cases with days away from work, a job transfer or restricted duty. Days away is the part of DART where the worker missed at least one day. Industry columns are for that state. A blank cell means BLS did not publish that number.
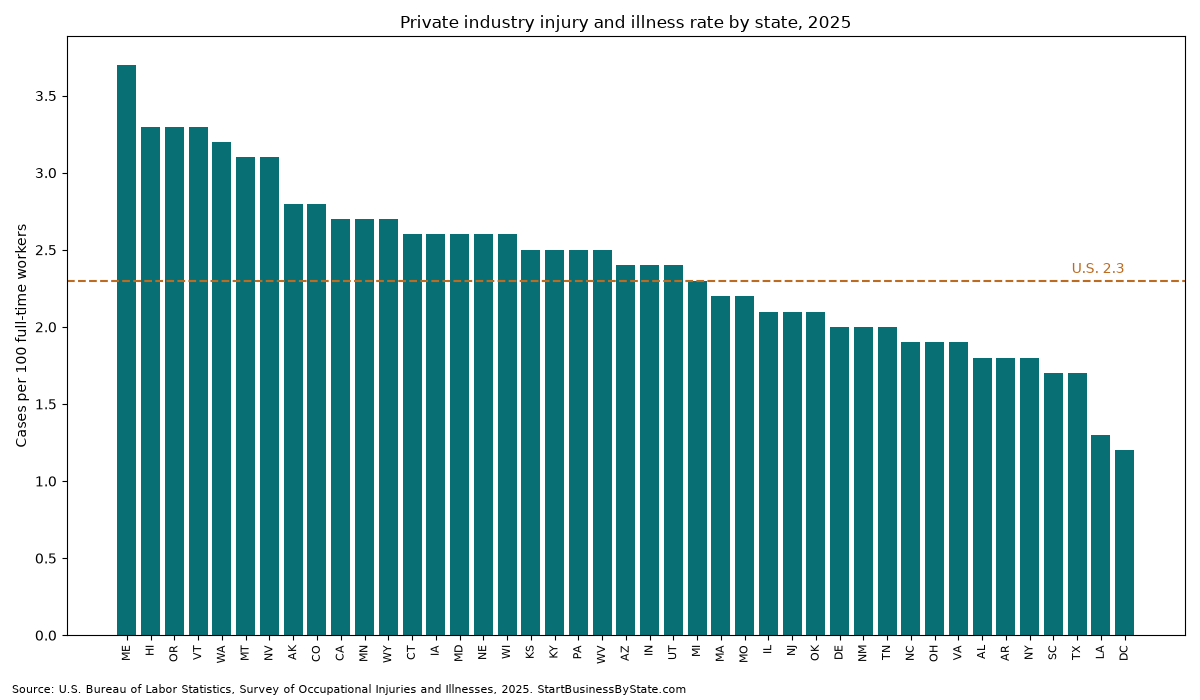
| State | Total rate 2025 | DART 2025 | Days away 2025 | Total rate 2024 | Change | Construction | Retail | Restaurants and hotels | Health care |
|---|---|---|---|---|---|---|---|---|---|
| Maine | 3.7 | 2.4 | 1.1 | 4.1 | -0.4 | 4.0 | 4.7 | 2.7 | 5.2 |
| Hawaii | 3.3 | 2.0 | 1.7 | 2.9 | +0.4 | 2.9 | 3.4 | 3.8 | 3.4 |
| Oregon | 3.3 | 2.0 | 1.3 | 3.3 | +0.0 | 3.1 | 3.9 | 3.3 | 4.6 |
| Vermont | 3.3 | 1.7 | 1.1 | 3.6 | -0.3 | 3.9 | 3.5 | 4.3 | 4.7 |
| Washington | 3.2 | 2.0 | 1.3 | 3.2 | +0.0 | 3.8 | 4.2 | 4.9 | 4.2 |
| Montana | 3.1 | 1.6 | 1.1 | 3.3 | -0.2 | 4.1 | 3.9 | 3.4 | 3.7 |
| Nevada | 3.1 | 1.9 | 0.9 | 3.0 | +0.1 | 2.9 | 3.4 | 3.9 | 3.3 |
| Alaska | 2.8 | 1.6 | 1.2 | 2.8 | +0.0 | 2.6 | 3.3 | 2.1 | 3.7 |
| Colorado | 2.8 | 1.5 | 0.8 | 2.7 | +0.1 | 3.0 | 3.8 | 3.0 | 3.8 |
| California | 2.7 | 1.7 | 1.0 | 2.9 | -0.2 | 2.2 | 3.3 | 3.8 | 4.0 |
| Minnesota | 2.7 | 1.4 | 0.9 | 2.8 | -0.1 | 4.0 | 3.9 | 2.9 | 3.9 |
| Wyoming | 2.7 | 1.3 | 1.0 | 2.5 | +0.2 | 2.5 | 3.1 | 3.5 | 4.1 |
| Connecticut | 2.6 | 1.6 | 1.0 | 2.9 | -0.3 | 2.5 | 3.4 | 2.4 | 4.3 |
| Iowa | 2.6 | 1.5 | 0.8 | 2.6 | +0.0 | 2.7 | 3.4 | 2.5 | 4.1 |
| Maryland | 2.6 | 1.5 | 1.1 | 2.2 | +0.4 | 1.9 | 3.1 | 2.3 | 3.6 |
| Nebraska | 2.6 | 1.4 | 0.9 | 2.5 | +0.1 | 2.2 | 3.1 | 2.2 | 3.2 |
| Wisconsin | 2.6 | 1.4 | 0.8 | 2.9 | -0.3 | 2.7 | 3.1 | 2.2 | 3.2 |
| Kansas | 2.5 | 1.4 | 0.7 | 2.5 | +0.0 | 2.8 | 3.1 | 2.3 | 3.6 |
| Kentucky | 2.5 | 1.3 | 0.8 | 2.4 | +0.1 | 1.3 | 2.6 | 2.1 | 3.1 |
| Pennsylvania | 2.5 | 1.4 | 0.8 | 2.7 | -0.2 | 2.8 | 3.0 | 2.3 | 3.1 |
| West Virginia | 2.5 | 1.3 | 1.1 | 2.7 | -0.2 | 1.8 | 2.6 | 2.4 | 4.0 |
| Arizona | 2.4 | 1.4 | 0.6 | 2.6 | -0.2 | 1.7 | 3.2 | 2.8 | 2.9 |
| Indiana | 2.4 | 1.3 | 0.6 | 2.5 | -0.1 | 1.6 | 2.1 | 1.8 | 3.8 |
| Utah | 2.4 | 1.1 | 0.5 | 2.4 | +0.0 | 3.1 | 2.9 | 2.9 | 3.7 |
| Michigan | 2.3 | 1.3 | 0.7 | 2.5 | -0.2 | 1.7 | 2.9 | 2.3 | 3.6 |
| Massachusetts | 2.2 | 1.3 | 1.0 | 2.1 | +0.1 | 2.5 | 3.5 | 2.3 | 3.4 |
| Missouri | 2.2 | 1.2 | 0.6 | 2.4 | -0.2 | 2.6 | 2.9 | 2.0 | 3.1 |
| Illinois | 2.1 | 1.4 | 0.9 | 2.2 | -0.1 | 2.0 | 2.7 | 2.8 | 3.0 |
| New Jersey | 2.1 | 1.3 | 0.9 | 2.2 | -0.1 | 1.7 | 2.8 | 1.8 | 3.7 |
| Oklahoma | 2.1 | 1.2 | 0.7 | 2.3 | -0.2 | 1.4 | 2.8 | 1.8 | 3.0 |
| Delaware | 2.0 | 1.2 | 0.8 | 2.2 | -0.2 | 2.0 | 3.1 | 1.8 | 2.8 |
| New Mexico | 2.0 | 1.0 | 0.6 | 2.4 | -0.4 | 1.7 | 2.6 | 2.7 | 2.4 |
| Tennessee | 2.0 | 1.1 | 0.6 | 2.2 | -0.2 | 1.4 | 2.6 | 2.0 | 3.5 |
| North Carolina | 1.9 | 1.0 | 0.6 | 1.9 | +0.0 | 1.6 | 2.4 | 1.9 | 3.3 |
| Ohio | 1.9 | 1.1 | 0.7 | 2.0 | -0.1 | 1.4 | 2.1 | 1.6 | 2.8 |
| Virginia | 1.9 | 1.1 | 0.7 | 1.8 | +0.1 | 1.3 | 2.8 | 2.3 | 3.1 |
| Alabama | 1.8 | 1.0 | 0.7 | 1.9 | -0.1 | 1.3 | 2.2 | 1.9 | 2.4 |
| Arkansas | 1.8 | 0.9 | 0.5 | 1.8 | +0.0 | 1.3 | 2.1 | 1.5 | 2.8 |
| New York | 1.8 | 1.0 | 0.9 | 1.9 | -0.1 | 1.4 | 2.6 | 2.3 | 2.6 |
| South Carolina | 1.7 | 1.0 | 0.6 | 1.7 | +0.0 | 0.8 | 2.5 | 1.9 | 2.5 |
| Texas | 1.7 | 1.1 | 0.5 | 1.7 | +0.0 | 1.1 | 2.7 | 2.1 | 2.4 |
| Louisiana | 1.3 | 0.7 | 0.5 | 1.4 | -0.1 | 0.9 | 1.9 | 1.4 | 1.6 |
| District of Columbia | 1.2 | 0.6 | 0.6 | 1.2 | +0.0 | 1.4 | 2.0 | 2.3 | 3.1 |
Download 2025 and 2024 state rates by sector (CSV)
No state estimates: Florida, Georgia, Idaho, Mississippi, New Hampshire, North Dakota, Rhode Island, South Dakota. For rates by type of business nationwide, see workplace injury rates by industry. For deaths on the job, see fatal injury rates by trade.
How to read these rates
A rate lets you compare places with different numbers of workers. A rate of 3.0 means 3 cases per 100 full-time workers in a year. Small changes, like 0.1, can be within the survey’s margin of error, so treat them as about the same. The survey covers employees; self-employed owners with no staff are not counted.
The industry mix matters. Nursing homes, warehouses, farms and factories have higher rates than offices. A state full of those businesses will rank higher even if each workplace is just as safe as elsewhere.
What small business owners can do with this
Example: a roofing company in a state with a construction rate of 2.0 has 12 workers who worked 24,000 hours. One recordable injury gives a rate of 1 x 200,000 / 24,000 = 8.3, four times the state construction rate, from a single case. That is why small firms should look at their cases over several years.
- Keep the OSHA log if you must. Most employers with more than 10 workers must keep OSHA injury records unless their industry is exempt. See OSHA recordkeeping.
- Compare your industry, not just your state. Use the construction, retail, restaurant and health care columns or the national industry rates.
- Plan for time off. Our injury recovery time page shows how many days workers typically miss.
- Check workers’ comp rules. Most states require coverage once you hire; see workers' comp requirements by state.
Hiring your first workers?
Form your LLC with ZenBusiness. Compare workers’ comp and business insurance quotes from Simply Business.
We may earn a commission if you use these links. It doesn’t change what you pay, and it doesn’t affect the information on this page.
How we did this
State rates come from BLS Table 1 for each participating state, 2025 and 2024 editions, private industry rows and the sector rows for construction (NAICS 23), retail trade (44 to 45), accommodation and food services (72) and health care and social assistance (62). National figures come from the BLS news release published November 18, 2026. All figures are employer reported, nonfatal and recordable under OSHA rules. Sources: BLS news release, Employer Reported Workplace Injuries and Illnesses; BLS state injury data.
Common questions
Which state had the highest workplace injury rate in 2025?
Maine had the highest private industry rate among the 42 states and DC with their own estimates, at 3.7 recordable injuries and illnesses per 100 full-time workers in 2025. District of Columbia was lowest at 1.2. The U.S. private industry rate was 2.3.
What was the national workplace injury rate in 2025?
In 2025, private employers reported 2.4 million nonfatal injuries and illnesses, a rate of 2.3 cases per 100 full-time workers, according to BLS data released November 18, 2026. Cases fell 3.0% from 2024 to the lowest count since 2003. These are 2025 numbers. BLS usually publishes each year in November of the following year.
Why are some states missing?
BLS publishes state estimates only for states that take part in the survey with their own state program. Florida, Georgia, Idaho, Mississippi, New Hampshire, North Dakota, Rhode Island and South Dakota do not have 2025 state estimates. Employers in those states are still counted in the national numbers.
What does a rate of 2.5 mean?
It means 2.5 recordable injury or illness cases for every 100 full-time workers over the year. BLS calculates it as cases times 200,000 divided by hours worked. 200,000 hours is 100 people working 40 hours a week for 50 weeks. It is not the share of workers who got hurt, because one worker can have more than one case.
Does a high state rate mean that state is more dangerous?
Not by itself. States have different mixes of industries, and states also differ in how employers report. A state with lots of warehouses, farms or hospitals tends to have higher rates. Compare your own industry row where you can, and use the rates as a starting point, not a verdict.
How do I calculate my own business injury rate?
Count your OSHA recordable cases for the year, multiply by 200,000, and divide by the total hours all employees actually worked. Example: 2 cases and 60,000 hours gives 2 x 200,000 / 60,000 = 6.7. With small payrolls, one case moves the rate a lot.
Published November 18, 2026, with 2025 national data released that day.