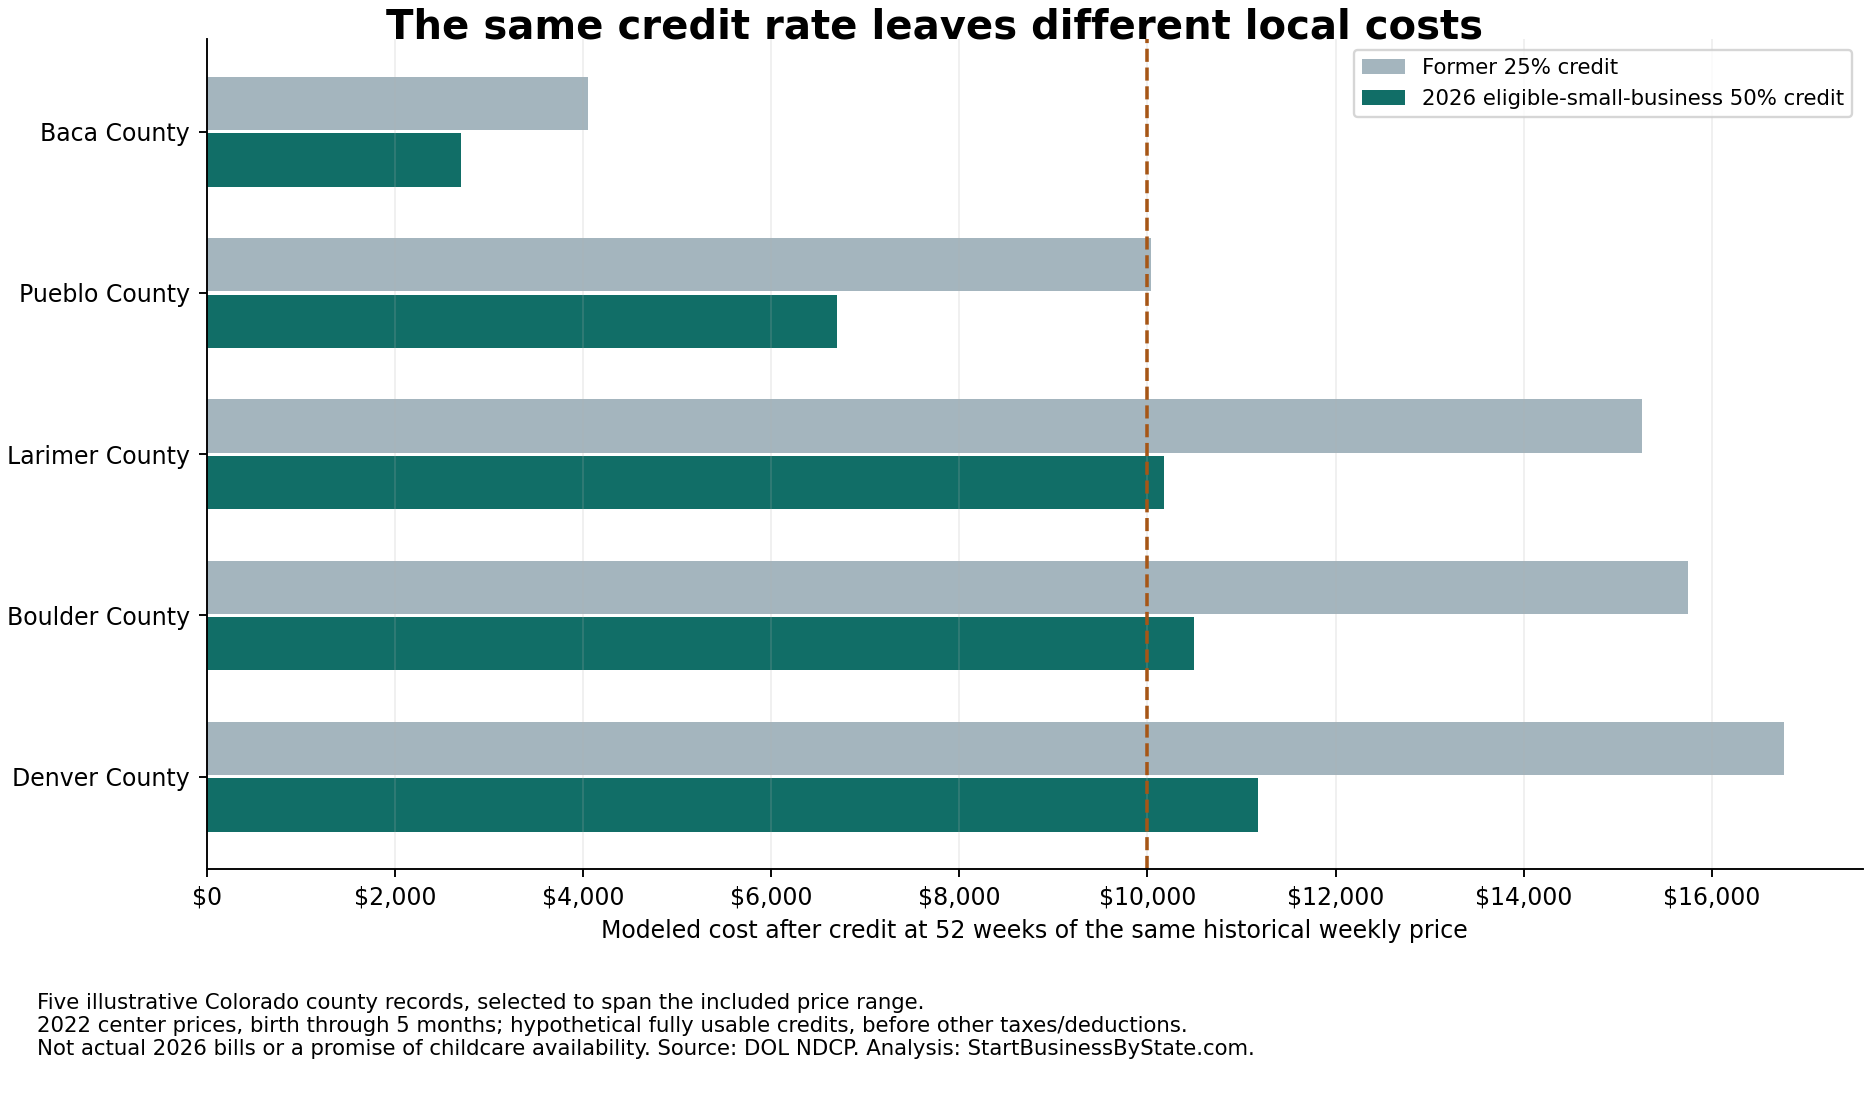
A larger employer childcare credit does not make local care prices equal. Among 62 usable Colorado county records, the highest 2022 center-care benchmark for infants birth through 5 months was 4.14 times the lowest. Applied to those historical prices, a hypothetical fully usable 50% credit leaves an annualized employer cost of $2,700.10 in Baca County versus $11,178.70 in Denver County.
The federal Section 45F expansion is in effect for 2026. On September 11, the U.S. Chamber requested implementation guidance; its letter was published September 15, 2026. Employer childcare arrangements also drew September 10 independent coverage in Indiana, concerning a separate state incentive. Our analysis asks a different question: what does a fixed employer budget represent in different local price markets?
Published September 18, 2026 · Prices: 2022 DOL NDCP records · Tax scenarios: former 25%, general 2026 40%, eligible-small-business 2026 50% · Included geography: 734 county records in 12 states and DC.
Three findings reporters can use
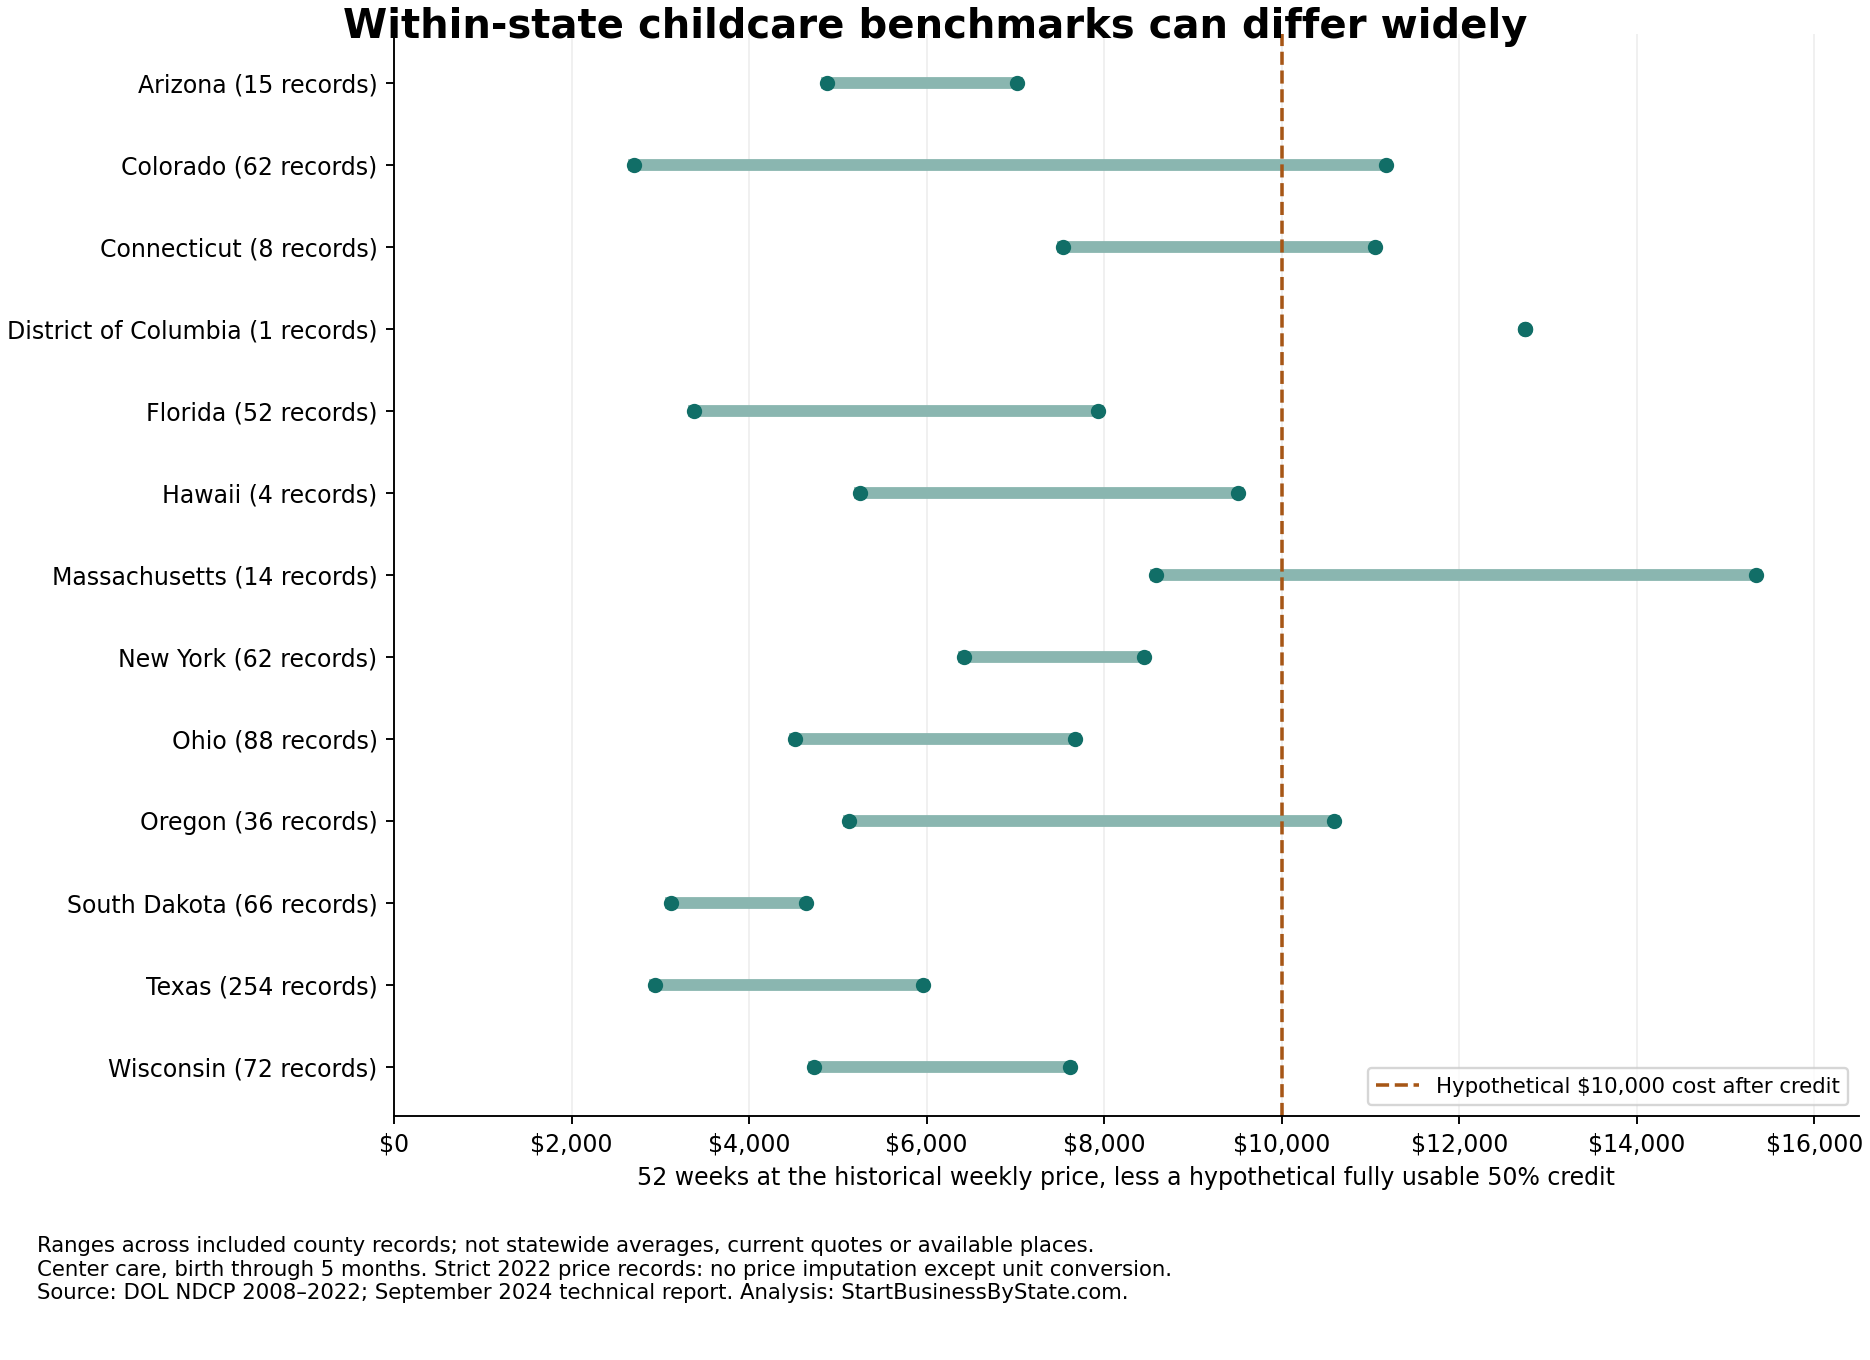
- Local differences can be substantial within the same state. Colorado’s included benchmarks range from $103.85 to $429.95 per week. Applying the same credit percentage preserves that 4.14-to-one ratio; the incentive changes the modeled remaining cost, not the underlying geographic gap.
- A $10,000 budget after the credit reaches more historical benchmarks under the expanded small-business rate. In the included sample, 718 of 734 annualized benchmarks fall at or below $10,000 after an assumed fully usable 50% credit, versus 599 under the former 25% rate. These are county-record counts, not numbers of children served, employers receiving credits or representative national percentages.
- Statewide summaries can hide local planning differences. In Colorado, the same scenario covers 54 of 62 included benchmarks at 50%, versus 32 at 25%. Denver’s modeled cost still exceeds $10,000. A qualifying contract and an available place remain separate questions.
What changed in the federal credit
IRS guidance for 2026 and later sets qualified-care rates at 40% generally and 50% for eligible small businesses, with annual caps of $500,000 and $600,000. Resource/referral spending has a separate 10% rate and is excluded here. The former rate was 25%, capped at $150,000.
Eligibility includes qualifying facilities/contracts and employee access without prohibited discrimination. For 2026, eligible-small-business status generally uses a $32 million gross-receipts threshold averaged over five preceding years. The credit portion cannot also receive a deduction or another credit. This study models price comparisons, not an employer’s eligibility or full tax return.
The credit is part of the general business credit; that linked 2025 notice describes its tax treatment, not the current rate. Credit limits and timing matter. A $10,000 budget after a fully usable 50% credit corresponds to $20,000 of gross qualified spending in this model; it does not mean $10,000 of available cash can immediately pay $20,000 of bills.
Within-state ranges: 12 states and DC
Each range uses only included county records, not a statewide average. Prices may represent a county or its assigned rate zone/cluster. Coverage differs, and the source does not provide a provider sample size or uncertainty interval for every displayed estimate. This is not a best-state ranking. DC has one county-equivalent record and no within-jurisdiction range.
| State / DC | Included / workbook records | Lowest included benchmark* | Highest included benchmark* | High / low | At or below $10k after 25% | At or below $10k after 50% |
|---|---|---|---|---|---|---|
| Arizona | 15/15 | La Paz County $4,875.00 | Maricopa County $7,020.00 | 1.44× | 14 | 15 |
| Colorado | 62/64 | Baca County $2,700.10 | Denver County $11,178.70 | 4.14× | 32 | 54 |
| Connecticut | 8/8 | New London County $7,540.00 | Fairfield County $11,050.00 | 1.47× | 0 | 7 |
| District of Columbia | 1/1 | District of Columbia $12,740.00 | District of Columbia $12,740.00 | One record | 0 | 0 |
| Florida | 52/67 | Suwannee County $3,380.00 | Palm Beach County $7,930.00 | 2.35× | 49 | 52 |
| Hawaii | 4/5 | Hawaii County $5,249.92 | Honolulu County $9,510.02 | 1.81× | 1 | 4 |
| Massachusetts | 14/14 | Berkshire County $8,580.00 | Suffolk County $15,340.00 | 1.79× | 0 | 9 |
| New York | 62/62 | Allegany County $6,422.00 | Nassau County $8,450.00 | 1.32× | 38 | 62 |
| Ohio | 88/88 | Adams County $4,512.30 | Athens County $7,670.00 | 1.70× | 59 | 88 |
| Oregon | 36/36 | Baker County $5,130.06 | Multnomah County $10,584.08 | 2.06× | 24 | 35 |
| South Dakota | 66/66 | Aurora County $3,120.00 | Lincoln County $4,638.40 | 1.49× | 66 | 66 |
| Texas | 254/254 | Coke County $2,938.00 | Travis County $5,954.00 | 2.03× | 254 | 254 |
| Wisconsin | 72/72 | Adams County $4,732.00 | Brown County $7,618.00 | 1.61× | 62 | 72 |
*52 × 2022 weekly price × 50%. Bounds describe included records only. State links open matching daycare startup guides. “Included / workbook” measures record coverage, not population or licensed-place coverage.
Find a county benchmark
Select an included state or search a county name. The default view is Colorado. The complete download contains all 734 included records and their source flags. Blank or excluded counties are not filled with a state average.
62 Colorado county records shown. Prices: 2022; birth through 5 months; center care.
| County | State / DC | 2022 weekly price | 52-week gross benchmark | After former 25% | After general 40% | After small-business 50% |
|---|---|---|---|---|---|---|
| Adams County | Colorado | $392.40 | $20,404.80 | $15,303.60 | $12,242.88 | $10,202.40 |
| Alamosa County | Colorado | $171.70 | $8,928.40 | $6,696.30 | $5,357.04 | $4,464.20 |
| Arapahoe County | Colorado | $377.40 | $19,624.80 | $14,718.60 | $11,774.88 | $9,812.40 |
| Archuleta County | Colorado | $223.10 | $11,601.20 | $8,700.90 | $6,960.72 | $5,800.60 |
| Baca County | Colorado | $103.85 | $5,400.20 | $4,050.15 | $3,240.12 | $2,700.10 |
| Bent County | Colorado | $103.85 | $5,400.20 | $4,050.15 | $3,240.12 | $2,700.10 |
| Boulder County | Colorado | $403.85 | $21,000.20 | $15,750.15 | $12,600.12 | $10,500.10 |
| Broomfield County | Colorado | $341.40 | $17,752.80 | $13,314.60 | $10,651.68 | $8,876.40 |
| Chaffee County | Colorado | $283.15 | $14,723.80 | $11,042.85 | $8,834.28 | $7,361.90 |
| Cheyenne County | Colorado | $103.85 | $5,400.20 | $4,050.15 | $3,240.12 | $2,700.10 |
| Clear Creek County | Colorado | $279.00 | $14,508.00 | $10,881.00 | $8,704.80 | $7,254.00 |
| Conejos County | Colorado | $103.85 | $5,400.20 | $4,050.15 | $3,240.12 | $2,700.10 |
| Costilla County | Colorado | $183.10 | $9,521.20 | $7,140.90 | $5,712.72 | $4,760.60 |
| Crowley County | Colorado | $182.40 | $9,484.80 | $7,113.60 | $5,690.88 | $4,742.40 |
| Custer County | Colorado | $223.10 | $11,601.20 | $8,700.90 | $6,960.72 | $5,800.60 |
| Delta County | Colorado | $152.50 | $7,930.00 | $5,947.50 | $4,758.00 | $3,965.00 |
| Denver County | Colorado | $429.95 | $22,357.40 | $16,768.05 | $13,414.44 | $11,178.70 |
| Dolores County | Colorado | $219.30 | $11,403.60 | $8,552.70 | $6,842.16 | $5,701.80 |
| Douglas County | Colorado | $401.20 | $20,862.40 | $15,646.80 | $12,517.44 | $10,431.20 |
| Eagle County | Colorado | $332.60 | $17,295.20 | $12,971.40 | $10,377.12 | $8,647.60 |
| El Paso County | Colorado | $350.45 | $18,223.40 | $13,667.55 | $10,934.04 | $9,111.70 |
| Elbert County | Colorado | $280.60 | $14,591.20 | $10,943.40 | $8,754.72 | $7,295.60 |
| Fremont County | Colorado | $166.05 | $8,634.60 | $6,475.95 | $5,180.76 | $4,317.30 |
| Garfield County | Colorado | $297.35 | $15,462.20 | $11,596.65 | $9,277.32 | $7,731.10 |
| Gilpin County | Colorado | $294.35 | $15,306.20 | $11,479.65 | $9,183.72 | $7,653.10 |
| Grand County | Colorado | $341.85 | $17,776.20 | $13,332.15 | $10,665.72 | $8,888.10 |
| Gunnison County | Colorado | $285.10 | $14,825.20 | $11,118.90 | $8,895.12 | $7,412.60 |
| Huerfano County | Colorado | $285.10 | $14,825.20 | $11,118.90 | $8,895.12 | $7,412.60 |
| Jefferson County | Colorado | $415.20 | $21,590.40 | $16,192.80 | $12,954.24 | $10,795.20 |
| Kiowa County | Colorado | $103.85 | $5,400.20 | $4,050.15 | $3,240.12 | $2,700.10 |
| Kit Carson County | Colorado | $177.70 | $9,240.40 | $6,930.30 | $5,544.24 | $4,620.20 |
| La Plata County | Colorado | $286.00 | $14,872.00 | $11,154.00 | $8,923.20 | $7,436.00 |
| Lake County | Colorado | $231.75 | $12,051.00 | $9,038.25 | $7,230.60 | $6,025.50 |
| Larimer County | Colorado | $391.25 | $20,345.00 | $15,258.75 | $12,207.00 | $10,172.50 |
| Las Animas County | Colorado | $110.70 | $5,756.40 | $4,317.30 | $3,453.84 | $2,878.20 |
| Lincoln County | Colorado | $167.85 | $8,728.20 | $6,546.15 | $5,236.92 | $4,364.10 |
| Logan County | Colorado | $166.05 | $8,634.60 | $6,475.95 | $5,180.76 | $4,317.30 |
| Mesa County | Colorado | $222.60 | $11,575.20 | $8,681.40 | $6,945.12 | $5,787.60 |
| Mineral County | Colorado | $176.45 | $9,175.40 | $6,881.55 | $5,505.24 | $4,587.70 |
| Moffat County | Colorado | $291.40 | $15,152.80 | $11,364.60 | $9,091.68 | $7,576.40 |
| Montezuma County | Colorado | $194.30 | $10,103.60 | $7,577.70 | $6,062.16 | $5,051.80 |
| Montrose County | Colorado | $237.50 | $12,350.00 | $9,262.50 | $7,410.00 | $6,175.00 |
| Morgan County | Colorado | $172.50 | $8,970.00 | $6,727.50 | $5,382.00 | $4,485.00 |
| Otero County | Colorado | $103.85 | $5,400.20 | $4,050.15 | $3,240.12 | $2,700.10 |
| Ouray County | Colorado | $365.30 | $18,995.60 | $14,246.70 | $11,397.36 | $9,497.80 |
| Park County | Colorado | $386.10 | $20,077.20 | $15,057.90 | $12,046.32 | $10,038.60 |
| Phillips County | Colorado | $103.85 | $5,400.20 | $4,050.15 | $3,240.12 | $2,700.10 |
| Pitkin County | Colorado | $272.50 | $14,170.00 | $10,627.50 | $8,502.00 | $7,085.00 |
| Prowers County | Colorado | $103.85 | $5,400.20 | $4,050.15 | $3,240.12 | $2,700.10 |
| Pueblo County | Colorado | $257.50 | $13,390.00 | $10,042.50 | $8,034.00 | $6,695.00 |
| Rio Blanco County | Colorado | $186.00 | $9,672.00 | $7,254.00 | $5,803.20 | $4,836.00 |
| Rio Grande County | Colorado | $178.95 | $9,305.40 | $6,979.05 | $5,583.24 | $4,652.70 |
| Routt County | Colorado | $331.65 | $17,245.80 | $12,934.35 | $10,347.48 | $8,622.90 |
| Saguache County | Colorado | $187.10 | $9,729.20 | $7,296.90 | $5,837.52 | $4,864.60 |
| San Juan County | Colorado | $294.35 | $15,306.20 | $11,479.65 | $9,183.72 | $7,653.10 |
| San Miguel County | Colorado | $403.10 | $20,961.20 | $15,720.90 | $12,576.72 | $10,480.60 |
| Sedgwick County | Colorado | $103.85 | $5,400.20 | $4,050.15 | $3,240.12 | $2,700.10 |
| Summit County | Colorado | $379.70 | $19,744.40 | $14,808.30 | $11,846.64 | $9,872.20 |
| Teller County | Colorado | $282.95 | $14,713.40 | $11,035.05 | $8,828.04 | $7,356.70 |
| Washington County | Colorado | $186.30 | $9,687.60 | $7,265.70 | $5,812.56 | $4,843.80 |
| Weld County | Colorado | $341.15 | $17,739.80 | $13,304.85 | $10,643.88 | $8,869.90 |
| Yuma County | Colorado | $161.65 | $8,405.80 | $6,304.35 | $5,043.48 | $4,202.90 |
A closer look at Colorado
Baca and Denver define the bounds of the included Colorado records. Pueblo, Larimer and Boulder illustrate values between those endpoints. At a fixed gross benchmark, moving from 25% to 50% lowers modeled remaining cost by one-third, before other taxes and deductions. It does not show an observed one-third reduction in actual employer bills.
Compare credits at fixed qualified spending
Enter assumed qualified care spending. The tool compares rates and statutory caps at the same gross amount. “Assumed credit use” is a planning percentage you choose, not an IRS eligibility test or calculation of Form 3800 limits. Unused credit is excluded from the current scenario; possible carrybacks/forwards are not modeled.
| Scenario | Calculated credit before use limits | Assumed credit used | Gross spending less credit used |
|---|---|---|---|
| Former 25%, $150k cap | |||
| 2026 general 40%, $500k cap | |||
| 2026 eligible small business 50%, $600k cap |
Federal credit-only comparison, before deductions, other taxes, state incentives, facility-basis adjustments, recapture or cash-flow timing. Rates/caps shown are for the specified periods. The tool does not establish that spending qualifies or that a taxpayer can use the calculated credit.
What employers and daycare operators can take from this
Employers considering a childcare contract need current provider quotes, qualifying arrangements and tax-use capacity. Daycare operators evaluating an employer partnership need a viable staffing and operating plan. Historical prices help frame a conversation; they cannot show a vacant place, service quality or provider profit.
For practical context, start with our daycare licensing and startup guides, compare broader age-group prices in childcare prices by state, and review daycare wages versus parent prices. The wage study uses different observation years and does not estimate profit. Operators planning a partnership can also review daycare insurance coverage.
Download charts and aggregate data
- County prices and three credit scenarios — CSV, 734 records
- Within-state ranges and budget comparisons — CSV, 13 records
- Included, missing and excluded records — CSV, all 50 states and DC
- Download the county-range chart — PNG
- Download the Colorado scenario chart — PNG
Reporters and publishers may reuse our charts and aggregate analysis with attribution and a link to this study. Suggested citation: “StartBusinessByState.com, Employer Childcare Credit: County Cost Benchmarks, September 18, 2026; analysis of DOL NDCP 2022 price records and hypothetical federal credit scenarios.” Attribute the underlying public data to the U.S. Department of Labor. Source inclusion is not government endorsement.
Methods, definitions and coverage
Source and unit. We downloaded the DOL NDCP 2008–2022 workbook on September 18, 2026 and read its September 2024 technical report. We use STUDYYEAR=2022, COUNTY_FIPS_CODE, STATE_NAME, MCBto5 and iMCBto5. MCBto5 is the median weekly full-time center-care price for birth through 5 months, reported for the county or its rate zone/cluster. The technical report recommends granular age bands; we do not substitute its broader infant aggregation. No ACS or business-count join is used.
Selection. The workbook has 3,143 2022 county-equivalent records in the 50-state/DC universe. We retain a positive numeric MCBto5 with iMCBto5 equal to 00000 or 01000: no flagged imputation, or weekly-unit conversion only. The five positions flag age substitution, unit conversion, county estimation from statewide prices, percentile estimation, and between-study-year estimation. This leaves 734 records: 230 with 00000 and 504 with 01000. The remaining 2,409 are excluded from analysis, not assigned zero costs. Puerto Rico is outside scope.
Price and credit calculations. Annualized gross benchmark = weekly price × 52. Modeled credit = lesser of qualified gross spending × credit rate or the applicable annual cap. Modeled remaining cost = gross spending minus credit assumed used. County benchmarks are below all modeled caps. Budget comparisons use annualized benchmark × (1 − rate) ≤ $10,000 and fully usable credits. Results are calculated before display rounding; currency is rounded to cents.
Interpretation. The 52-week exercise holds one age-band rate constant, rather than pricing a child’s actual first year. County-record shares are unweighted and are not shares of children or childcare places. A county can share a rate-zone price with other counties; its record does not prove providers operating in that county. The strict flag filter removes selected NDCP imputations, but does not make different state survey designs identical or every retained estimate equally precise. Missingness is substantial and nonrandom. No national cost total, causal policy effect, significance test, shortage score or best-state recommendation is calculated.
See coverage for all 50 states and DC
Counts use the county geography in this workbook, including historical county-equivalents. “Excluded for price imputation” includes positive price records that fail the strict flag rule. Missing prices and excluded prices are not evidence of no childcare services.
| State / DC | Workbook records | Included | Missing / nonpositive | Excluded for price imputation |
|---|---|---|---|---|
| Alabama | 67 | 0 | 0 | 67 |
| Alaska | 30 | 0 | 22 | 8 |
| Arizona | 15 | 15 | 0 | 0 |
| Arkansas | 75 | 0 | 75 | 0 |
| California | 58 | 0 | 0 | 58 |
| Colorado | 64 | 62 | 2 | 0 |
| Connecticut | 8 | 8 | 0 | 0 |
| Delaware | 3 | 0 | 0 | 3 |
| District of Columbia | 1 | 1 | 0 | 0 |
| Florida | 67 | 52 | 14 | 1 |
| Georgia | 159 | 0 | 0 | 159 |
| Hawaii | 5 | 4 | 1 | 0 |
| Idaho | 44 | 0 | 0 | 44 |
| Illinois | 102 | 0 | 44 | 58 |
| Indiana | 92 | 0 | 92 | 0 |
| Iowa | 99 | 0 | 0 | 99 |
| Kansas | 105 | 0 | 0 | 105 |
| Kentucky | 120 | 0 | 0 | 120 |
| Louisiana | 64 | 0 | 0 | 64 |
| Maine | 16 | 0 | 0 | 16 |
| Maryland | 24 | 0 | 0 | 24 |
| Massachusetts | 14 | 14 | 0 | 0 |
| Michigan | 83 | 0 | 0 | 83 |
| Minnesota | 87 | 0 | 0 | 87 |
| Mississippi | 82 | 0 | 0 | 82 |
| Missouri | 115 | 0 | 115 | 0 |
| Montana | 56 | 0 | 0 | 56 |
| Nebraska | 93 | 0 | 0 | 93 |
| Nevada | 17 | 0 | 0 | 17 |
| New Hampshire | 10 | 0 | 0 | 10 |
| New Jersey | 21 | 0 | 0 | 21 |
| New Mexico | 33 | 0 | 33 | 0 |
| New York | 62 | 62 | 0 | 0 |
| North Carolina | 100 | 0 | 1 | 99 |
| North Dakota | 53 | 0 | 0 | 53 |
| Ohio | 88 | 88 | 0 | 0 |
| Oklahoma | 77 | 0 | 0 | 77 |
| Oregon | 36 | 36 | 0 | 0 |
| Pennsylvania | 67 | 0 | 67 | 0 |
| Rhode Island | 5 | 0 | 0 | 5 |
| South Carolina | 46 | 0 | 0 | 46 |
| South Dakota | 66 | 66 | 0 | 0 |
| Tennessee | 95 | 0 | 0 | 95 |
| Texas | 254 | 254 | 0 | 0 |
| Utah | 29 | 0 | 0 | 29 |
| Vermont | 14 | 0 | 14 | 0 |
| Virginia | 133 | 0 | 0 | 133 |
| Washington | 39 | 0 | 0 | 39 |
| West Virginia | 55 | 0 | 0 | 55 |
| Wisconsin | 72 | 72 | 0 | 0 |
| Wyoming | 23 | 0 | 2 | 21 |
Common questions
Are these 2026 childcare prices?
No. Prices are 2022 historical NDCP records. The 2026 element is the federal credit scenario and implementation discussion, not a new provider-price survey.
Does a 50% credit guarantee half-price childcare?
No. Qualification, credit-use limits, timing and other tax treatment affect an employer’s result. Our tables assume qualifying expenses and a fully usable credit and exclude other taxes and deductions.
Why are many states absent from the comparison?
The strict rule excludes missing prices and records requiring age, county, percentile or study-year imputation. Twelve states and DC have at least one usable record. The coverage table shows every jurisdiction, including exclusions.
Does an annualized benchmark represent an available childcare place?
No. It is a spending benchmark at a historical age-specific price, held constant for 52 weeks. The data does not establish vacancies, provider counts within a county, or the number of new places an employer could create.