Updated October 14, 2026. Data: U.S. Labor Department, Bureau of Labor Statistics, quarterly count of jobs and wages from employer tax records, first quarter 2026 vs. first quarter 2025. Figures are preliminary. Second-quarter 2026 figures are due in December.
Home health care companies employed about 1.84 million people in early 2026, up 1.1% from a year earlier, and the number of business locations grew 5.7%. The changes from state to state were much bigger. Jobs grew fastest in West Virginia (+21.2%), Illinois (+19.3%) and Colorado (+17.3%). New York, by far the biggest employer, fell 17.7%, from 382,262 to 314,512 jobs.
Change in jobs in each state
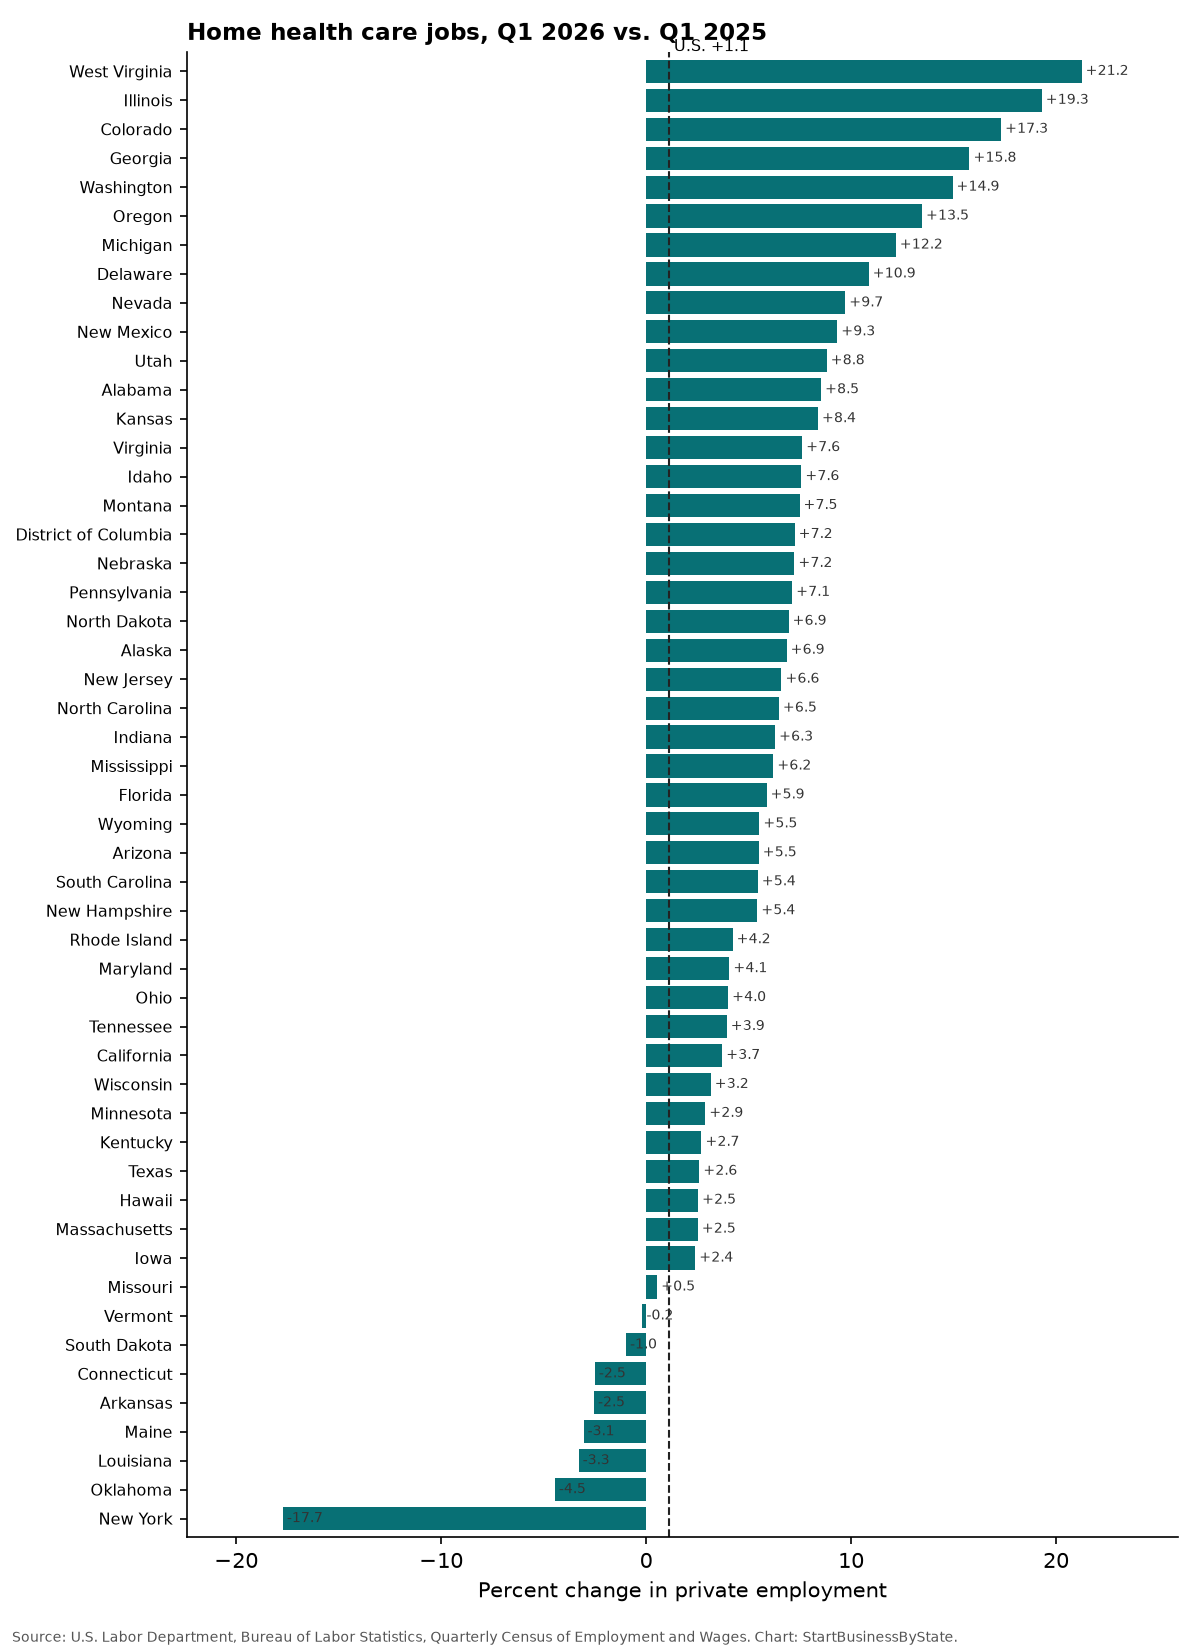
The biggest employers are New York (314,512 jobs), Texas (282,709 jobs) and California (140,659 jobs).
Every state: jobs, locations and pay
Click a column to sort. Jobs are the average of January, February and March.
| State | Jobs, Q1 2026 | Jobs, Q1 2025 | Change | Locations, Q1 2026 | Locations change | Average weekly pay |
|---|---|---|---|---|---|---|
| U.S. | 1,844,808 | 1,824,575 | +1.1% | 56,719 | +5.7% | $817 |
| Alabama | 13,922 | 12,827 | +8.5% | 702 | +16.6% | $1,256 |
| Alaska | 1,944 | 1,819 | +6.9% | 79 | +6.8% | $636 |
| Arizona | 35,332 | 33,492 | +5.5% | 797 | -5.5% | $814 |
| Arkansas | 6,919 | 7,099 | -2.5% | 496 | +6.7% | $927 |
| California | 140,659 | 135,626 | +3.7% | 6,738 | +5.8% | $966 |
| Colorado | 33,707 | 28,732 | +17.3% | 850 | +9.8% | $1,019 |
| Connecticut | 11,456 | 11,750 | -2.5% | 292 | +2.1% | $1,198 |
| Delaware | 7,154 | 6,453 | +10.9% | 227 | -1.7% | $862 |
| District of Columbia | 6,247 | 5,825 | +7.2% | 120 | +11.1% | $761 |
| Florida | 93,668 | 88,471 | +5.9% | 5,013 | +7.9% | $1,041 |
| Georgia | 46,925 | 40,531 | +15.8% | 2,414 | +10.5% | $836 |
| Hawaii | 4,317 | 4,211 | +2.5% | 130 | -2.3% | $927 |
| Idaho | 11,889 | 11,052 | +7.6% | 3,361 | +5.1% | $702 |
| Illinois | 82,864 | 69,458 | +19.3% | 1,634 | +12.1% | $674 |
| Indiana | 37,847 | 35,606 | +6.3% | 1,323 | +7.4% | $863 |
| Iowa | 6,568 | 6,415 | +2.4% | 299 | -3.5% | $1,118 |
| Kansas | 8,827 | 8,144 | +8.4% | 327 | +5.8% | $899 |
| Kentucky | 9,453 | 9,205 | +2.7% | 530 | +8.4% | $1,247 |
| Louisiana | 19,200 | 19,854 | -3.3% | 789 | +6.8% | $893 |
| Maine | 4,569 | 4,713 | -3.1% | 136 | -5.6% | $1,004 |
| Maryland | 30,040 | 28,867 | +4.1% | 1,023 | -1.4% | $814 |
| Massachusetts | 44,670 | 43,572 | +2.5% | 1,072 | +11.3% | $1,010 |
| Michigan | 49,106 | 43,774 | +12.2% | 2,491 | +6.2% | $808 |
| Minnesota | 27,236 | 26,472 | +2.9% | 1,018 | +6.4% | $813 |
| Mississippi | 8,524 | 8,026 | +6.2% | 405 | +12.5% | $1,075 |
| Missouri | 19,772 | 19,666 | +0.5% | 885 | +6.4% | $895 |
| Montana | 3,802 | 3,538 | +7.5% | 143 | -0.7% | $764 |
| Nebraska | 7,709 | 7,189 | +7.2% | 277 | +6.5% | $823 |
| Nevada | 8,396 | 7,652 | +9.7% | 478 | +6.0% | $1,051 |
| New Hampshire | 4,699 | 4,457 | +5.4% | 176 | +8.6% | $1,115 |
| New Jersey | 55,470 | 52,035 | +6.6% | 1,095 | +7.4% | $844 |
| New Mexico | 17,460 | 15,971 | +9.3% | 310 | +11.1% | $578 |
| New York | 314,512 | 382,262 | -17.7% | 1,374 | -1.4% | $702 |
| North Carolina | 45,763 | 42,979 | +6.5% | 1,663 | +6.1% | $806 |
| North Dakota | 1,544 | 1,444 | +6.9% | 90 | +4.7% | $997 |
| Ohio | 69,619 | 66,942 | +4.0% | 2,245 | +0.7% | $808 |
| Oklahoma | 12,250 | 12,821 | -4.5% | 603 | -8.5% | $820 |
| Oregon | 10,908 | 9,614 | +13.5% | 361 | +9.1% | $876 |
| Pennsylvania | 91,070 | 85,013 | +7.1% | 1,806 | +5.9% | $974 |
| Rhode Island | 5,995 | 5,752 | +4.2% | 257 | +7.1% | $960 |
| South Carolina | 23,152 | 21,956 | +5.4% | 892 | -0.4% | $819 |
| South Dakota | 2,282 | 2,305 | -1.0% | 82 | +1.2% | $838 |
| Tennessee | 23,661 | 22,766 | +3.9% | 1,007 | +20.9% | $1,127 |
| Texas | 282,709 | 275,562 | +2.6% | 6,025 | +1.9% | $585 |
| Utah | 10,117 | 9,298 | +8.8% | 485 | +3.2% | $987 |
| Vermont | 2,014 | 2,018 | -0.2% | 72 | +2.9% | $1,159 |
| Virginia | 50,061 | 46,519 | +7.6% | 2,327 | +5.6% | $774 |
| Washington | 17,157 | 14,926 | +14.9% | 573 | +10.4% | $1,068 |
| West Virginia | 7,402 | 6,105 | +21.2% | 642 | +36.3% | $881 |
| Wisconsin | 13,430 | 13,020 | +3.2% | 499 | +4.4% | $1,107 |
| Wyoming | 815 | 772 | +5.5% | 86 | +6.2% | $874 |
What the numbers show, and what they don’t
- New York changed how a big program pays its aides. On April 1, 2025, New York moved its Consumer Directed Personal Assistance Program, in which people on Medicaid hire their own home care aides, from hundreds of payroll companies to one statewide administrator, Public Partnerships LLC, according to the New York State Department of Health. When large groups of workers move to a new employer, they can be reported under a different industry code, so part of New York’s drop may be a change in how jobs are counted rather than fewer aides. The data alone can’t tell us how much.
- Big swings elsewhere can have similar causes: a large agency changing how it reports workers, opening or closing branches, or a state program changing who employs aides.
- More locations. The number of home health locations grew in 41 of the 50 states and DC.
For owners and would-be owners
- Home care is one of the jobs least likely to be replaced by software. See the jobs most protected from AI.
- Health spending drives demand. Compare with health care spending per person in each state.
- Licensing varies. Many states require a home health agency license and Medicare or Medicaid approval before you can bill.
- Nursing homes are hiring too. See nursing home jobs in 2026.
Starting a home care business?
Form your LLC with ZenBusiness. For coverage, compare business insurance quotes from Simply Business.
We may earn a commission if you use this link. It doesn’t change what you pay, and it doesn’t affect the data on this page.
How we counted
- Source: U.S. Labor Department, Bureau of Labor Statistics, Quarterly Census of Employment and Wages, industry 6216 (home health care services), privately owned businesses, first quarter of 2026 and 2025.
- Jobs are the average of the three monthly counts and include full- and part-time workers on payroll. Owners with no payroll and self-employed people aren’t counted.
- Locations are individual work sites (establishments), not companies. One company with ten offices counts ten times.
- State is where the job is located as reported by the employer.
- Preliminary: first-quarter 2026 figures can be revised.
Sources
Cite this data
Reporters and bloggers may use these numbers and charts. Please credit StartBusinessByState and link to this page.
Source: StartBusinessByState, “Home Health Jobs Jumped 21% in West Virginia and Fell 18% in New York,” https://startbusinessbystate.com/home-health-jobs/ (updated October 14, 2026).
FAQ
Are home health jobs growing?
Yes, slowly. Home health care employment was 1.1% higher in the first quarter of 2026 than a year earlier, about 1,844,808 jobs.
Where are home health jobs growing fastest?
West Virginia (+21.2%), Illinois (+19.3%) and Colorado (+17.3%).
Why did New York home health jobs drop?
New York moved its consumer-directed home care program to a single statewide payroll administrator in April 2025. That may have changed how many aides are counted in this industry. The data can’t say how many aides actually left the field.
Which states lost home health jobs?
New York (-17.7%), Oklahoma (-4.5%) and Louisiana (-3.3%) had the largest drops.
Where is this data from?
The U.S. Labor Department’s quarterly count of jobs from employer unemployment-insurance tax records, which covers nearly all payroll jobs.
Last updated October 14, 2026 by StartBusinessByState.