Updated October 13, 2026. Data: U.S. Commerce Department, Bureau of Economic Analysis, personal consumption spending by state for 2025, released September 30, 2026. Next update: fall 2027.
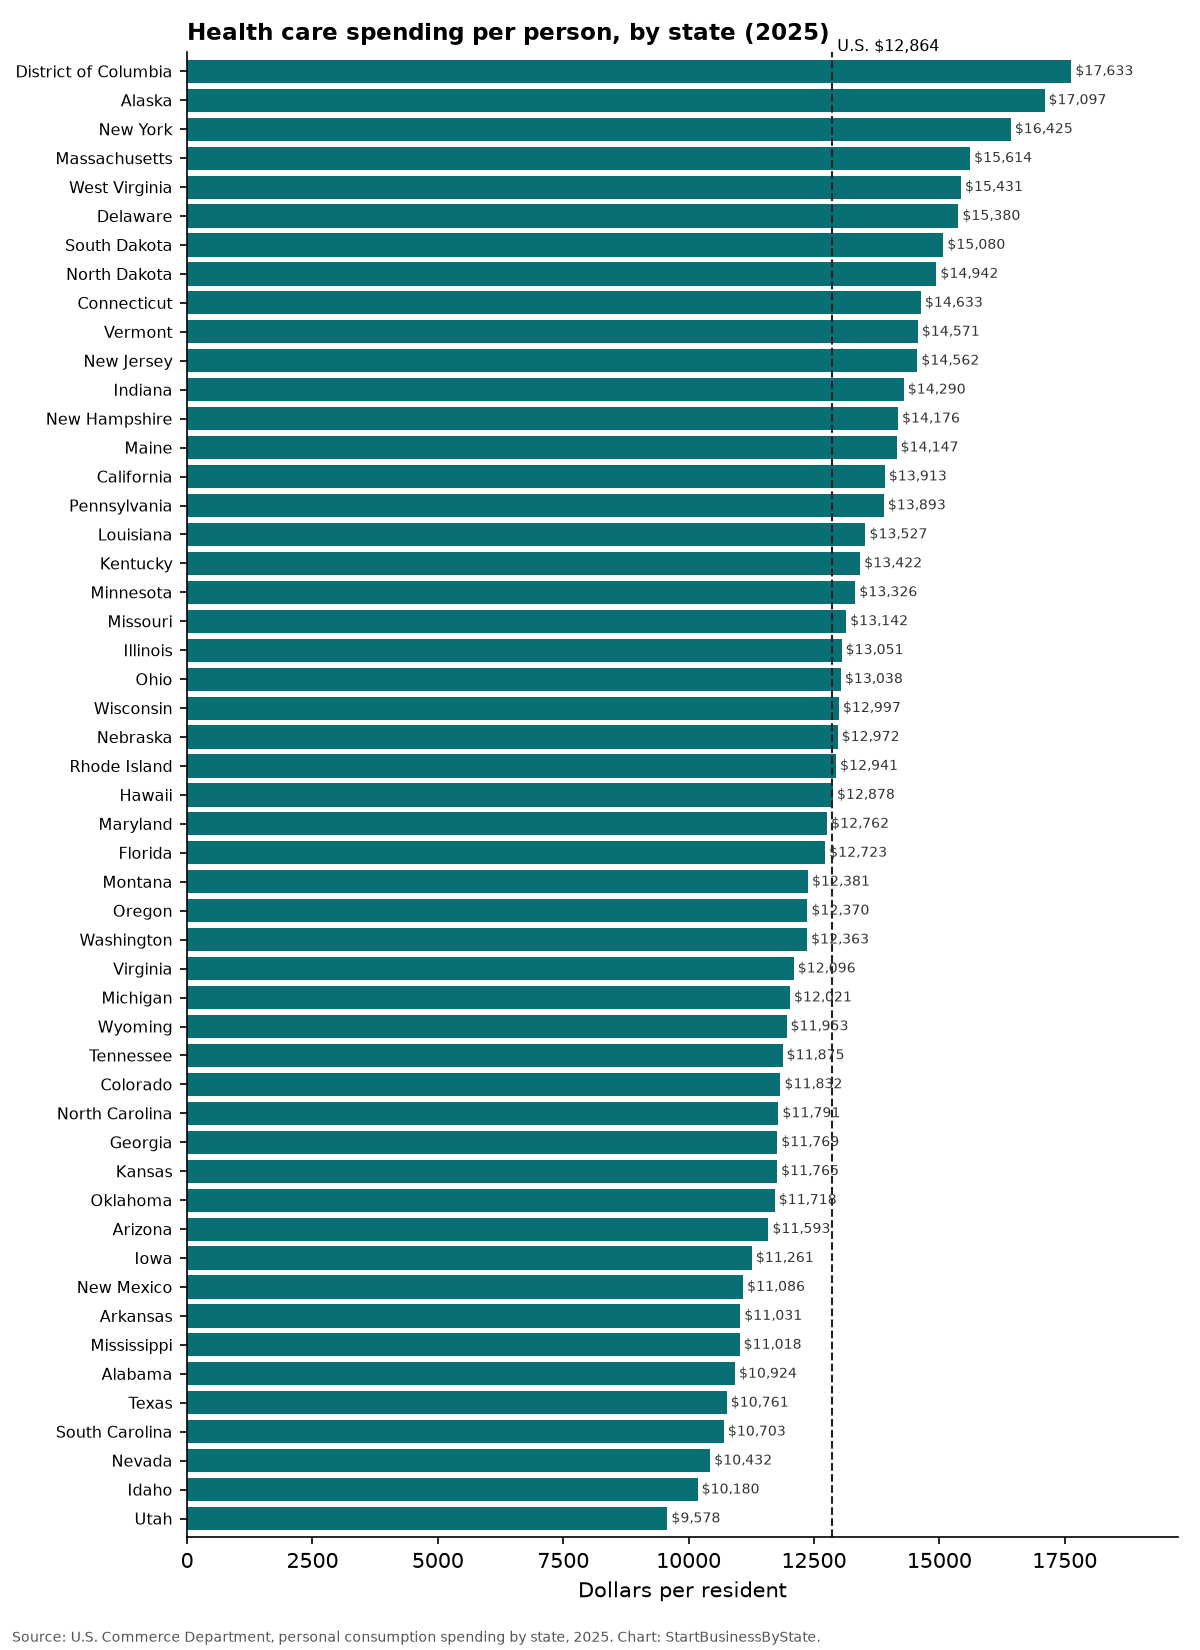
Spending on health care for U.S. households came to $12,864 per person in 2025, up 7.2% in total from 2024. It grew fastest in Florida (+10.2%), Delaware (+9.3%) and Texas (+8.4%). Per person, it was highest in District of Columbia ($17,633), Alaska ($17,097) and New York ($16,425) and lowest in Utah ($9,578), Idaho ($10,180) and Nevada ($10,432).
This counts spending on doctors, hospitals, nursing homes, dentists, prescription drugs and medical supplies for people living in each state. It includes the part paid by insurance and government programs on a household’s behalf, not just out-of-pocket costs. For staffing in one part of that system, see nursing home jobs.
Health care spending per person by state
State-by-state table
Click a column to sort.
| State | Per person, 2025 | Per person, 2024 | Total change, 2024–25 | Share of all spending | Dental per person, 2025 |
|---|---|---|---|---|---|
| U.S. | $12,864 | $12,060 | +7.2% | 21.1% | $580 |
| Alabama | $10,924 | $10,408 | +5.6% | 22.4% | $449 |
| Alaska | $17,097 | $15,884 | +7.7% | 24.3% | $828 |
| Arizona | $11,593 | $10,875 | +7.5% | 19.9% | $588 |
| Arkansas | $11,031 | $10,465 | +6.0% | 22.9% | $471 |
| California | $13,913 | $13,223 | +5.2% | 19.9% | $621 |
| Colorado | $11,832 | $10,962 | +8.4% | 17.3% | $729 |
| Connecticut | $14,633 | $13,676 | +7.4% | 20.8% | $665 |
| Delaware | $15,380 | $14,207 | +9.3% | 24.2% | $615 |
| District of Columbia | $17,633 | $16,585 | +6.7% | 17.8% | $553 |
| Florida | $12,723 | $11,639 | +10.2% | 19.3% | $581 |
| Georgia | $11,769 | $10,967 | +8.3% | 21.3% | $528 |
| Hawaii | $12,878 | $12,049 | +6.7% | 20.2% | $527 |
| Idaho | $10,180 | $9,620 | +7.3% | 20.5% | $655 |
| Illinois | $13,051 | $12,215 | +7.0% | 20.5% | $613 |
| Indiana | $14,290 | $13,424 | +7.0% | 26.3% | $540 |
| Iowa | $11,261 | $10,574 | +6.8% | 22.0% | $526 |
| Kansas | $11,765 | $11,092 | +6.5% | 22.0% | $567 |
| Kentucky | $13,422 | $12,489 | +8.0% | 26.0% | $446 |
| Louisiana | $13,527 | $12,640 | +7.1% | 25.7% | $488 |
| Maine | $14,147 | $13,330 | +6.6% | 21.6% | $638 |
| Maryland | $12,762 | $11,952 | +7.1% | 21.0% | $566 |
| Massachusetts | $15,614 | $14,722 | +6.3% | 20.8% | $792 |
| Michigan | $12,021 | $11,243 | +7.2% | 21.0% | $596 |
| Minnesota | $13,326 | $12,376 | +8.3% | 21.8% | $730 |
| Mississippi | $11,018 | $10,408 | +6.0% | 24.0% | $450 |
| Missouri | $13,142 | $12,328 | +7.1% | 23.0% | $528 |
| Montana | $12,381 | $11,491 | +8.4% | 20.2% | $695 |
| Nebraska | $12,972 | $12,164 | +7.3% | 22.8% | $566 |
| Nevada | $10,432 | $9,746 | +8.0% | 17.8% | $633 |
| New Hampshire | $14,176 | $13,183 | +8.1% | 19.6% | $867 |
| New Jersey | $14,562 | $13,601 | +7.5% | 21.2% | $643 |
| New Mexico | $11,086 | $10,266 | +7.9% | 21.8% | $477 |
| New York | $16,425 | $15,277 | +7.5% | 23.6% | $563 |
| North Carolina | $11,791 | $11,156 | +7.1% | 21.2% | $598 |
| North Dakota | $14,942 | $14,182 | +6.1% | 24.4% | $697 |
| Ohio | $13,038 | $12,281 | +6.5% | 23.6% | $507 |
| Oklahoma | $11,718 | $10,968 | +7.5% | 24.5% | $525 |
| Oregon | $12,370 | $11,539 | +7.4% | 20.4% | $719 |
| Pennsylvania | $13,893 | $13,098 | +6.2% | 22.3% | $530 |
| Rhode Island | $12,941 | $12,142 | +7.0% | 21.2% | $497 |
| South Carolina | $10,703 | $10,128 | +7.2% | 19.9% | $570 |
| South Dakota | $15,080 | $14,227 | +6.9% | 26.6% | $772 |
| Tennessee | $11,875 | $11,151 | +7.4% | 22.2% | $520 |
| Texas | $10,761 | $10,048 | +8.4% | 19.3% | $440 |
| Utah | $9,578 | $9,163 | +5.6% | 17.6% | $645 |
| Vermont | $14,571 | $13,627 | +6.6% | 22.2% | $736 |
| Virginia | $12,096 | $11,383 | +7.0% | 20.0% | $647 |
| Washington | $12,363 | $11,607 | +7.5% | 18.8% | $793 |
| West Virginia | $15,431 | $14,433 | +6.8% | 29.2% | $450 |
| Wisconsin | $12,997 | $12,066 | +8.0% | 22.7% | $628 |
| Wyoming | $11,953 | $11,433 | +4.9% | 19.1% | $626 |
Dental spending
Dental care averaged $580 per person nationally. It was highest in New Hampshire ($867) and Alaska ($828) and lowest in Texas ($440) and Kentucky ($446).
Why it matters for small businesses
- Benefit costs follow spending. Where health care costs more, employer health plans usually cost more too. See small business health insurance rate increases.
- Self-employed owners often buy their own coverage. See how many self-employed people are uninsured in each state.
- Health care is also a market. Higher spending means more demand for home health aides, medical billing, cleaning and transportation services.
About the data
- Source: U.S. Commerce Department, Bureau of Economic Analysis, personal consumption spending by state and type of product (released September 30, 2026), category “Health,” 2024 and 2025, in current dollars (not adjusted for inflation).
- Per person: total spending divided by the department’s own state population estimate for the same year.
- Where it’s counted: spending is assigned to the state where the buyer lives.
- Change compares total spending in 2025 with 2024. Per-person change is a bit lower because population grew.
Sources
Cite this data
Reporters and bloggers may use these numbers and charts. Please credit StartBusinessByState and link to this page.
Source: StartBusinessByState, “Health Care Spending Per Person by State (2025),” https://startbusinessbystate.com/health-care-spending-per-person-by-state/ (updated October 13, 2026).
FAQ
How much do Americans spend on health care per person?
$12,864 per person in 2025, counting what households and their insurers and government programs paid, according to the U.S. Commerce Department.
Which state spends the most on health care per person?
District of Columbia ($17,633), followed by Alaska ($17,097) and New York ($16,425).
Which state spends the least?
Utah ($9,578), then Idaho ($10,180) and Nevada ($10,432).
Where did health care spending grow fastest?
Florida (+10.2% in total from 2024 to 2025), Delaware (+9.3%) and Texas (+8.4%). The U.S. rose 7.2%.
Where is this data from?
The U.S. Commerce Department publishes household spending by state and type of product each fall.
Last updated October 13, 2026 by StartBusinessByState.