Updated October 14, 2026. Data: U.S. Labor Department, Bureau of Labor Statistics, quarterly count of jobs and wages from employer tax records, first quarter 2026 vs. first quarter 2025. Figures are preliminary. Second-quarter 2026 figures are due in December.
The U.S. had 138,982 dental office locations in early 2026, 1.7% more than a year earlier, while jobs at those offices grew only 0.5%, to 1,049,613. That works out to about 7.6 workers per office. Jobs grew fastest in Idaho (+3.7%), Delaware (+3.6%) and North Dakota (+3.4%) and fell most in District of Columbia (-2.9%), Arizona (-2.8%) and New Hampshire (-1.8%).
Change in jobs in each state
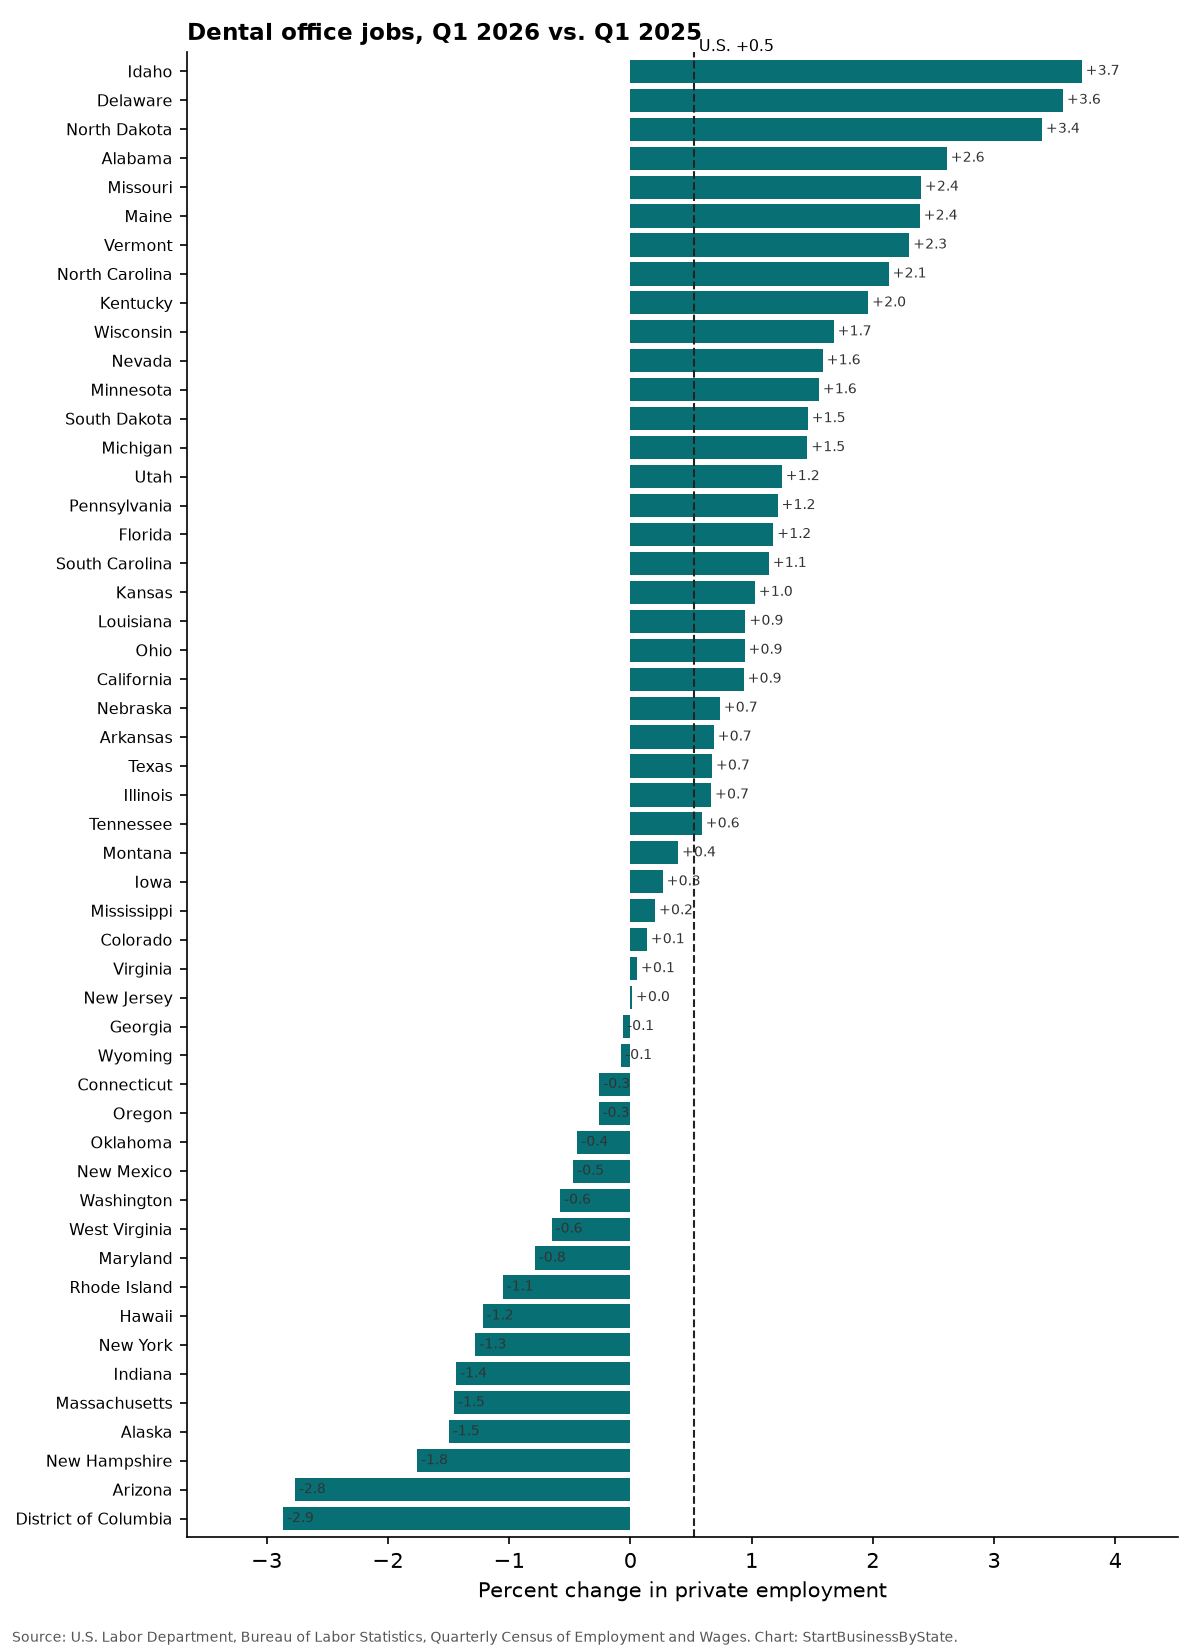
The biggest employers are California (140,492 jobs), Texas (88,788 jobs) and Florida (70,522 jobs).
Every state: jobs, locations and pay
Click a column to sort. Jobs are the average of January, February and March.
| State | Jobs, Q1 2026 | Jobs, Q1 2025 | Change | Locations, Q1 2026 | Locations change | Average weekly pay |
|---|---|---|---|---|---|---|
| U.S. | 1,049,613 | 1,044,143 | +0.5% | 138,982 | +1.7% | $1,236 |
| Alabama | 13,278 | 12,941 | +2.6% | 1,608 | +2.8% | $1,142 |
| Alaska | 2,435 | 2,472 | -1.5% | 263 | -1.5% | $1,134 |
| Arizona | 21,943 | 22,567 | -2.8% | 2,698 | -0.3% | $1,184 |
| Arkansas | 8,150 | 8,095 | +0.7% | 965 | -0.6% | $1,080 |
| California | 140,492 | 139,191 | +0.9% | 23,486 | +3.2% | $1,194 |
| Colorado | 21,610 | 21,580 | +0.1% | 3,027 | +2.0% | $1,300 |
| Connecticut | 11,710 | 11,740 | -0.3% | 1,592 | -0.3% | $1,321 |
| Delaware | 3,019 | 2,915 | +3.6% | 290 | -5.8% | $1,447 |
| District of Columbia | 1,616 | 1,664 | -2.9% | 326 | -3.6% | $1,612 |
| Florida | 70,522 | 69,700 | +1.2% | 9,911 | +3.6% | $1,281 |
| Georgia | 31,627 | 31,645 | -0.1% | 4,277 | +0.9% | $1,278 |
| Hawaii | 4,514 | 4,569 | -1.2% | 732 | +1.0% | $1,158 |
| Idaho | 7,895 | 7,611 | +3.7% | 1,014 | -3.1% | $937 |
| Illinois | 40,267 | 40,001 | +0.7% | 5,205 | +2.9% | $1,215 |
| Indiana | 20,628 | 20,928 | -1.4% | 2,248 | +0.4% | $1,230 |
| Iowa | 8,894 | 8,870 | +0.3% | 1,035 | +1.0% | $1,265 |
| Kansas | 8,985 | 8,894 | +1.0% | 929 | +1.3% | $1,160 |
| Kentucky | 11,280 | 11,063 | +2.0% | 1,581 | -1.5% | $1,149 |
| Louisiana | 12,472 | 12,355 | +0.9% | 1,681 | +1.3% | $1,023 |
| Maine | 4,262 | 4,162 | +2.4% | 437 | -1.4% | $1,359 |
| Maryland | 17,848 | 17,990 | -0.8% | 2,515 | -0.1% | $1,301 |
| Massachusetts | 25,474 | 25,850 | -1.5% | 3,069 | +1.9% | $1,394 |
| Michigan | 33,734 | 33,248 | +1.5% | 3,624 | +0.7% | $1,196 |
| Minnesota | 18,461 | 18,179 | +1.6% | 1,828 | -0.8% | $1,468 |
| Mississippi | 6,888 | 6,874 | +0.2% | 1,006 | +1.2% | $1,061 |
| Missouri | 17,290 | 16,885 | +2.4% | 2,001 | +1.1% | $1,290 |
| Montana | 3,914 | 3,899 | +0.4% | 488 | +0.6% | $1,156 |
| Nebraska | 6,372 | 6,326 | +0.7% | 759 | +0.5% | $1,227 |
| Nevada | 11,055 | 10,882 | +1.6% | 1,489 | +3.3% | $1,154 |
| New Hampshire | 5,288 | 5,383 | -1.8% | 567 | -1.7% | $1,483 |
| New Jersey | 32,197 | 32,193 | +0.0% | 4,539 | +1.9% | $1,240 |
| New Mexico | 5,491 | 5,517 | -0.5% | 650 | -3.0% | $1,142 |
| New York | 53,697 | 54,392 | -1.3% | 7,750 | -1.1% | $1,265 |
| North Carolina | 35,091 | 34,359 | +2.1% | 4,219 | +6.5% | $1,341 |
| North Dakota | 2,660 | 2,573 | +3.4% | 272 | +0.7% | $1,444 |
| Ohio | 33,617 | 33,304 | +0.9% | 3,769 | -0.9% | $1,231 |
| Oklahoma | 11,154 | 11,203 | -0.4% | 1,343 | +1.6% | $1,209 |
| Oregon | 15,881 | 15,923 | -0.3% | 1,954 | -0.2% | $1,371 |
| Pennsylvania | 35,207 | 34,784 | +1.2% | 4,487 | +0.5% | $1,238 |
| Rhode Island | 2,819 | 2,849 | -1.1% | 311 | -2.2% | $1,274 |
| South Carolina | 16,087 | 15,905 | +1.1% | 1,865 | -2.5% | $1,294 |
| South Dakota | 3,306 | 3,259 | +1.5% | 314 | +0.0% | $1,397 |
| Tennessee | 20,270 | 20,151 | +0.6% | 2,409 | +5.0% | $1,219 |
| Texas | 88,788 | 88,194 | +0.7% | 12,959 | +2.9% | $1,196 |
| Utah | 15,589 | 15,397 | +1.2% | 1,890 | +2.1% | $861 |
| Vermont | 1,898 | 1,855 | +2.3% | 195 | -2.0% | $1,435 |
| Virginia | 29,251 | 29,235 | +0.1% | 3,675 | +3.7% | $1,338 |
| Washington | 29,746 | 29,919 | -0.6% | 3,135 | -0.2% | $1,149 |
| West Virginia | 3,929 | 3,954 | -0.6% | 483 | -0.2% | $1,021 |
| Wisconsin | 19,242 | 18,925 | +1.7% | 1,888 | +0.7% | $1,349 |
| Wyoming | 1,771 | 1,772 | -0.1% | 224 | -0.9% | $1,010 |
What the numbers show, and what they don’t
- Who owns dental offices is in the news. Recent reporting has focused on private equity firms and large dental groups buying practices. This data counts offices and workers. It doesn’t show who owns them, so it can’t measure that trend or its effect on prices.
- Slow, steady change. Unlike many industries, dental jobs barely moved in most states. No state changed by more than about 4% either way.
- What’s included: offices of dentists, including general dentists, orthodontists and oral surgeons. Dental labs and dentists working inside hospitals are counted elsewhere.
For owners and would-be owners
- Dental spending per person varies a lot. See the dental section of health care spending per person.
- Pay is a big cost. Compare with what service employers pay in each state.
- Opening a practice usually means a professional entity (often a PLLC or professional corporation, depending on the state) and malpractice coverage.
Opening a dental practice?
Form your business entity with ZenBusiness. For general liability and property coverage, compare business insurance quotes from Simply Business.
We may earn a commission if you use this link. It doesn’t change what you pay, and it doesn’t affect the data on this page.
How we counted
- Source: U.S. Labor Department, Bureau of Labor Statistics, Quarterly Census of Employment and Wages, industry 6212 (offices of dentists), privately owned businesses, first quarter of 2026 and 2025.
- Jobs are the average of the three monthly counts and include full- and part-time workers on payroll. Owners with no payroll and self-employed people aren’t counted.
- Locations are individual work sites (establishments), not companies. One company with ten offices counts ten times.
- State is where the job is located as reported by the employer.
- Preliminary: first-quarter 2026 figures can be revised.
Sources
Cite this data
Reporters and bloggers may use these numbers and charts. Please credit StartBusinessByState and link to this page.
Source: StartBusinessByState, “Dental Offices Are Multiplying Faster Than Their Staff: 138,982 Locations, 1.05 Million Jobs,” https://startbusinessbystate.com/dental-office-jobs/ (updated October 14, 2026).
FAQ
How many dental offices are in the U.S.?
About 138,982 private dental office locations in the first quarter of 2026, according to the U.S. Labor Department.
How many people work in dental offices?
About 1,049,613, up 0.5% from a year earlier.
Where are dental jobs growing fastest?
Idaho (+3.7%), Delaware (+3.6%) and North Dakota (+3.4%).
Does this show private equity buying dental offices?
No. The data counts locations and jobs, not ownership.
Where is this data from?
The U.S. Labor Department’s quarterly count of jobs from employer unemployment-insurance tax records, which covers nearly all payroll jobs.
Last updated October 14, 2026 by StartBusinessByState.