American Community Survey 2024 (latest available) · Updated by StartBusinessByState
Short answer: If you work for yourself, you’re much more likely to go without health insurance than someone on a company payroll, because there’s no employer plan unless you set one up. About 28% of self-employed workers buy their own coverage, mostly through the ACA marketplace or straight from an insurer. That’s the group most affected by changes to marketplace prices and tax credits. Uninsured rates range from 5.4% in Massachusetts to 32.1% in Texas.
Key facts for reporters
- U.S., 2024: 17.4% (±0.3) of employed self-employed workers ages 19–64 had no health coverage, vs 10.9% of private-sector employees (Census ACS PUMS).
- Self-employed people whose business isn’t incorporated: 20.5% uninsured. Owners of incorporated businesses: 12.9%.
- Coverage sources for self-employed workers (people can have more than one): an employer or union plan, often through a spouse, 43.1%; a plan they bought themselves, 27.9%; Medicaid or other means-tested coverage, 14.5%.
- Highest uninsured rates: Texas (32.1%), Georgia (26.1%), New Mexico (25.5%), Nevada (24.7%), Mississippi (24.1%). Lowest: Massachusetts (5.4%), Hawaii (7.0%), Iowa (7.8%), Vermont (9.3%).
- Most likely to buy their own plan: North Dakota (45.0%), Florida (40.2%), South Dakota (36.8%), Nebraska (34.4%).
- Change since 2019: the U.S. self-employed uninsured rate fell from 20.2% to 17.4%. It went down in 41 states.
- The enhanced marketplace tax credits that were in place in 2024 ended December 31, 2025. Census data showing coverage after that change isn’t out yet. The 2025 ACS has been delayed.
Uninsured self-employed workers by state
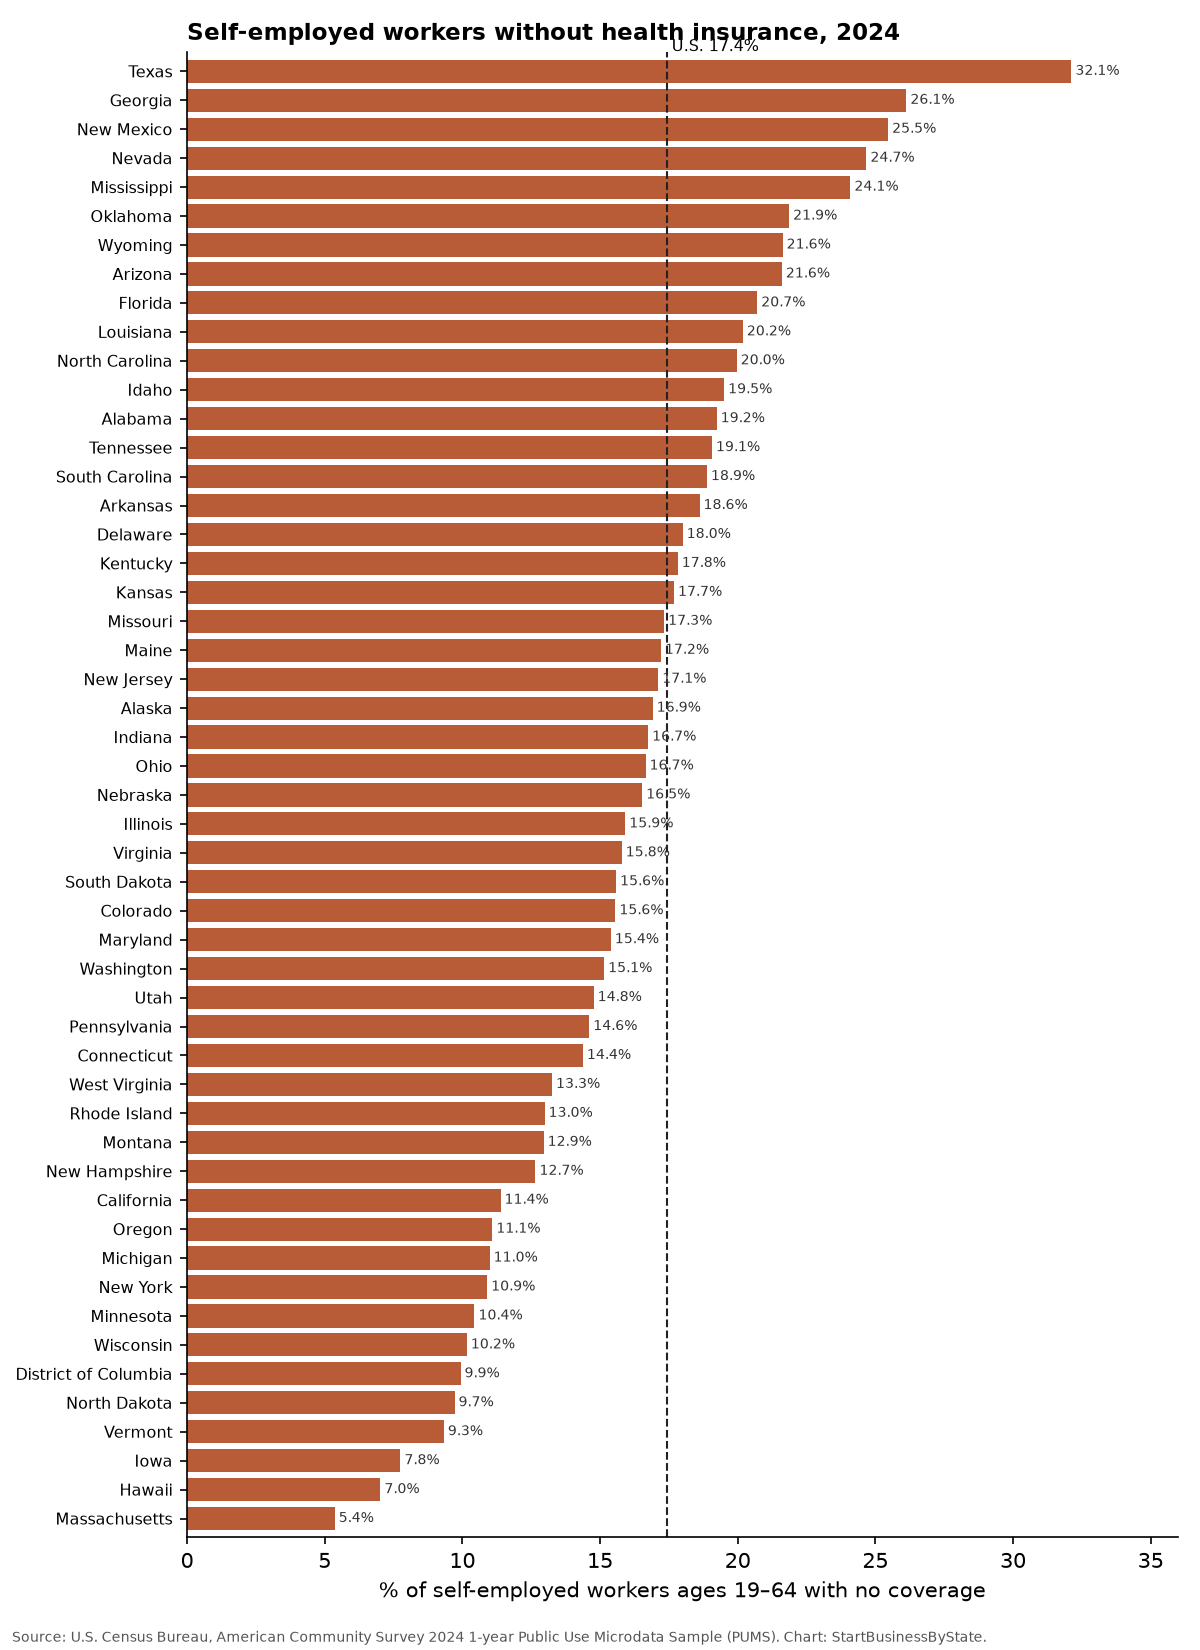
- Texas: 32.1% uninsured (±0.9)
- Georgia: 26.1% uninsured (±1.4)
- New Mexico: 25.5% uninsured (±3.4)
- Nevada: 24.7% uninsured (±2.6)
- Mississippi: 24.1% uninsured (±3.0)
- Oklahoma: 21.9% uninsured (±2.0)
- Wyoming: 21.6% uninsured (±5.6)
- Arizona: 21.6% uninsured (±1.6)
- Florida: 20.7% uninsured (±1.0)
- Louisiana: 20.2% uninsured (±2.2)
States with high uninsured rates for everyone also tend to have high rates for the self-employed. Several of the states at the top didn’t expand Medicaid to cover adults up to 138% of the poverty line. Other things matter too: what local marketplace plans cost, what kinds of work people do for themselves, and income. This page measures coverage. It doesn’t measure why people go without.
Who buys their own plan
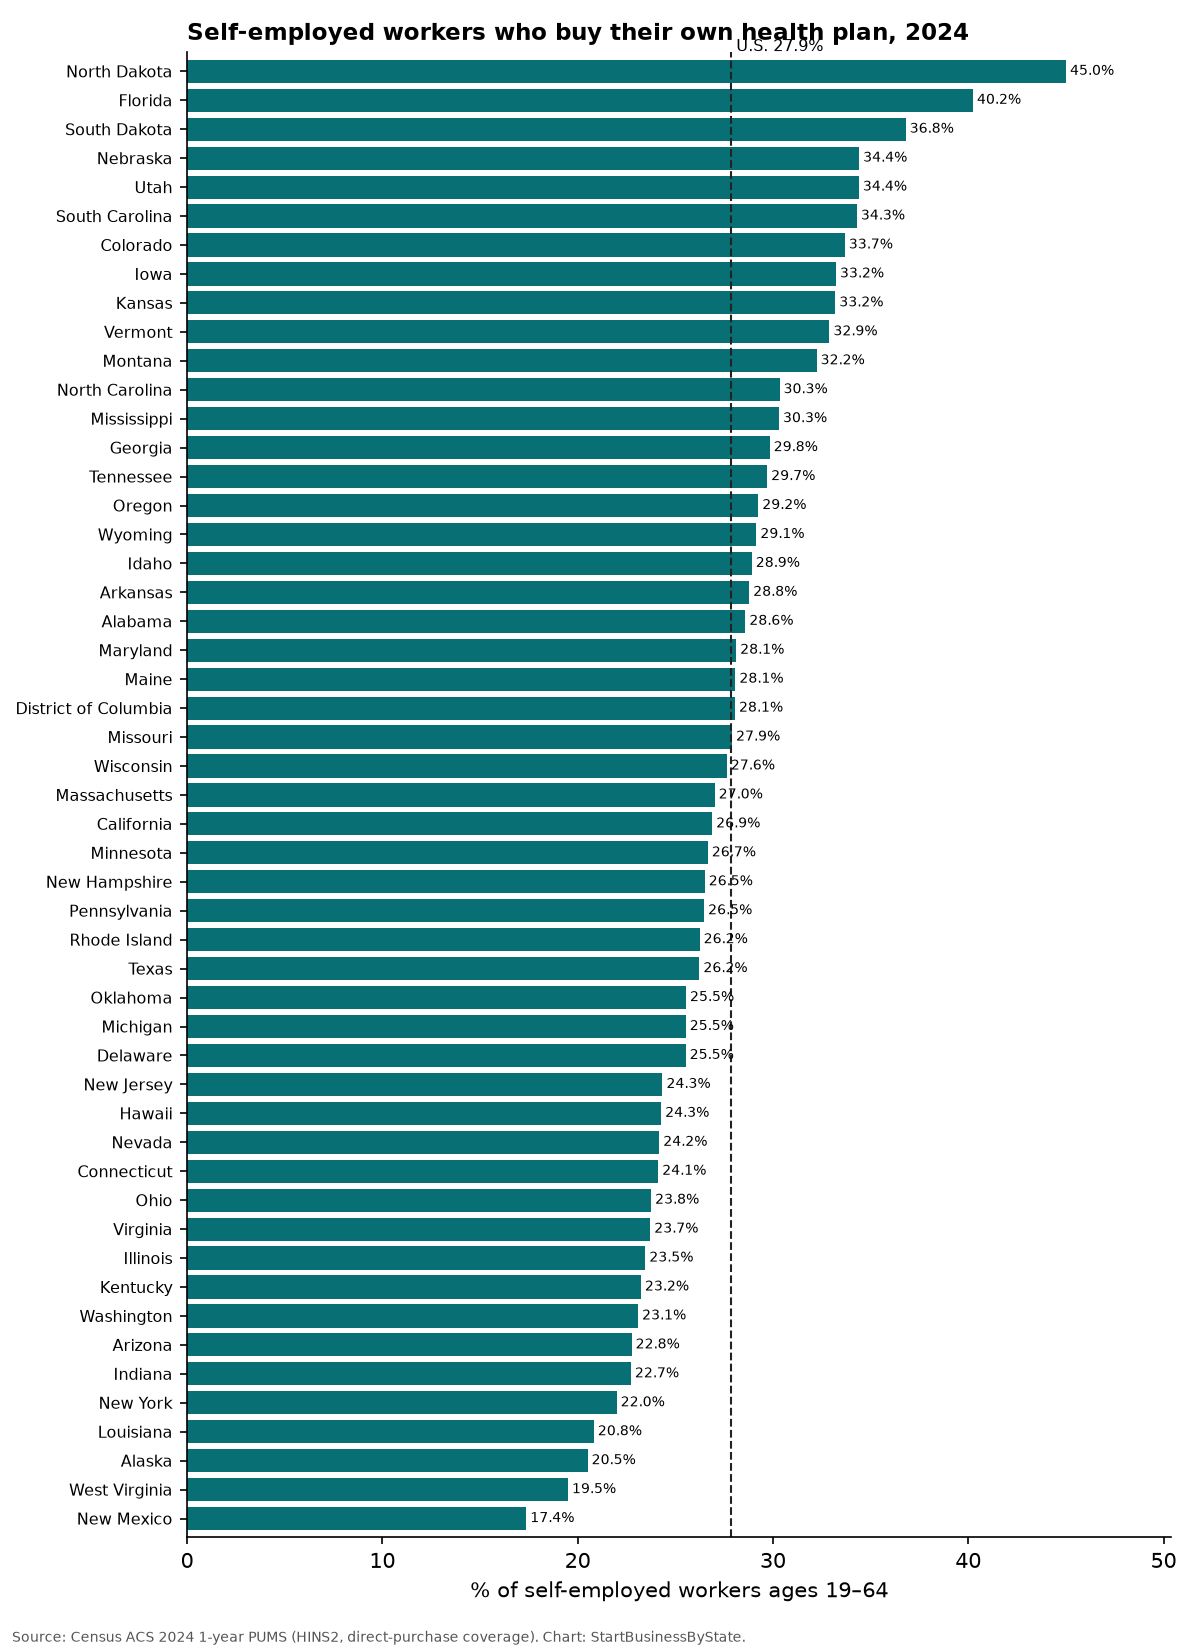
Across the U.S., 27.9% of self-employed workers had a plan they bought themselves. That’s far more than the share of regular employees who buy their own plan, because most employees get coverage at work. Self-employed people who buy their own plan are the ones most affected when marketplace premiums or tax credits change. For what a plan costs in your state in 2027, see ACA premiums for self-employed people by state.
Self-employed vs. employees
In 49 of 51 states, self-employed workers were more likely to be uninsured than private-sector employees. The exceptions were Iowa (7.8% vs 8.1%) and Montana (12.9% vs 13.1%), where the two rates were close and within the margin of error. The gap was widest in Texas (11.9 points), Mississippi (11.5 points), Georgia (10.8 points), Nevada (10.3 points). Across the U.S. it was 6.5 points.
Self-employed health coverage by state
Click a column to sort. The ± figure is the 90% margin of error. * means a small sample (margin of error over 4 points), so treat it as approximate.
| State | Self-employed uninsured, 2024 | Uninsured self-employed (people) | Private employees uninsured | Bought own plan | Employer plan (incl. spouse) | Medicaid or similar | Self-employed uninsured, 2019 |
|---|---|---|---|---|---|---|---|
| U.S. | 17.4% ±0.3 | 2,478,109 | 10.9% | 27.9% | 43.1% | 14.5% | 20.2% |
| Alabama | 19.2% ±2.4 | 36,022 | 11.1% | 28.6% | 48.0% | 7.4% | 23.1% |
| Alaska * | 16.9% ±5.0 | 4,560 | 15.5% | 20.5% | 45.7% | 16.1% | 24.3% |
| Arizona | 21.6% ±1.6 | 66,324 | 13.4% | 22.8% | 43.2% | 14.8% | 24.2% |
| Arkansas | 18.6% ±2.5 | 22,557 | 13.3% | 28.8% | 39.8% | 15.5% | 19.9% |
| California | 11.4% ±0.6 | 216,008 | 8.2% | 26.9% | 40.4% | 25.8% | 16.8% |
| Colorado | 15.6% ±1.6 | 47,343 | 10.2% | 33.7% | 39.9% | 12.9% | 16.5% |
| Connecticut | 14.4% ±2.6 | 22,210 | 8.2% | 24.1% | 47.3% | 18.2% | 14.8% |
| Delaware * | 18.0% ±4.5 | 6,763 | 8.5% | 25.5% | 43.8% | 12.8% | 19.1% |
| District of Columbia * | 9.9% ±4.5 | 2,350 | 7.8% | 28.1% | 54.5% | 13.0% | 5.6% |
| Florida | 20.7% ±1.0 | 257,121 | 14.7% | 40.2% | 34.6% | 6.4% | 26.9% |
| Georgia | 26.1% ±1.4 | 125,802 | 15.3% | 29.8% | 40.5% | 6.2% | 27.1% |
| Hawaii | 7.0% ±2.3 | 4,416 | 4.1% | 24.3% | 55.9% | 19.0% | 11.0% |
| Idaho | 19.5% ±3.2 | 19,282 | 11.7% | 28.9% | 42.7% | 11.7% | 21.3% |
| Illinois | 15.9% ±1.3 | 75,761 | 9.1% | 23.5% | 49.1% | 14.4% | 17.0% |
| Indiana | 16.7% ±1.6 | 37,529 | 9.2% | 22.7% | 47.0% | 16.7% | 17.6% |
| Iowa | 7.8% ±1.4 | 10,325 | 8.1% | 33.2% | 51.1% | 13.0% | 9.7% |
| Kansas | 17.7% ±2.6 | 20,210 | 10.8% | 33.2% | 49.0% | 4.5% | 19.3% |
| Kentucky | 17.8% ±2.5 | 27,955 | 9.7% | 23.2% | 42.8% | 20.3% | 16.6% |
| Louisiana | 20.2% ±2.2 | 36,325 | 11.8% | 20.8% | 40.4% | 20.3% | 18.9% |
| Maine | 17.2% ±2.9 | 13,653 | 7.3% | 28.1% | 40.0% | 15.3% | 18.7% |
| Maryland | 15.4% ±2.2 | 35,936 | 9.8% | 28.1% | 43.2% | 16.2% | 14.6% |
| Massachusetts | 5.4% ±0.8 | 14,212 | 3.6% | 27.0% | 51.5% | 22.6% | 7.3% |
| Michigan | 11.0% ±1.3 | 39,933 | 7.1% | 25.5% | 47.4% | 18.8% | 14.9% |
| Minnesota | 10.4% ±1.9 | 24,628 | 6.5% | 26.7% | 47.9% | 17.1% | 10.6% |
| Mississippi | 24.1% ±3.0 | 25,558 | 12.6% | 30.3% | 40.9% | 8.7% | 29.7% |
| Missouri | 17.3% ±1.7 | 39,088 | 9.9% | 27.9% | 45.6% | 11.6% | 23.7% |
| Montana | 12.9% ±2.8 | 9,076 | 13.1% | 32.2% | 44.2% | 9.8% | 17.1% |
| Nebraska | 16.5% ±3.1 | 15,882 | 9.8% | 34.4% | 44.4% | 7.4% | 13.8% |
| Nevada | 24.7% ±2.6 | 35,787 | 14.4% | 24.2% | 43.2% | 11.7% | 25.8% |
| New Hampshire | 12.7% ±2.9 | 7,101 | 5.9% | 26.5% | 54.7% | 8.9% | 19.5% |
| New Jersey | 17.1% ±1.6 | 62,704 | 10.6% | 24.3% | 48.8% | 12.9% | 16.5% |
| New Mexico | 25.5% ±3.4 | 19,575 | 17.5% | 17.4% | 34.0% | 27.2% | 22.3% |
| New York | 10.9% ±0.7 | 88,529 | 7.2% | 22.0% | 44.4% | 28.1% | 13.8% |
| North Carolina | 20.0% ±1.4 | 91,494 | 11.8% | 30.3% | 40.9% | 10.3% | 25.9% |
| North Dakota | 9.7% ±3.3 | 3,788 | 7.3% | 45.0% | 44.2% | 6.8% | 9.8% |
| Ohio | 16.7% ±1.2 | 65,726 | 8.8% | 23.8% | 45.9% | 16.4% | 17.3% |
| Oklahoma | 21.9% ±2.0 | 36,759 | 15.9% | 25.5% | 42.4% | 12.8% | 29.8% |
| Oregon | 11.1% ±1.7 | 22,340 | 8.1% | 29.2% | 42.8% | 20.4% | 17.3% |
| Pennsylvania | 14.6% ±1.5 | 67,360 | 7.4% | 26.5% | 48.7% | 12.6% | 15.3% |
| Rhode Island * | 13.0% ±5.0 | 6,205 | 7.3% | 26.2% | 46.2% | 21.9% | 8.9% |
| South Carolina | 18.9% ±2.1 | 43,063 | 12.7% | 34.3% | 41.3% | 7.1% | 24.9% |
| South Dakota * | 15.6% ±4.1 | 7,771 | 9.2% | 36.8% | 47.6% | 5.7% | 20.5% |
| Tennessee | 19.1% ±1.5 | 58,247 | 12.5% | 29.7% | 44.9% | 8.1% | 21.1% |
| Texas | 32.1% ±0.9 | 445,365 | 20.2% | 26.2% | 38.0% | 5.5% | 37.1% |
| Utah | 14.8% ±2.0 | 22,923 | 10.6% | 34.4% | 48.1% | 4.6% | 18.1% |
| Vermont | 9.3% ±3.2 | 3,449 | 7.8% | 32.9% | 41.5% | 17.9% | 8.2% |
| Virginia | 15.8% ±1.6 | 49,104 | 9.9% | 23.7% | 48.1% | 11.8% | 16.9% |
| Washington | 15.1% ±1.4 | 49,029 | 8.9% | 23.1% | 47.1% | 16.2% | 15.1% |
| West Virginia | 13.3% ±3.3 | 5,874 | 10.6% | 19.5% | 55.2% | 15.6% | 18.3% |
| Wisconsin | 10.2% ±1.4 | 22,419 | 7.0% | 27.6% | 52.3% | 12.6% | 12.8% |
| Wyoming * | 21.6% ±5.6 | 6,668 | 13.6% | 29.1% | 45.8% | 3.0% | 24.3% |
State-by-state notes
Alabama
In 2024, about 19.2% of Alabama’s self-employed workers ages 19 to 64 had no health insurance (margin of error ±2.4 points; rank 13 of 51, where 1 is highest; U.S. 17.4%). That’s roughly 36,022 people. Among people who work for a private employer, the uninsured rate was 11.1%. 28.6% of self-employed workers bought their own plan, 48.0% had coverage through an employer (often a spouse’s job) and 7.4% had Medicaid or similar coverage. In 2019, 23.1% of self-employed workers were uninsured.
Alaska
In 2024, about 16.9% of Alaska’s self-employed workers ages 19 to 64 had no health insurance (margin of error ±5.0 points; rank 23 of 51, where 1 is highest; U.S. 17.4%). That’s roughly 4,560 people. Among people who work for a private employer, the uninsured rate was 15.5%. 20.5% of self-employed workers bought their own plan, 45.7% had coverage through an employer (often a spouse’s job) and 16.1% had Medicaid or similar coverage. In 2019, 24.3% of self-employed workers were uninsured. The survey sample is small here, so treat the estimate as approximate.
Arizona
In 2024, about 21.6% of Arizona’s self-employed workers ages 19 to 64 had no health insurance (margin of error ±1.6 points; rank 8 of 51, where 1 is highest; U.S. 17.4%). That’s roughly 66,324 people. Among people who work for a private employer, the uninsured rate was 13.4%. 22.8% of self-employed workers bought their own plan, 43.2% had coverage through an employer (often a spouse’s job) and 14.8% had Medicaid or similar coverage. In 2019, 24.2% of self-employed workers were uninsured.
Arkansas
In 2024, about 18.6% of Arkansas’s self-employed workers ages 19 to 64 had no health insurance (margin of error ±2.5 points; rank 16 of 51, where 1 is highest; U.S. 17.4%). That’s roughly 22,557 people. Among people who work for a private employer, the uninsured rate was 13.3%. 28.8% of self-employed workers bought their own plan, 39.8% had coverage through an employer (often a spouse’s job) and 15.5% had Medicaid or similar coverage. In 2019, 19.9% of self-employed workers were uninsured.
California
In 2024, about 11.4% of California’s self-employed workers ages 19 to 64 had no health insurance (margin of error ±0.6 points; rank 40 of 51, where 1 is highest; U.S. 17.4%). That’s roughly 216,008 people. Among people who work for a private employer, the uninsured rate was 8.2%. 26.9% of self-employed workers bought their own plan, 40.4% had coverage through an employer (often a spouse’s job) and 25.8% had Medicaid or similar coverage. In 2019, 16.8% of self-employed workers were uninsured.
Colorado
In 2024, about 15.6% of Colorado’s self-employed workers ages 19 to 64 had no health insurance (margin of error ±1.6 points; rank 30 of 51, where 1 is highest; U.S. 17.4%). That’s roughly 47,343 people. Among people who work for a private employer, the uninsured rate was 10.2%. 33.7% of self-employed workers bought their own plan, 39.9% had coverage through an employer (often a spouse’s job) and 12.9% had Medicaid or similar coverage. In 2019, 16.5% of self-employed workers were uninsured.
Connecticut
In 2024, about 14.4% of Connecticut’s self-employed workers ages 19 to 64 had no health insurance (margin of error ±2.6 points; rank 35 of 51, where 1 is highest; U.S. 17.4%). That’s roughly 22,210 people. Among people who work for a private employer, the uninsured rate was 8.2%. 24.1% of self-employed workers bought their own plan, 47.3% had coverage through an employer (often a spouse’s job) and 18.2% had Medicaid or similar coverage. In 2019, 14.8% of self-employed workers were uninsured.
Delaware
In 2024, about 18.0% of Delaware’s self-employed workers ages 19 to 64 had no health insurance (margin of error ±4.5 points; rank 17 of 51, where 1 is highest; U.S. 17.4%). That’s roughly 6,763 people. Among people who work for a private employer, the uninsured rate was 8.5%. 25.5% of self-employed workers bought their own plan, 43.8% had coverage through an employer (often a spouse’s job) and 12.8% had Medicaid or similar coverage. In 2019, 19.1% of self-employed workers were uninsured. The survey sample is small here, so treat the estimate as approximate.
District of Columbia
In 2024, about 9.9% of District of Columbia’s self-employed workers ages 19 to 64 had no health insurance (margin of error ±4.5 points; rank 46 of 51, where 1 is highest; U.S. 17.4%). That’s roughly 2,350 people. Among people who work for a private employer, the uninsured rate was 7.8%. 28.1% of self-employed workers bought their own plan, 54.5% had coverage through an employer (often a spouse’s job) and 13.0% had Medicaid or similar coverage. In 2019, 5.6% of self-employed workers were uninsured. The survey sample is small here, so treat the estimate as approximate.
Florida
In 2024, about 20.7% of Florida’s self-employed workers ages 19 to 64 had no health insurance (margin of error ±1.0 points; rank 9 of 51, where 1 is highest; U.S. 17.4%). That’s roughly 257,121 people. Among people who work for a private employer, the uninsured rate was 14.7%. 40.2% of self-employed workers bought their own plan, 34.6% had coverage through an employer (often a spouse’s job) and 6.4% had Medicaid or similar coverage. In 2019, 26.9% of self-employed workers were uninsured.
Georgia
In 2024, about 26.1% of Georgia’s self-employed workers ages 19 to 64 had no health insurance (margin of error ±1.4 points; rank 2 of 51, where 1 is highest; U.S. 17.4%). That’s roughly 125,802 people. Among people who work for a private employer, the uninsured rate was 15.3%. 29.8% of self-employed workers bought their own plan, 40.5% had coverage through an employer (often a spouse’s job) and 6.2% had Medicaid or similar coverage. In 2019, 27.1% of self-employed workers were uninsured.
Hawaii
In 2024, about 7.0% of Hawaii’s self-employed workers ages 19 to 64 had no health insurance (margin of error ±2.3 points; rank 50 of 51, where 1 is highest; U.S. 17.4%). That’s roughly 4,416 people. Among people who work for a private employer, the uninsured rate was 4.1%. 24.3% of self-employed workers bought their own plan, 55.9% had coverage through an employer (often a spouse’s job) and 19.0% had Medicaid or similar coverage. In 2019, 11.0% of self-employed workers were uninsured.
Idaho
In 2024, about 19.5% of Idaho’s self-employed workers ages 19 to 64 had no health insurance (margin of error ±3.2 points; rank 12 of 51, where 1 is highest; U.S. 17.4%). That’s roughly 19,282 people. Among people who work for a private employer, the uninsured rate was 11.7%. 28.9% of self-employed workers bought their own plan, 42.7% had coverage through an employer (often a spouse’s job) and 11.7% had Medicaid or similar coverage. In 2019, 21.3% of self-employed workers were uninsured.
Illinois
In 2024, about 15.9% of Illinois’s self-employed workers ages 19 to 64 had no health insurance (margin of error ±1.3 points; rank 27 of 51, where 1 is highest; U.S. 17.4%). That’s roughly 75,761 people. Among people who work for a private employer, the uninsured rate was 9.1%. 23.5% of self-employed workers bought their own plan, 49.1% had coverage through an employer (often a spouse’s job) and 14.4% had Medicaid or similar coverage. In 2019, 17.0% of self-employed workers were uninsured.
Indiana
In 2024, about 16.7% of Indiana’s self-employed workers ages 19 to 64 had no health insurance (margin of error ±1.6 points; rank 24 of 51, where 1 is highest; U.S. 17.4%). That’s roughly 37,529 people. Among people who work for a private employer, the uninsured rate was 9.2%. 22.7% of self-employed workers bought their own plan, 47.0% had coverage through an employer (often a spouse’s job) and 16.7% had Medicaid or similar coverage. In 2019, 17.6% of self-employed workers were uninsured.
Iowa
In 2024, about 7.8% of Iowa’s self-employed workers ages 19 to 64 had no health insurance (margin of error ±1.4 points; rank 49 of 51, where 1 is highest; U.S. 17.4%). That’s roughly 10,325 people. Among people who work for a private employer, the uninsured rate was 8.1%. 33.2% of self-employed workers bought their own plan, 51.1% had coverage through an employer (often a spouse’s job) and 13.0% had Medicaid or similar coverage. In 2019, 9.7% of self-employed workers were uninsured.
Kansas
In 2024, about 17.7% of Kansas’s self-employed workers ages 19 to 64 had no health insurance (margin of error ±2.6 points; rank 19 of 51, where 1 is highest; U.S. 17.4%). That’s roughly 20,210 people. Among people who work for a private employer, the uninsured rate was 10.8%. 33.2% of self-employed workers bought their own plan, 49.0% had coverage through an employer (often a spouse’s job) and 4.5% had Medicaid or similar coverage. In 2019, 19.3% of self-employed workers were uninsured.
Kentucky
In 2024, about 17.8% of Kentucky’s self-employed workers ages 19 to 64 had no health insurance (margin of error ±2.5 points; rank 18 of 51, where 1 is highest; U.S. 17.4%). That’s roughly 27,955 people. Among people who work for a private employer, the uninsured rate was 9.7%. 23.2% of self-employed workers bought their own plan, 42.8% had coverage through an employer (often a spouse’s job) and 20.3% had Medicaid or similar coverage. In 2019, 16.6% of self-employed workers were uninsured.
Louisiana
In 2024, about 20.2% of Louisiana’s self-employed workers ages 19 to 64 had no health insurance (margin of error ±2.2 points; rank 10 of 51, where 1 is highest; U.S. 17.4%). That’s roughly 36,325 people. Among people who work for a private employer, the uninsured rate was 11.8%. 20.8% of self-employed workers bought their own plan, 40.4% had coverage through an employer (often a spouse’s job) and 20.3% had Medicaid or similar coverage. In 2019, 18.9% of self-employed workers were uninsured.
Maine
In 2024, about 17.2% of Maine’s self-employed workers ages 19 to 64 had no health insurance (margin of error ±2.9 points; rank 21 of 51, where 1 is highest; U.S. 17.4%). That’s roughly 13,653 people. Among people who work for a private employer, the uninsured rate was 7.3%. 28.1% of self-employed workers bought their own plan, 40.0% had coverage through an employer (often a spouse’s job) and 15.3% had Medicaid or similar coverage. In 2019, 18.7% of self-employed workers were uninsured.
Maryland
In 2024, about 15.4% of Maryland’s self-employed workers ages 19 to 64 had no health insurance (margin of error ±2.2 points; rank 31 of 51, where 1 is highest; U.S. 17.4%). That’s roughly 35,936 people. Among people who work for a private employer, the uninsured rate was 9.8%. 28.1% of self-employed workers bought their own plan, 43.2% had coverage through an employer (often a spouse’s job) and 16.2% had Medicaid or similar coverage. In 2019, 14.6% of self-employed workers were uninsured.
Massachusetts
In 2024, about 5.4% of Massachusetts’s self-employed workers ages 19 to 64 had no health insurance (margin of error ±0.8 points; rank 51 of 51, where 1 is highest; U.S. 17.4%). That’s roughly 14,212 people. Among people who work for a private employer, the uninsured rate was 3.6%. 27.0% of self-employed workers bought their own plan, 51.5% had coverage through an employer (often a spouse’s job) and 22.6% had Medicaid or similar coverage. In 2019, 7.3% of self-employed workers were uninsured.
Michigan
In 2024, about 11.0% of Michigan’s self-employed workers ages 19 to 64 had no health insurance (margin of error ±1.3 points; rank 42 of 51, where 1 is highest; U.S. 17.4%). That’s roughly 39,933 people. Among people who work for a private employer, the uninsured rate was 7.1%. 25.5% of self-employed workers bought their own plan, 47.4% had coverage through an employer (often a spouse’s job) and 18.8% had Medicaid or similar coverage. In 2019, 14.9% of self-employed workers were uninsured.
Minnesota
In 2024, about 10.4% of Minnesota’s self-employed workers ages 19 to 64 had no health insurance (margin of error ±1.9 points; rank 44 of 51, where 1 is highest; U.S. 17.4%). That’s roughly 24,628 people. Among people who work for a private employer, the uninsured rate was 6.5%. 26.7% of self-employed workers bought their own plan, 47.9% had coverage through an employer (often a spouse’s job) and 17.1% had Medicaid or similar coverage. In 2019, 10.6% of self-employed workers were uninsured.
Mississippi
In 2024, about 24.1% of Mississippi’s self-employed workers ages 19 to 64 had no health insurance (margin of error ±3.0 points; rank 5 of 51, where 1 is highest; U.S. 17.4%). That’s roughly 25,558 people. Among people who work for a private employer, the uninsured rate was 12.6%. 30.3% of self-employed workers bought their own plan, 40.9% had coverage through an employer (often a spouse’s job) and 8.7% had Medicaid or similar coverage. In 2019, 29.7% of self-employed workers were uninsured.
Missouri
In 2024, about 17.3% of Missouri’s self-employed workers ages 19 to 64 had no health insurance (margin of error ±1.7 points; rank 20 of 51, where 1 is highest; U.S. 17.4%). That’s roughly 39,088 people. Among people who work for a private employer, the uninsured rate was 9.9%. 27.9% of self-employed workers bought their own plan, 45.6% had coverage through an employer (often a spouse’s job) and 11.6% had Medicaid or similar coverage. In 2019, 23.7% of self-employed workers were uninsured.
Montana
In 2024, about 12.9% of Montana’s self-employed workers ages 19 to 64 had no health insurance (margin of error ±2.8 points; rank 38 of 51, where 1 is highest; U.S. 17.4%). That’s roughly 9,076 people. Among people who work for a private employer, the uninsured rate was 13.1%. 32.2% of self-employed workers bought their own plan, 44.2% had coverage through an employer (often a spouse’s job) and 9.8% had Medicaid or similar coverage. In 2019, 17.1% of self-employed workers were uninsured.
Nebraska
In 2024, about 16.5% of Nebraska’s self-employed workers ages 19 to 64 had no health insurance (margin of error ±3.1 points; rank 26 of 51, where 1 is highest; U.S. 17.4%). That’s roughly 15,882 people. Among people who work for a private employer, the uninsured rate was 9.8%. 34.4% of self-employed workers bought their own plan, 44.4% had coverage through an employer (often a spouse’s job) and 7.4% had Medicaid or similar coverage. In 2019, 13.8% of self-employed workers were uninsured.
Nevada
In 2024, about 24.7% of Nevada’s self-employed workers ages 19 to 64 had no health insurance (margin of error ±2.6 points; rank 4 of 51, where 1 is highest; U.S. 17.4%). That’s roughly 35,787 people. Among people who work for a private employer, the uninsured rate was 14.4%. 24.2% of self-employed workers bought their own plan, 43.2% had coverage through an employer (often a spouse’s job) and 11.7% had Medicaid or similar coverage. In 2019, 25.8% of self-employed workers were uninsured.
New Hampshire
In 2024, about 12.7% of New Hampshire’s self-employed workers ages 19 to 64 had no health insurance (margin of error ±2.9 points; rank 39 of 51, where 1 is highest; U.S. 17.4%). That’s roughly 7,101 people. Among people who work for a private employer, the uninsured rate was 5.9%. 26.5% of self-employed workers bought their own plan, 54.7% had coverage through an employer (often a spouse’s job) and 8.9% had Medicaid or similar coverage. In 2019, 19.5% of self-employed workers were uninsured.
New Jersey
In 2024, about 17.1% of New Jersey’s self-employed workers ages 19 to 64 had no health insurance (margin of error ±1.6 points; rank 22 of 51, where 1 is highest; U.S. 17.4%). That’s roughly 62,704 people. Among people who work for a private employer, the uninsured rate was 10.6%. 24.3% of self-employed workers bought their own plan, 48.8% had coverage through an employer (often a spouse’s job) and 12.9% had Medicaid or similar coverage. In 2019, 16.5% of self-employed workers were uninsured.
New Mexico
In 2024, about 25.5% of New Mexico’s self-employed workers ages 19 to 64 had no health insurance (margin of error ±3.4 points; rank 3 of 51, where 1 is highest; U.S. 17.4%). That’s roughly 19,575 people. Among people who work for a private employer, the uninsured rate was 17.5%. 17.4% of self-employed workers bought their own plan, 34.0% had coverage through an employer (often a spouse’s job) and 27.2% had Medicaid or similar coverage. In 2019, 22.3% of self-employed workers were uninsured.
New York
In 2024, about 10.9% of New York’s self-employed workers ages 19 to 64 had no health insurance (margin of error ±0.7 points; rank 43 of 51, where 1 is highest; U.S. 17.4%). That’s roughly 88,529 people. Among people who work for a private employer, the uninsured rate was 7.2%. 22.0% of self-employed workers bought their own plan, 44.4% had coverage through an employer (often a spouse’s job) and 28.1% had Medicaid or similar coverage. In 2019, 13.8% of self-employed workers were uninsured.
North Carolina
In 2024, about 20.0% of North Carolina’s self-employed workers ages 19 to 64 had no health insurance (margin of error ±1.4 points; rank 11 of 51, where 1 is highest; U.S. 17.4%). That’s roughly 91,494 people. Among people who work for a private employer, the uninsured rate was 11.8%. 30.3% of self-employed workers bought their own plan, 40.9% had coverage through an employer (often a spouse’s job) and 10.3% had Medicaid or similar coverage. In 2019, 25.9% of self-employed workers were uninsured.
North Dakota
In 2024, about 9.7% of North Dakota’s self-employed workers ages 19 to 64 had no health insurance (margin of error ±3.3 points; rank 47 of 51, where 1 is highest; U.S. 17.4%). That’s roughly 3,788 people. Among people who work for a private employer, the uninsured rate was 7.3%. 45.0% of self-employed workers bought their own plan, 44.2% had coverage through an employer (often a spouse’s job) and 6.8% had Medicaid or similar coverage. In 2019, 9.8% of self-employed workers were uninsured.
Ohio
In 2024, about 16.7% of Ohio’s self-employed workers ages 19 to 64 had no health insurance (margin of error ±1.2 points; rank 25 of 51, where 1 is highest; U.S. 17.4%). That’s roughly 65,726 people. Among people who work for a private employer, the uninsured rate was 8.8%. 23.8% of self-employed workers bought their own plan, 45.9% had coverage through an employer (often a spouse’s job) and 16.4% had Medicaid or similar coverage. In 2019, 17.3% of self-employed workers were uninsured.
Oklahoma
In 2024, about 21.9% of Oklahoma’s self-employed workers ages 19 to 64 had no health insurance (margin of error ±2.0 points; rank 6 of 51, where 1 is highest; U.S. 17.4%). That’s roughly 36,759 people. Among people who work for a private employer, the uninsured rate was 15.9%. 25.5% of self-employed workers bought their own plan, 42.4% had coverage through an employer (often a spouse’s job) and 12.8% had Medicaid or similar coverage. In 2019, 29.8% of self-employed workers were uninsured.
Oregon
In 2024, about 11.1% of Oregon’s self-employed workers ages 19 to 64 had no health insurance (margin of error ±1.7 points; rank 41 of 51, where 1 is highest; U.S. 17.4%). That’s roughly 22,340 people. Among people who work for a private employer, the uninsured rate was 8.1%. 29.2% of self-employed workers bought their own plan, 42.8% had coverage through an employer (often a spouse’s job) and 20.4% had Medicaid or similar coverage. In 2019, 17.3% of self-employed workers were uninsured.
Pennsylvania
In 2024, about 14.6% of Pennsylvania’s self-employed workers ages 19 to 64 had no health insurance (margin of error ±1.5 points; rank 34 of 51, where 1 is highest; U.S. 17.4%). That’s roughly 67,360 people. Among people who work for a private employer, the uninsured rate was 7.4%. 26.5% of self-employed workers bought their own plan, 48.7% had coverage through an employer (often a spouse’s job) and 12.6% had Medicaid or similar coverage. In 2019, 15.3% of self-employed workers were uninsured.
Rhode Island
In 2024, about 13.0% of Rhode Island’s self-employed workers ages 19 to 64 had no health insurance (margin of error ±5.0 points; rank 37 of 51, where 1 is highest; U.S. 17.4%). That’s roughly 6,205 people. Among people who work for a private employer, the uninsured rate was 7.3%. 26.2% of self-employed workers bought their own plan, 46.2% had coverage through an employer (often a spouse’s job) and 21.9% had Medicaid or similar coverage. In 2019, 8.9% of self-employed workers were uninsured. The survey sample is small here, so treat the estimate as approximate.
South Carolina
In 2024, about 18.9% of South Carolina’s self-employed workers ages 19 to 64 had no health insurance (margin of error ±2.1 points; rank 15 of 51, where 1 is highest; U.S. 17.4%). That’s roughly 43,063 people. Among people who work for a private employer, the uninsured rate was 12.7%. 34.3% of self-employed workers bought their own plan, 41.3% had coverage through an employer (often a spouse’s job) and 7.1% had Medicaid or similar coverage. In 2019, 24.9% of self-employed workers were uninsured.
South Dakota
In 2024, about 15.6% of South Dakota’s self-employed workers ages 19 to 64 had no health insurance (margin of error ±4.1 points; rank 29 of 51, where 1 is highest; U.S. 17.4%). That’s roughly 7,771 people. Among people who work for a private employer, the uninsured rate was 9.2%. 36.8% of self-employed workers bought their own plan, 47.6% had coverage through an employer (often a spouse’s job) and 5.7% had Medicaid or similar coverage. In 2019, 20.5% of self-employed workers were uninsured. The survey sample is small here, so treat the estimate as approximate.
Tennessee
In 2024, about 19.1% of Tennessee’s self-employed workers ages 19 to 64 had no health insurance (margin of error ±1.5 points; rank 14 of 51, where 1 is highest; U.S. 17.4%). That’s roughly 58,247 people. Among people who work for a private employer, the uninsured rate was 12.5%. 29.7% of self-employed workers bought their own plan, 44.9% had coverage through an employer (often a spouse’s job) and 8.1% had Medicaid or similar coverage. In 2019, 21.1% of self-employed workers were uninsured.
Texas
In 2024, about 32.1% of Texas’s self-employed workers ages 19 to 64 had no health insurance (margin of error ±0.9 points; rank 1 of 51, where 1 is highest; U.S. 17.4%). That’s roughly 445,365 people. Among people who work for a private employer, the uninsured rate was 20.2%. 26.2% of self-employed workers bought their own plan, 38.0% had coverage through an employer (often a spouse’s job) and 5.5% had Medicaid or similar coverage. In 2019, 37.1% of self-employed workers were uninsured.
Utah
In 2024, about 14.8% of Utah’s self-employed workers ages 19 to 64 had no health insurance (margin of error ±2.0 points; rank 33 of 51, where 1 is highest; U.S. 17.4%). That’s roughly 22,923 people. Among people who work for a private employer, the uninsured rate was 10.6%. 34.4% of self-employed workers bought their own plan, 48.1% had coverage through an employer (often a spouse’s job) and 4.6% had Medicaid or similar coverage. In 2019, 18.1% of self-employed workers were uninsured.
Vermont
In 2024, about 9.3% of Vermont’s self-employed workers ages 19 to 64 had no health insurance (margin of error ±3.2 points; rank 48 of 51, where 1 is highest; U.S. 17.4%). That’s roughly 3,449 people. Among people who work for a private employer, the uninsured rate was 7.8%. 32.9% of self-employed workers bought their own plan, 41.5% had coverage through an employer (often a spouse’s job) and 17.9% had Medicaid or similar coverage. In 2019, 8.2% of self-employed workers were uninsured.
Virginia
In 2024, about 15.8% of Virginia’s self-employed workers ages 19 to 64 had no health insurance (margin of error ±1.6 points; rank 28 of 51, where 1 is highest; U.S. 17.4%). That’s roughly 49,104 people. Among people who work for a private employer, the uninsured rate was 9.9%. 23.7% of self-employed workers bought their own plan, 48.1% had coverage through an employer (often a spouse’s job) and 11.8% had Medicaid or similar coverage. In 2019, 16.9% of self-employed workers were uninsured.
Washington
In 2024, about 15.1% of Washington’s self-employed workers ages 19 to 64 had no health insurance (margin of error ±1.4 points; rank 32 of 51, where 1 is highest; U.S. 17.4%). That’s roughly 49,029 people. Among people who work for a private employer, the uninsured rate was 8.9%. 23.1% of self-employed workers bought their own plan, 47.1% had coverage through an employer (often a spouse’s job) and 16.2% had Medicaid or similar coverage. In 2019, 15.1% of self-employed workers were uninsured.
West Virginia
In 2024, about 13.3% of West Virginia’s self-employed workers ages 19 to 64 had no health insurance (margin of error ±3.3 points; rank 36 of 51, where 1 is highest; U.S. 17.4%). That’s roughly 5,874 people. Among people who work for a private employer, the uninsured rate was 10.6%. 19.5% of self-employed workers bought their own plan, 55.2% had coverage through an employer (often a spouse’s job) and 15.6% had Medicaid or similar coverage. In 2019, 18.3% of self-employed workers were uninsured.
Wisconsin
In 2024, about 10.2% of Wisconsin’s self-employed workers ages 19 to 64 had no health insurance (margin of error ±1.4 points; rank 45 of 51, where 1 is highest; U.S. 17.4%). That’s roughly 22,419 people. Among people who work for a private employer, the uninsured rate was 7.0%. 27.6% of self-employed workers bought their own plan, 52.3% had coverage through an employer (often a spouse’s job) and 12.6% had Medicaid or similar coverage. In 2019, 12.8% of self-employed workers were uninsured.
Wyoming
In 2024, about 21.6% of Wyoming’s self-employed workers ages 19 to 64 had no health insurance (margin of error ±5.6 points; rank 7 of 51, where 1 is highest; U.S. 17.4%). That’s roughly 6,668 people. Among people who work for a private employer, the uninsured rate was 13.6%. 29.1% of self-employed workers bought their own plan, 45.8% had coverage through an employer (often a spouse’s job) and 3.0% had Medicaid or similar coverage. In 2019, 24.3% of self-employed workers were uninsured. The survey sample is small here, so treat the estimate as approximate.
If you work for yourself and don’t have coverage
- Open enrollment for 2027 marketplace plans starts November 1, 2026. Prices and tax credits depend on your state, age and expected income. See ACA premiums for self-employed people by state for your state’s 2027 rate requests and the income cutoff for tax credits.
- Losing other coverage (a job, a spouse’s plan, Medicaid) usually opens a special 60-day window to sign up.
- Self-employed health insurance deduction: if your business shows a profit, you may be able to deduct the premiums you pay. Check IRS rules or ask a tax pro.
- For related data, see small business health insurance rate increases and sole proprietor profits by state.
Methods and limits
- Source: U.S. Census Bureau, American Community Survey (ACS) 2024 1-year Public Use Microdata Sample, pulled from the Census API. 135,993 survey records of self-employed workers.
- Who’s counted: civilians ages 19–64 who were working in the survey week (ESR 1–2) and whose job is self-employed. That covers both incorporated (COW 7) and unincorporated (COW 6) businesses. The comparison group is private for-profit and nonprofit employees (COW 1). Ages 65 and up are left out because nearly everyone that age has Medicare.
- Coverage: “uninsured” means no health coverage of any kind at the time of the survey (HICOV). Coverage types (HINS1 employer, HINS2 direct purchase, HINS4 Medicaid or other means-tested) can overlap.
- Margins of error come from the Census Bureau’s 80 replicate weights (successive difference replication), at the 90% level. Shares are weighted with person weights. Our counts may differ slightly from Census published tables, which use different groupings.
- Timing: 2024 is the latest ACS year available. The 2025 1-year release has been delayed by the Census Bureau with no new date announced. 2019 figures use the same definitions.
Sources
- U.S. Census Bureau, ACS Public Use Microdata Sample (via the Census API)
- U.S. Census Bureau, ACS 2026 updates (release schedule)
Cite this data
Reporters and bloggers may use these numbers and charts. Please credit StartBusinessByState and link to this page.
Source: StartBusinessByState, “Self-Employed Without Health Insurance, by State,” https://startbusinessbystate.com/self-employed-uninsured-by-state/ (updated October 8, 2026).
FAQ
What percent of self-employed people have no health insurance?
17.4% of working self-employed people ages 19–64 were uninsured in 2024, according to Census ACS microdata. For private-sector employees the figure was 10.9%.
Which state has the most uninsured self-employed workers?
Texas has the highest rate (32.1%), followed by Georgia (26.1%) and New Mexico (25.5%). Massachusetts has the lowest (5.4%).
How do self-employed people get health insurance?
Most often through a spouse’s or other employer plan (43%) or by buying their own plan (28%), usually on the ACA marketplace. About 15% have Medicaid or similar coverage.
Does this data reflect the end of the enhanced ACA tax credits?
No. This is 2024 data, when the enhanced tax credits were still in effect. They ended December 31, 2025. Later Census releases will show coverage after that change.
Where is this data from?
The U.S. Census Bureau’s American Community Survey 2024 microdata. We calculated the rates and margins of error from the official survey weights.
Last updated October 8, 2026 by StartBusinessByState.