Peterson-KFF insurer filings (July 8, 2026, updated Aug. 3) · KFF State Health Facts 2026 premiums · Last updated October 2, 2026
Health insurers asked for a median 15% increase for 2027 ACA plans. If you work for yourself and buy your own coverage, that comes on top of a big jump in 2026, when the extra subsidies ended. In 13 states the typical insurer asked for 20% or more, led by Arizona at 29%. Open enrollment starts November 1.
Key findings
- The median requested increase for 2027 is 15% across 276 insurers in all 50 states and D.C. Requests run from a 1% cut to a 54% raise. Last year insurers asked for a median 18% and got 20%.
- In 13 states the typical insurer asked for 20% or more: Arizona, Oklahoma, New Mexico, Mississippi, Indiana, Montana, Alabama, South Carolina, Wisconsin, Georgia, New Jersey, Washington and Nevada.
- The smallest requests are in Vermont (6.5%), Utah (7.8%), Arkansas (8.8%) and District of Columbia (9.6%). Vermont already has the highest prices in the country.
- A 40-year-old’s benchmark plan cost $625 a month on average in 2026 before subsidies, up from $497 in 2025. It ranged from $401 in New Hampshire to $1,299 in Vermont.
- The subsidy cliff is back. The enhanced tax credits ended December 31, 2025. For 2027, a single person earning more than $63,840 gets no help. At full price, Wyoming’s 2026 benchmark plan costs $13,080 a year for one 40-year-old.
- Small businesses face a similar raise. Insurers selling small-group plans asked for a median 14% for 2027, according to a separate Peterson-KFF review published August 6, 2026.
How much insurers asked for in 2027
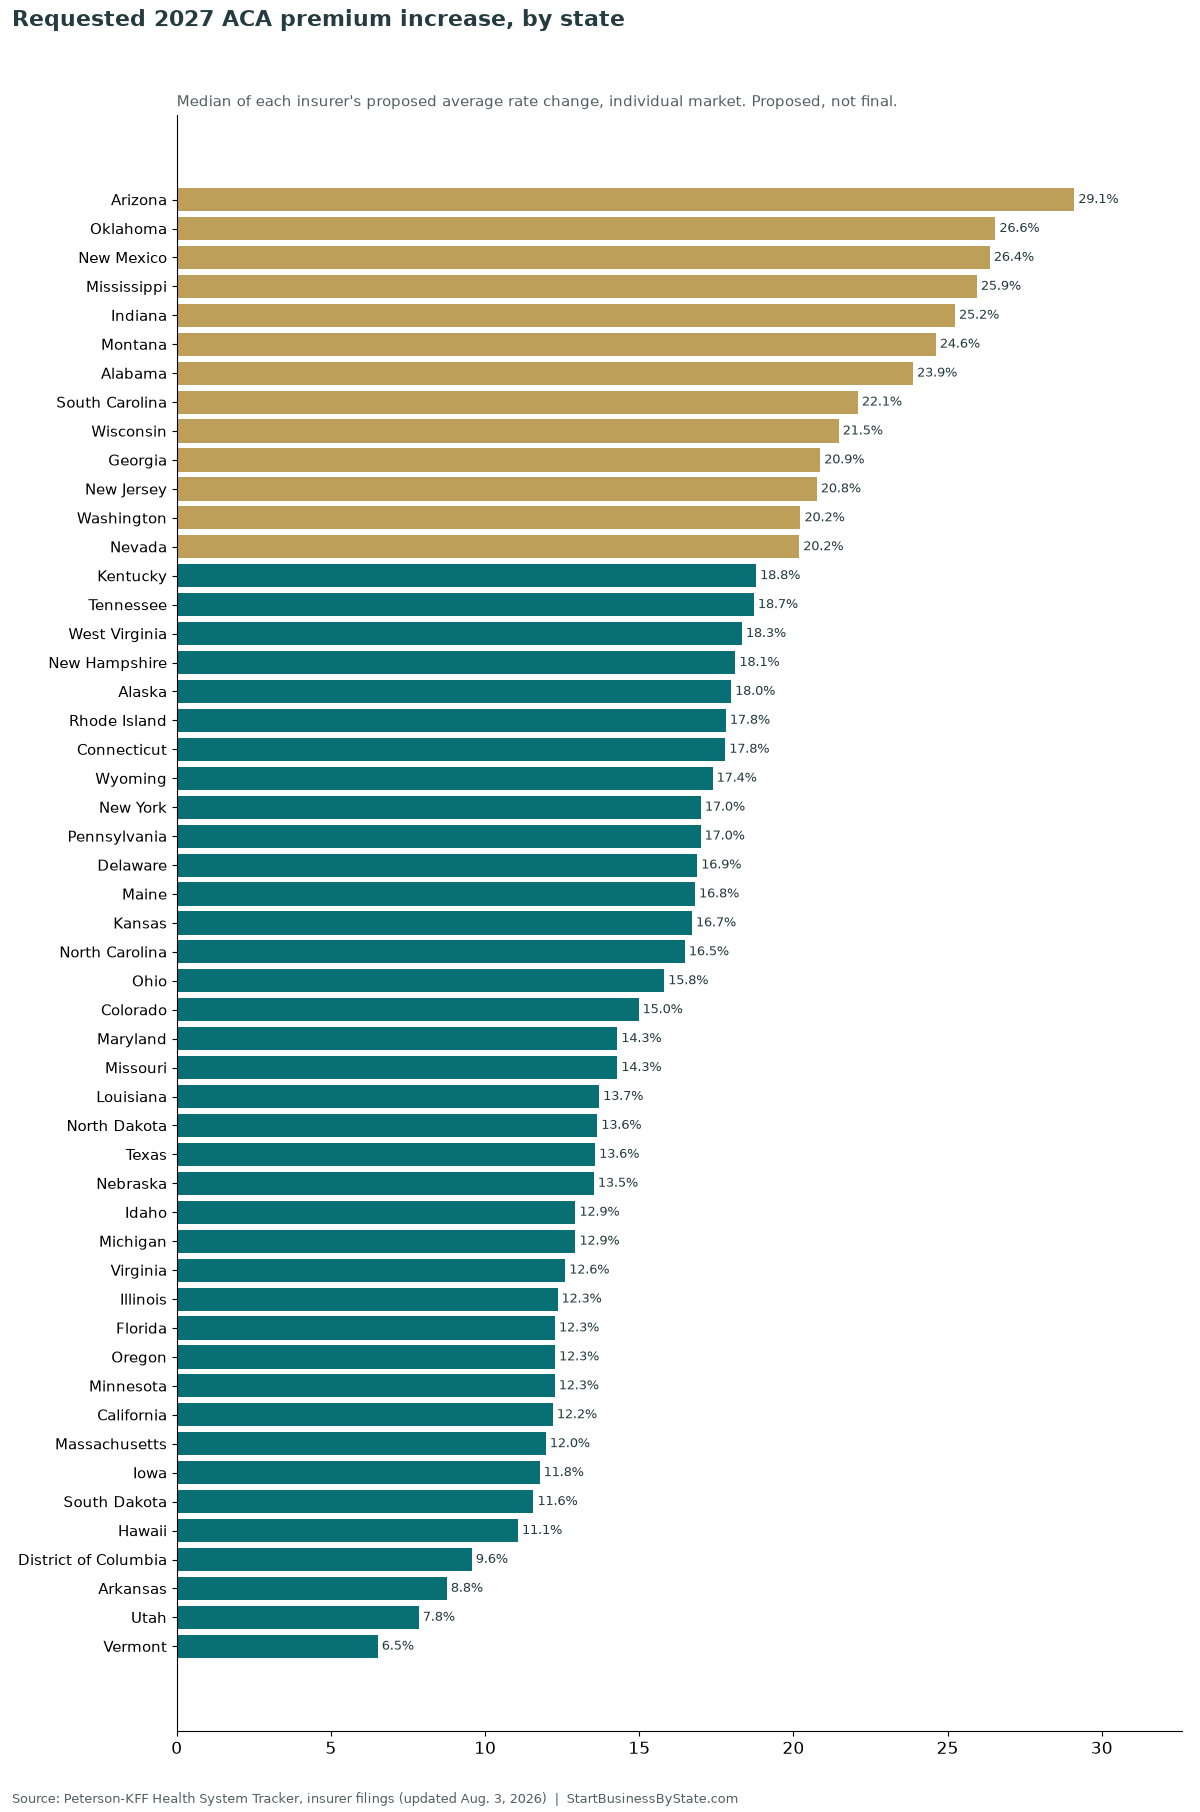
These are requests. Regulators in many states cut them before they become final. In states with only two or three insurers, one filing can swing the median a lot.
What a benchmark plan cost in 2026
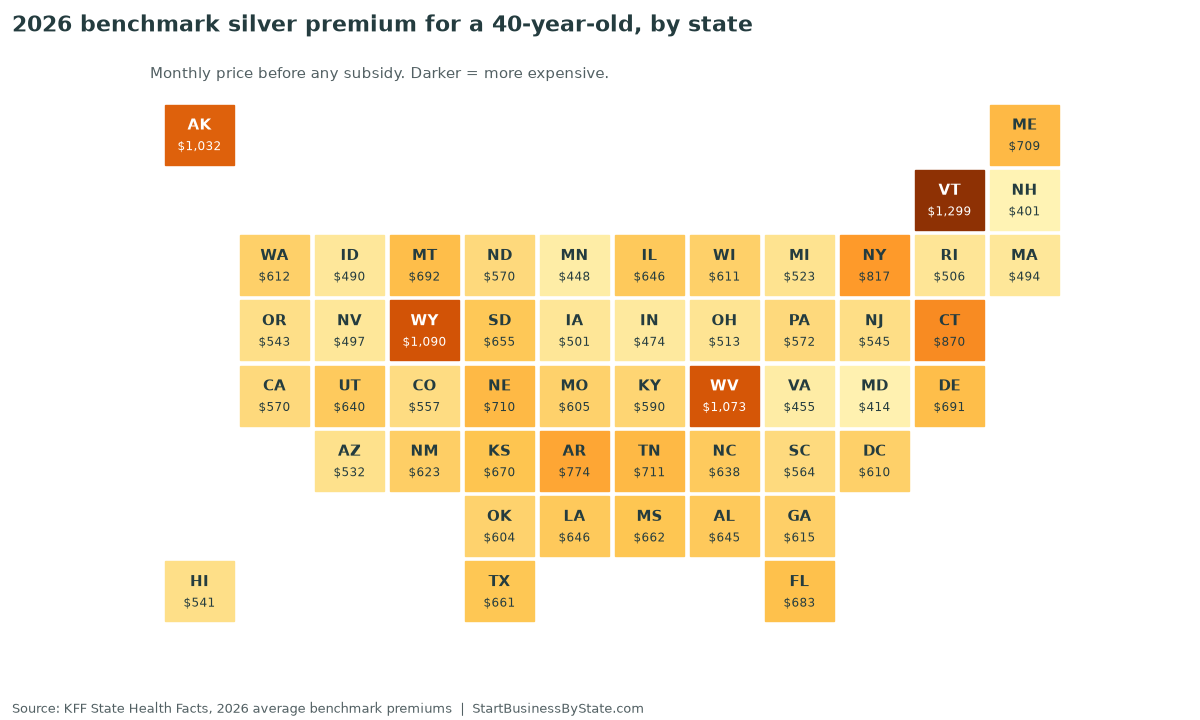
All 50 states and D.C.
Click a column heading to sort. The “rough 2027” column is our own math: the 2026 benchmark price times the state’s median request. It is not a quote, and final prices will differ.
| State | Median requested 2027 increase | Range across insurers | Insurers | 2026 benchmark, monthly (age 40) | Rough 2027 benchmark if the median request holds | 2026 benchmark, full price per year | 2026 lowest bronze, monthly |
|---|---|---|---|---|---|---|---|
| United States | 15% (all 276 insurers) | -1% to 54% | 276 | $625 | not estimated | $7,500 | $456 |
| Alabama | 23.9% | 11.6% to 35.1% | 4 | $645 | $799 | $7,740 | $433 |
| Alaska | 18.0% | 9.3% to 26.7% | 2 | $1,032 | $1,218 | $12,384 | $669 |
| Arizona | 29.1% | 3.3% to 33.9% | 6 | $532 | $687 | $6,384 | $430 |
| Arkansas | 8.8% | 3.1% to 15.9% | 4 | $774 | $842 | $9,288 | $447 |
| California | 12.2% | 5.6% to 20.5% | 10 | $570 | $640 | $6,840 | $440 |
| Colorado | 15.0% | 10.2% to 23.9% | 5 | $557 | $640 | $6,684 | $422 |
| Connecticut | 17.8% | 12.8% to 22.7% | 2 | $870 | $1,025 | $10,440 | $623 |
| Delaware | 16.9% | 13.5% to 20.2% | 2 | $691 | $808 | $8,292 | $542 |
| District of Columbia | 9.6% | 9.0% to 10.2% | 3 | $610 | $668 | $7,320 | $505 |
| Florida | 12.3% | 3.9% to 39.1% | 12 | $683 | $767 | $8,196 | $505 |
| Georgia | 20.9% | 12.2% to 54.0% | 8 | $615 | $743 | $7,380 | $485 |
| Hawaii | 11.1% | 9.0% to 13.1% | 2 | $541 | $601 | $6,492 | $414 |
| Idaho | 12.9% | 9.3% to 26.8% | 7 | $490 | $553 | $5,880 | $346 |
| Illinois | 12.3% | 9.2% to 14.9% | 5 | $646 | $726 | $7,752 | $436 |
| Indiana | 25.2% | 15.6% to 32.1% | 3 | $474 | $594 | $5,688 | $405 |
| Iowa | 11.8% | 5.0% to 16.8% | 5 | $501 | $560 | $6,012 | $359 |
| Kansas | 16.7% | 15.4% to 34.8% | 5 | $670 | $782 | $8,040 | $508 |
| Kentucky | 18.8% | 16.9% to 20.7% | 2 | $590 | $701 | $7,080 | $481 |
| Louisiana | 13.7% | 10.5% to 22.3% | 6 | $646 | $735 | $7,752 | $447 |
| Maine | 16.8% | 6.2% to 19.5% | 3 | $709 | $828 | $8,508 | $525 |
| Maryland | 14.3% | 12.0% to 14.6% | 6 | $414 | $473 | $4,968 | $283 |
| Massachusetts | 12.0% | 7.3% to 25.7% | 6 | $494 | $553 | $5,928 | $393 |
| Michigan | 12.9% | 11.1% to 25.5% | 7 | $523 | $591 | $6,276 | $384 |
| Minnesota | 12.3% | 10.0% to 12.9% | 5 | $448 | $503 | $5,376 | $384 |
| Mississippi | 25.9% | 18.6% to 32.6% | 3 | $662 | $834 | $7,944 | $589 |
| Missouri | 14.3% | 10.3% to 25.6% | 6 | $605 | $691 | $7,260 | $465 |
| Montana | 24.6% | 21.6% to 27.7% | 2 | $692 | $862 | $8,304 | $455 |
| Nebraska | 13.5% | 8.6% to 19.7% | 5 | $710 | $806 | $8,520 | $545 |
| Nevada | 20.2% | 3.1% to 26.9% | 9 | $497 | $597 | $5,964 | $396 |
| New Hampshire | 18.1% | 10.7% to 21.6% | 3 | $401 | $474 | $4,812 | $318 |
| New Jersey | 20.8% | 15.4% to 35.6% | 5 | $545 | $658 | $6,540 | $451 |
| New Mexico | 26.4% | 14.6% to 30.4% | 4 | $623 | $787 | $7,476 | $473 |
| New York | 17.0% | 1.7% to 52.1% | 11 | $817 | $956 | $9,804 | $610 |
| North Carolina | 16.5% | 8.5% to 27.4% | 5 | $638 | $743 | $7,656 | $489 |
| North Dakota | 13.6% | 7.5% to 21.4% | 3 | $570 | $648 | $6,840 | $398 |
| Ohio | 15.8% | -1.5% to 24.1% | 7 | $513 | $594 | $6,156 | $400 |
| Oklahoma | 26.6% | 12.8% to 30.5% | 4 | $604 | $764 | $7,248 | $462 |
| Oregon | 12.3% | 11.9% to 26.4% | 4 | $543 | $610 | $6,516 | $453 |
| Pennsylvania | 17.0% | 2.3% to 31.3% | 13 | $572 | $669 | $6,864 | $364 |
| Rhode Island | 17.8% | 10.6% to 25.0% | 2 | $506 | $596 | $6,072 | $367 |
| South Carolina | 22.1% | 10.7% to 45.5% | 5 | $564 | $689 | $6,768 | $410 |
| South Dakota | 11.6% | 7.2% to 11.7% | 3 | $655 | $731 | $7,860 | $484 |
| Tennessee | 18.7% | 10.4% to 28.7% | 5 | $711 | $844 | $8,532 | $508 |
| Texas | 13.6% | 4.7% to 34.0% | 16 | $661 | $751 | $7,932 | $426 |
| Utah | 7.8% | 6.0% to 15.8% | 5 | $640 | $690 | $7,680 | $510 |
| Vermont | 6.5% | 5.2% to 7.8% | 2 | $1,299 | $1,384 | $15,588 | $824 |
| Virginia | 12.6% | 5.9% to 22.8% | 7 | $455 | $512 | $5,460 | $351 |
| Washington | 20.2% | 6.7% to 32.0% | 12 | $612 | $736 | $7,344 | $364 |
| West Virginia | 18.3% | 18.3% to 18.3% | 1 | $1,073 | $1,270 | $12,876 | $775 |
| Wisconsin | 21.5% | 10.7% to 30.9% | 12 | $611 | $742 | $7,332 | $443 |
| Wyoming | 17.4% | 9.3% to 25.4% | 2 | $1,090 | $1,279 | $13,080 | $785 |
The subsidy cliff, in plain numbers
From 2021 through 2025, extra federal help capped what most people paid for a benchmark plan, with no income limit. That help ended December 31, 2025.
- For 2027 coverage, tax credits go to households earning 100% to 400% of the 2026 poverty line. For one person that is $15,960 to $63,840. For a family of four it is up to $132,000.
- Earn $1 over the limit and the credit is $0. That matters for self-employed people, whose income can jump around from year to year.
- KFF’s example: a 40-year-old in Indianapolis earning $65,000 paid $316 a month for a silver plan in 2025. That went to $477 in 2026 and would be $546 in 2027 if the requested rates are approved.
What to do now
- Shop on or after November 1. Don’t let your plan renew without looking. Prices and plan lists change every year.
- Estimate your 2027 income carefully. Your credit is based on what you expect to earn in 2027. If you are near $63,840 (single), small changes, like retirement contributions, can matter.
- Look at bronze and gold too. In 20 states, the cheapest gold plan cost no more than the benchmark silver plan on average in 2026.
- If you have workers, see our 2027 small-business health insurance rate tracker.
Cite or share this data
Source: StartBusinessByState.com, 2027 ACA premiums for self-employed owners by state (updated October 2, 2026). https://startbusinessbystate.com/aca-premiums-self-employed-by-state/
Sources and methods
- 2027 requests. Peterson-KFF Health System Tracker, “How much and why ACA Marketplace premiums are going up in 2027,” July 8, 2026, updated August 3, 2026, and its insurer-level table. We took the median of the insurers in each state. Hawaii, Illinois and Texas had public filings for only some insurers. Insurer filings are posted at ratereview.healthcare.gov.
- Small-group requests. Peterson-KFF, “How much and why premiums are going up for small businesses in 2027,” August 6, 2026 (295 insurers).
- 2026 and 2025 prices. KFF State Health Facts, average benchmark premiums and premiums by metal level, for a 40-year-old, weighted by county plan selections. Fetched October 2, 2026.
- Income limits. HHS 2026 poverty guidelines (Federal Register, January 15, 2026), which set 2027 credit limits.
- Dates. HealthCare.gov dates and deadlines, checked October 2, 2026.
- Limits. Requested increases are averages across an insurer’s plans and differ from changes in the benchmark plan. Our rough 2027 price is a simple estimate, not a forecast. Prices are for age 40 and vary by county.
FAQ
When can I sign up for 2027 ACA coverage?
Open enrollment starts November 1, 2026. On HealthCare.gov, pick a plan by December 15 for coverage that starts January 1, 2027. The last day is January 15, 2027. Some states that run their own marketplace use different dates, so check your state’s site.
Are these the final 2027 prices?
No. These are the increases insurers asked for in their filings. State regulators can approve, lower or change them. Final rates show up when plans are posted for open enrollment. You can look up an insurer’s filing at ratereview.healthcare.gov.
What happened to the bigger subsidies?
The enhanced premium tax credits that started in 2021 ended on December 31, 2025. For 2027 coverage, help is limited to households earning 100% to 400% of the poverty line. For one person that top limit is $63,840. Above it, you pay full price.
I am self-employed. Can I deduct my health insurance?
Many self-employed people can deduct what they pay for health insurance for themselves and their family if they are not eligible for an employer plan. The IRS explains the rules on Form 7206. Talk to a tax preparer about your situation.
What does "benchmark" mean?
The benchmark plan is the second-cheapest silver plan in your area. The government uses it to figure out your subsidy. The prices here are for a 40-year-old. Older people pay more and younger people pay less.
Can I use this data?
Yes. Please credit StartBusinessByState.com and link to this page. The full table is free to download as a CSV.