2027 coverage · First edition · Sources checked September 18, 2026
Small-business health insurance requests can change substantially before approval. In four verified state summaries, approved 2027 small-group increases range from 8.0% in New York to 15.5% in Oregon. New York’s published request fell by 15.7 percentage points during review. These are regulator-reported market averages—not the increase every employer will receive.
This tracker brings together nine states, four paired small-group market summaries and 23 final carrier decisions. It separates final approvals from proposals, a single-carrier announcement and a merged individual/small-employer market. It is a dated research edition, not a live feed or a complete national survey.
Three findings worth checking before renewal
- New York: 23.7% requested → 8.0% approved. That is a 15.7-percentage-point difference in the state’s published small-group summary. The final average still represents an increase.
- Connecticut, Maine and Oregon also approved lower averages than requested. The differences were 2.7, 2.2 and 1.5 percentage points, respectively.
- Carrier results vary within a state. Among the 23 paired carrier decisions compiled for Maine, New York and Oregon, 20 approved changes were below the corresponding request and three were unchanged. This selected set is not representative of all U.S. insurers.
Every rate in these findings is traceable to the official records below. We calculate the percentage-point differences and the count of reduced requests; we do not estimate a national average.
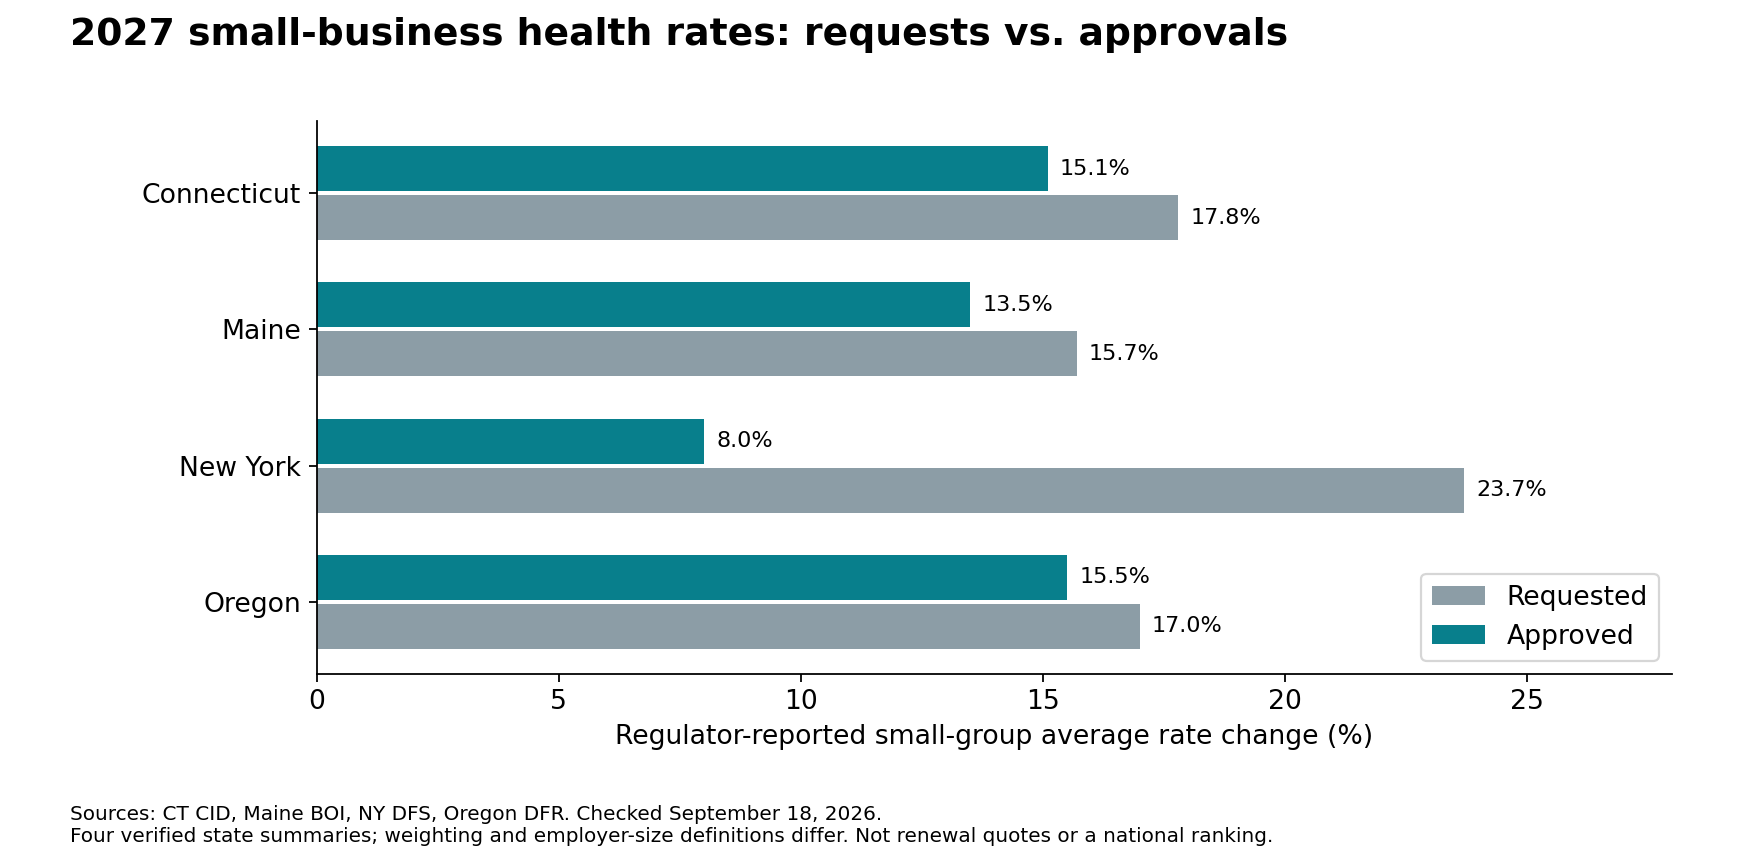
2027 health insurance rate decisions by state
Read the scope column before comparing. “Proposal verified” means we confirmed a proposed rate but have not verified a final decision for this edition. It does not prove that the regulator has not acted. A dash means the value is not established here, not zero. All rows were checked September 18, 2026; source dates are shown separately.
9 state records shown
| State / business guide | Status and scope | Requested | Approved | Difference | Source and interpretation |
|---|---|---|---|---|---|
| Connecticut | Final Small-group market average | 17.8% | 15.1% | 2.7 pp | Official source 2026-09-11 Regulator-reported average; release does not specify weighting. Fully insured small group only. |
| Maine | Final Small-group market average | 15.7% | 13.5% | 2.2 pp | Official source 2026-08-14 Membership-weighted average; six carrier rows, 36,550 covered lives. Employers with 50 or fewer employees. |
| New York | Final Small-group market average | 23.7% | 8.0% | 15.7 pp | Official source 2026-09-04 Use the DFS published summary, not an unweighted mean of its 11 carrier rows. Small groups include employers up to 100 employees. |
| Oregon | Final Small-group market average | 17.0% | 15.5% | 1.5 pp | Official source 2026-08-18 DFR published average; do not substitute an unweighted mean of the six carriers. Use final column, not intermediate adjusted rates. |
| Delaware | Final carrier only Highmark small-group plans | — | 18.0% | — | Official source 2026-09-04 Announcement reports a negotiated increase for 33 Highmark off-market small-group options; not a statewide average. Requested rate not reported. |
| Massachusetts | Final merged market Individual + small-employer merged market | 12.9% | 10.8% | 2.1 pp | Official source Source date not stated Separate comparison: enrollment-weighted base rate change for a merged market. Not small-group-only. Final table is used despite older proposed-review introductory text. |
| Maryland | Proposal verified Small-group market average | 13.1% | — | — | Official source 2026-06-26 Average annual requested change covering all four 2027 quarters. Approval not verified in this edition; do not interpret as proof that no decision exists. |
| Minnesota | Proposal verified Eight small-group carrier proposals | 10.0–21.4% carrier range | — | — | Official source Source date not stated Eight carrier proposals range from 10.0% to 21.4%. No statewide weighted average supplied; no final decision verified in this edition. |
| Rhode Island | Proposal verified Small-group market average | 8.7% | — | — | Official source 2026-06-15 Enrollment-weighted proposal; four carriers, 40,744 covered lives. March enrollment except February for UnitedHealthcare entities. No final decision verified in this edition. |
23 final small-group carrier decisions
These rows come from the New York Department of Financial Services, Maine Bureau of Insurance and Oregon Division of Financial Regulation. They show the recorded request and final average for each listed carrier or filing group. A carrier can have multiple products; the figures are not quotes for any particular plan, household or employee. “Difference” is requested minus approved, measured in percentage points.
23 carrier decisions shown
| State | Carrier | Requested | Approved | Difference | Evidence |
|---|---|---|---|---|---|
| Maine | Anthem Healthplans of Maine | 16.3% | 14.2% | 2.1 pp | Decision source |
| Maine | HPHC Insurance Company | 8.0% | 5.5% | 2.5 pp | Decision source |
| Maine | Harvard Pilgrim Health Care | 8.2% | 5.6% | 2.6 pp | Decision source |
| Maine | Maine Community Health Options | 25.2% | 23.8% | 1.4 pp | Decision source |
| Maine | UnitedHealthcare Insurance | 18.2% | 12.2% | 6.0 pp | Decision source |
| Maine | UnitedHealthcare of New England | 18.7% | 12.7% | 6.0 pp | Decision source |
| New York | Anthem HealthChoice Assurance, Inc. (Formerly Empire) | 20.4% | 14.4% | 6.0 pp | Decision source |
| New York | CDPHP | 14.1% | 9.7% | 4.4 pp | Decision source |
| New York | CDPHP UBI | 10.1% | 3.6% | 6.5 pp | Decision source |
| New York | Emblem (HIP) | 14.2% | -0.7% | 14.9 pp | Decision source |
| New York | Excellus | 17.0% | 13.5% | 3.5 pp | Decision source |
| New York | Highmark (Formerly HealthNow) | 9.2% | 0.0% | 9.2 pp | Decision source |
| New York | IHBC | 11.4% | 6.2% | 5.2 pp | Decision source |
| New York | MVP Health Plan | 19.6% | 13.6% | 6.0 pp | Decision source |
| New York | MVP Health Service Corp | 12.0% | 5.6% | 6.4 pp | Decision source |
| New York | Oxford Health Insurance Inc. | 30.6% | 6.3% | 24.3 pp | Decision source |
| New York | UnitedHealthcare Ins Co NY | 42.1% | 7.1% | 35.0 pp | Decision source |
| Oregon | Health Net Health Plan of Oregon, Inc | 19.0% | 19.0% | 0.0 pp | Decision source |
| Oregon | Kaiser Foundation Health Plan of the Northwest | 9.5% | 9.5% | 0.0 pp | Decision source |
| Oregon | Moda Health Plan, Inc | 22.7% | 19.8% | 2.9 pp | Decision source |
| Oregon | PacificSource Health Plans | 24.4% | 24.4% | 0.0 pp | Decision source |
| Oregon | Regence BlueCross BlueShield of Oregon | 15.6% | 15.4% | 0.2 pp | Decision source |
| Oregon | UnitedHealthcare Insurance Company | 28.9% | 20.2% | 8.7 pp | Decision source |
Lower than requested does not mean cheaper than last year
New York’s 23.7% request and 8.0% approval illustrate three different comparisons:
- The increase was reduced by 15.7 percentage points: 23.7 − 8.0.
- The requested increase was reduced by about 66.2%: 15.7 ÷ 23.7. This is not a 66.2% cut in the premium.
- For an unchanged hypothetical premium base, the approved total is about 12.7% below the requested total: (1.237 − 1.08) ÷ 1.237. It remains 8.0% above the previous base.
Actual renewals can differ because of plan design, employee ages, geography, renewal timing, participation and employer contribution choices. A state average cannot establish an individual employer’s bill. The tracker covers fully insured small-group rate records; it does not measure self-funded employer costs or individual-market subsidies.

Model the change in your employer contribution
Enter an assumed monthly total premium per enrolled employee and the percentage your business pays. The calculator keeps enrollment, coverage and the contribution percentage constant. A state preset supplies the published market-average pair only; replace it with your own comparable renewal figures for a business-specific scenario.
Examples for five and ten enrolled employees
Every example assumes $600 monthly total premium per enrolled employee and a 75% employer contribution for 12 months. These are illustrative inputs, not observed premiums or recommended contribution levels. Current annual employer contributions are $27,000 for five employees and $54,000 for ten.
| State rate pair | Enrolled employees | Increase at approved rate | Request minus approval |
|---|---|---|---|
| Connecticut | 5 | $4,077 | $729 |
| Connecticut | 10 | $8,154 | $1,458 |
| Maine | 5 | $3,645 | $594 |
| Maine | 10 | $7,290 | $1,188 |
| New York | 5 | $2,160 | $4,239 |
| New York | 10 | $4,320 | $8,478 |
| Oregon | 5 | $4,185 | $405 |
| Oregon | 10 | $8,370 | $810 |
Download the evidence and charts
- Nine-state decision tracker CSV — status, scope, dates, rates, source URLs and limitations.
- 23 carrier decisions CSV — the paired rates and calculated percentage-point gaps.
- Eight employer budget scenarios CSV — editable assumptions and calculated annual amounts.
- Requested versus approved chart (PNG).
- Request-to-approval gap chart (PNG).
You may reuse our original charts and calculated tables with attribution to StartBusinessByState.com and a link to this study. Keep the scope and date with the graphic. Suggested citation: StartBusinessByState.com, “2027 Small-Business Health Insurance Rate Tracker,” September 18, 2026 edition, compiled from state insurance regulators. Official-source links remain in the datasets for independent checking.
Sources, calculations and coverage limits
We reviewed official regulator announcements, HTML tables and public PDFs for 2027 coverage. The four paired market summaries are Connecticut, Maine, New York and Oregon. Carrier detail covers Maine, New York and Oregon. Other rows preserve distinct scope or proposal status. This is a selected first edition based on verified accessible records, not a random sample or all-state census. States outside the table were not verified for inclusion; absence does not mean no increase or no decision.
For each pair, gap in percentage points = requested change − approved change. We preserve published state averages and do not average the carrier rows ourselves. Maine explicitly labels its summary membership-weighted. New York’s state summary is retained as published; Connecticut’s announcement and Oregon’s summary do not provide enough weighting detail here to standardize a pooled comparison. New York includes employers up to 100 employees, while Maine’s cited announcement describes 50 or fewer. No national average or “best state” ranking is calculated.
For budget examples, annual employer contribution = enrolled employees × monthly total premium per employee × 12 × employer contribution share. Multiply that base by 1 + rate change/100 for each scenario. The difference between those annual amounts is modeled, not observed. The model excludes enrollment changes, changing family-tier mix, tax effects, fees and benefit redesign.
Source dates differ from our September 18 check date. Where a source does not state a publication date, the dataset leaves it blank. Proposal-only rows mean a final decision was not verified here, not that approval remains pending everywhere. Oregon’s final column is used rather than its intermediate adjusted column. Massachusetts’s final table takes precedence over its older introductory review text.
Update record: September 18, 2026 — first verified edition, nine states and 23 final carrier pairs. This page is manually maintained; it does not update automatically. Each future revision should retain the prior snapshot, check the underlying regulator records and date any changed status or figure.
Use the numbers in an operating budget
Keep health benefits separate from wages, payroll taxes, workers’ compensation and business liability coverage. The cleaning employee cost calculator lets you include your own benefits and other employer-cost assumptions. For the timing of hiring expenses and customer payments, use the hiring cash calculator. The business-loan rate study provides a separate financing sensitivity check; borrowing does not remove an ongoing benefits expense.
For local setup requirements, follow the state business-guide links in the tracker. Health coverage in this study is employee medical coverage; it should not be confused with the liability and workers’ compensation policies discussed in our industry insurance guides.
Common questions
Is a proposed increase what my business will pay?
No. A proposal may be revised, and even an approved market average is not a plan-specific renewal quote. Verify the final notice, coverage details and contribution arrangement for your business.
Can I compare Massachusetts’s 10.8% with New York’s 8.0%?
Only with the scope distinction attached: Massachusetts reports a merged individual/small-employer market, while the New York figure here is small-group-only. Neither percentage tells you which state has cheaper coverage.
Why are some approved values blank?
This edition has not verified a final value for those records. Missing values remain blank in downloads and appear as a dash in the table. They are never treated as zero.