Updated October 15, 2026. Data: U.S. Commerce Department, Bureau of Economic Analysis, state household spending for 2025, released September 30, 2026. Next update: fall 2027.
Americans spent $1,512 per person on household utilities and fuels in 2025, and total spending rose 8.4% from 2024, one of the bigger jumps among everyday bills. Spending per person was highest in Massachusetts ($1,812), Vermont ($1,790) and Pennsylvania ($1,772) and lowest in Utah ($1,225), Idaho ($1,291) and Nebraska ($1,338).
This counts what households paid for electricity, natural gas, heating oil, propane and other home fuels, plus water, sewer and trash service. Phone and internet bills are not included. Amounts are in current dollars, so part of the rise is higher prices.
Colder states that heat with oil or propane, like much of New England, tend to rank high. Places with mild weather or cheaper power tend to rank low. Weather in a given year can move these numbers a lot.
Spending per person in each state
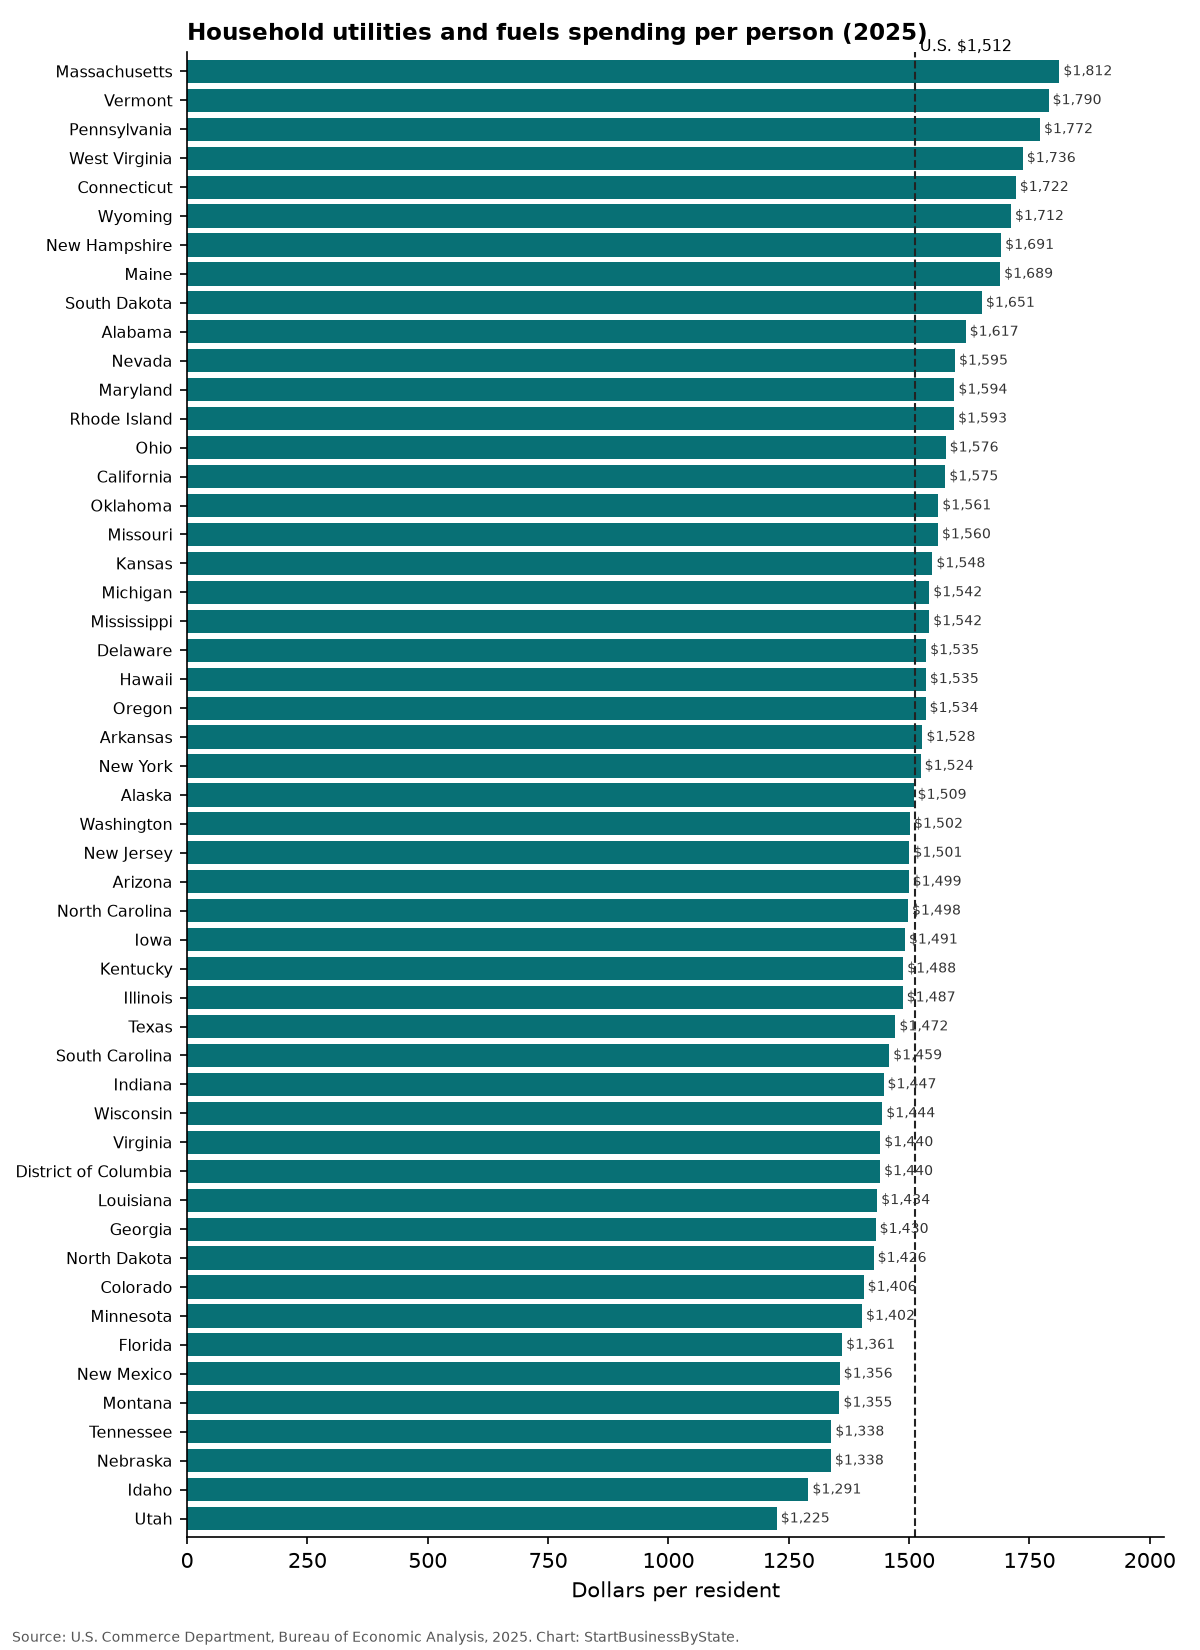
Total spending grew fastest in Maine (+15.3%), Nevada (+14.0%) and New Hampshire (+13.9%) and slowest in Tennessee (+6.1%), Washington (+6.1%) and Iowa (+6.1%).
Every state: spending per person, 2025
Click a column to sort.
| State | Per person, 2025 | Per person, 2024 | Per person, 2019 | Total change, 2024–25 | Total, 2025 | Share of all spending |
|---|---|---|---|---|---|---|
| U.S. | $1,512 | $1,402 | $1,136 | +8.4% | $516.7B | 2.48% |
| Alabama | $1,617 | $1,515 | $1,271 | +7.4% | $8.40B | 3.32% |
| Alaska | $1,509 | $1,402 | $1,225 | +7.8% | $1.11B | 2.15% |
| Arizona | $1,499 | $1,407 | $1,167 | +7.5% | $11.43B | 2.57% |
| Arkansas | $1,528 | $1,435 | $1,183 | +7.1% | $4.76B | 3.17% |
| California | $1,575 | $1,447 | $1,015 | +8.8% | $62.00B | 2.25% |
| Colorado | $1,406 | $1,302 | $1,053 | +8.4% | $8.45B | 2.05% |
| Connecticut | $1,722 | $1,558 | $1,208 | +10.9% | $6.35B | 2.45% |
| Delaware | $1,535 | $1,407 | $1,214 | +10.1% | $1.63B | 2.41% |
| District of Columbia | $1,440 | $1,325 | $1,024 | +9.0% | $1.00B | 1.46% |
| Florida | $1,361 | $1,271 | $1,006 | +8.0% | $31.93B | 2.06% |
| Georgia | $1,430 | $1,333 | $1,126 | +8.2% | $16.17B | 2.59% |
| Hawaii | $1,535 | $1,440 | $1,123 | +6.4% | $2.20B | 2.41% |
| Idaho | $1,291 | $1,191 | $959 | +9.9% | $2.62B | 2.60% |
| Illinois | $1,487 | $1,367 | $1,102 | +8.9% | $18.91B | 2.33% |
| Indiana | $1,447 | $1,365 | $1,228 | +6.6% | $10.09B | 2.67% |
| Iowa | $1,491 | $1,408 | $1,296 | +6.1% | $4.83B | 2.91% |
| Kansas | $1,548 | $1,443 | $1,263 | +7.7% | $4.61B | 2.89% |
| Kentucky | $1,488 | $1,403 | $1,168 | +6.5% | $6.85B | 2.88% |
| Louisiana | $1,434 | $1,345 | $1,056 | +6.7% | $6.62B | 2.73% |
| Maine | $1,689 | $1,471 | $1,134 | +15.3% | $2.39B | 2.58% |
| Maryland | $1,594 | $1,480 | $1,191 | +8.1% | $9.99B | 2.62% |
| Massachusetts | $1,812 | $1,640 | $1,240 | +10.8% | $12.96B | 2.42% |
| Michigan | $1,542 | $1,447 | $1,240 | +6.8% | $15.62B | 2.69% |
| Minnesota | $1,402 | $1,306 | $1,134 | +8.0% | $8.18B | 2.29% |
| Mississippi | $1,542 | $1,422 | $1,174 | +8.6% | $4.55B | 3.36% |
| Missouri | $1,560 | $1,457 | $1,262 | +7.5% | $9.78B | 2.74% |
| Montana | $1,355 | $1,242 | $1,111 | +9.8% | $1.55B | 2.21% |
| Nebraska | $1,338 | $1,266 | $1,182 | +6.3% | $2.70B | 2.35% |
| Nevada | $1,595 | $1,412 | $1,041 | +14.0% | $5.24B | 2.73% |
| New Hampshire | $1,691 | $1,492 | $1,078 | +13.9% | $2.39B | 2.34% |
| New Jersey | $1,501 | $1,408 | $1,177 | +7.1% | $14.33B | 2.19% |
| New Mexico | $1,356 | $1,265 | $1,029 | +7.1% | $2.88B | 2.66% |
| New York | $1,524 | $1,401 | $1,098 | +8.8% | $30.48B | 2.19% |
| North Carolina | $1,498 | $1,398 | $1,195 | +8.6% | $16.77B | 2.69% |
| North Dakota | $1,426 | $1,311 | $1,176 | +9.6% | $1.14B | 2.33% |
| Ohio | $1,576 | $1,443 | $1,196 | +9.5% | $18.75B | 2.85% |
| Oklahoma | $1,561 | $1,439 | $1,199 | +9.1% | $6.44B | 3.27% |
| Oregon | $1,534 | $1,430 | $1,099 | +7.5% | $6.56B | 2.53% |
| Pennsylvania | $1,772 | $1,623 | $1,382 | +9.3% | $23.14B | 2.84% |
| Rhode Island | $1,593 | $1,449 | $1,101 | +10.4% | $1.78B | 2.61% |
| South Carolina | $1,459 | $1,373 | $1,203 | +7.8% | $8.12B | 2.72% |
| South Dakota | $1,651 | $1,529 | $1,321 | +9.0% | $1.54B | 2.91% |
| Tennessee | $1,338 | $1,273 | $1,112 | +6.1% | $9.79B | 2.50% |
| Texas | $1,472 | $1,370 | $1,108 | +8.8% | $46.66B | 2.63% |
| Utah | $1,225 | $1,102 | $859 | +12.3% | $4.34B | 2.25% |
| Vermont | $1,790 | $1,578 | $1,217 | +13.1% | $1.15B | 2.72% |
| Virginia | $1,440 | $1,359 | $1,176 | +6.7% | $12.79B | 2.38% |
| Washington | $1,502 | $1,429 | $1,146 | +6.1% | $12.02B | 2.29% |
| West Virginia | $1,736 | $1,600 | $1,275 | +8.4% | $3.07B | 3.29% |
| Wisconsin | $1,444 | $1,353 | $1,147 | +7.0% | $8.63B | 2.52% |
| Wyoming | $1,712 | $1,543 | $1,193 | +11.3% | $1.01B | 2.74% |
Why it matters for small businesses
- Utilities are a fixed bill. When they rise, households have less to spend at local shops and services.
- Businesses pay too. Compare with how much business electricity costs have risen.
- Energy-saving work is in demand. Insulation, HVAC tune-ups and heat pump installs sell where bills are high. Before you start, check business license rules in each state and how to set up an LLC.
Starting a home energy or HVAC business?
Form your LLC with ZenBusiness. For coverage, compare business insurance quotes from Simply Business.
We may earn a commission if you use this link. It doesn’t change what you pay, and it doesn’t affect the data on this page.
How we counted
- Source: U.S. Commerce Department, Bureau of Economic Analysis, state personal consumption spending by type of product (released September 30, 2026), category “Household utilities and fuels,” 2019, 2024 and 2025, in current dollars (not adjusted for inflation).
- Per person: total spending divided by the department’s own population estimate for the same state and year.
- Where it’s counted: spending is assigned to the state where the buyer lives, as best the department can estimate.
- Change compares total spending in 2025 with 2024. Per-person change is a little lower because population grew.
Sources
Cite this data
Reporters and bloggers may use these numbers and charts. Please credit StartBusinessByState and link to this page.
Source: StartBusinessByState, “Household Utility Spending Rose 8.4% in 2025, to $1,512 a Person,” https://startbusinessbystate.com/household-utilities-spending/ (updated October 15, 2026).
FAQ
How much do Americans spend on utilities?
$1,512 per person in 2025 on home electricity, gas, other fuels, water, sewer and trash, according to the U.S. Commerce Department.
Which state spends the most on utilities?
Massachusetts ($1,812 per person), followed by Vermont ($1,790) and Pennsylvania ($1,772).
Which state spends the least on utilities?
Utah ($1,225), then Idaho ($1,291) and Nebraska ($1,338).
Is utilities spending rising?
The U.S. total changed +8.4% from 2024 to 2025 before inflation. It grew fastest in Maine (+15.3%).
Where is this data from?
The U.S. Commerce Department publishes household spending for each state and type of product every fall.
Last updated October 15, 2026 by StartBusinessByState.