Updated October 14, 2026. Data: U.S. Census Bureau, American Community Survey, 2024 (latest available; 2025 results are due later this fall), with 2019 for comparison.
About 13.3 million U.S. workers, 9.3% of those who commute, spent an hour or more getting to work each way in 2024. That’s almost 1 in 10. About 4.3 million of them traveled 90 minutes or more. Long commutes were most common in New York (17.2%), New Jersey (15.2%) and Maryland (14.5%) and least common in Nebraska (4.0%), Kansas (4.0%) and North Dakota (4.3%).
The share fell from 2019 to 2024. The states at the top all sit around the New York City and Washington, DC, metro areas, where many workers cross state lines or ride trains and buses into the city.
Share of commuters traveling an hour or more
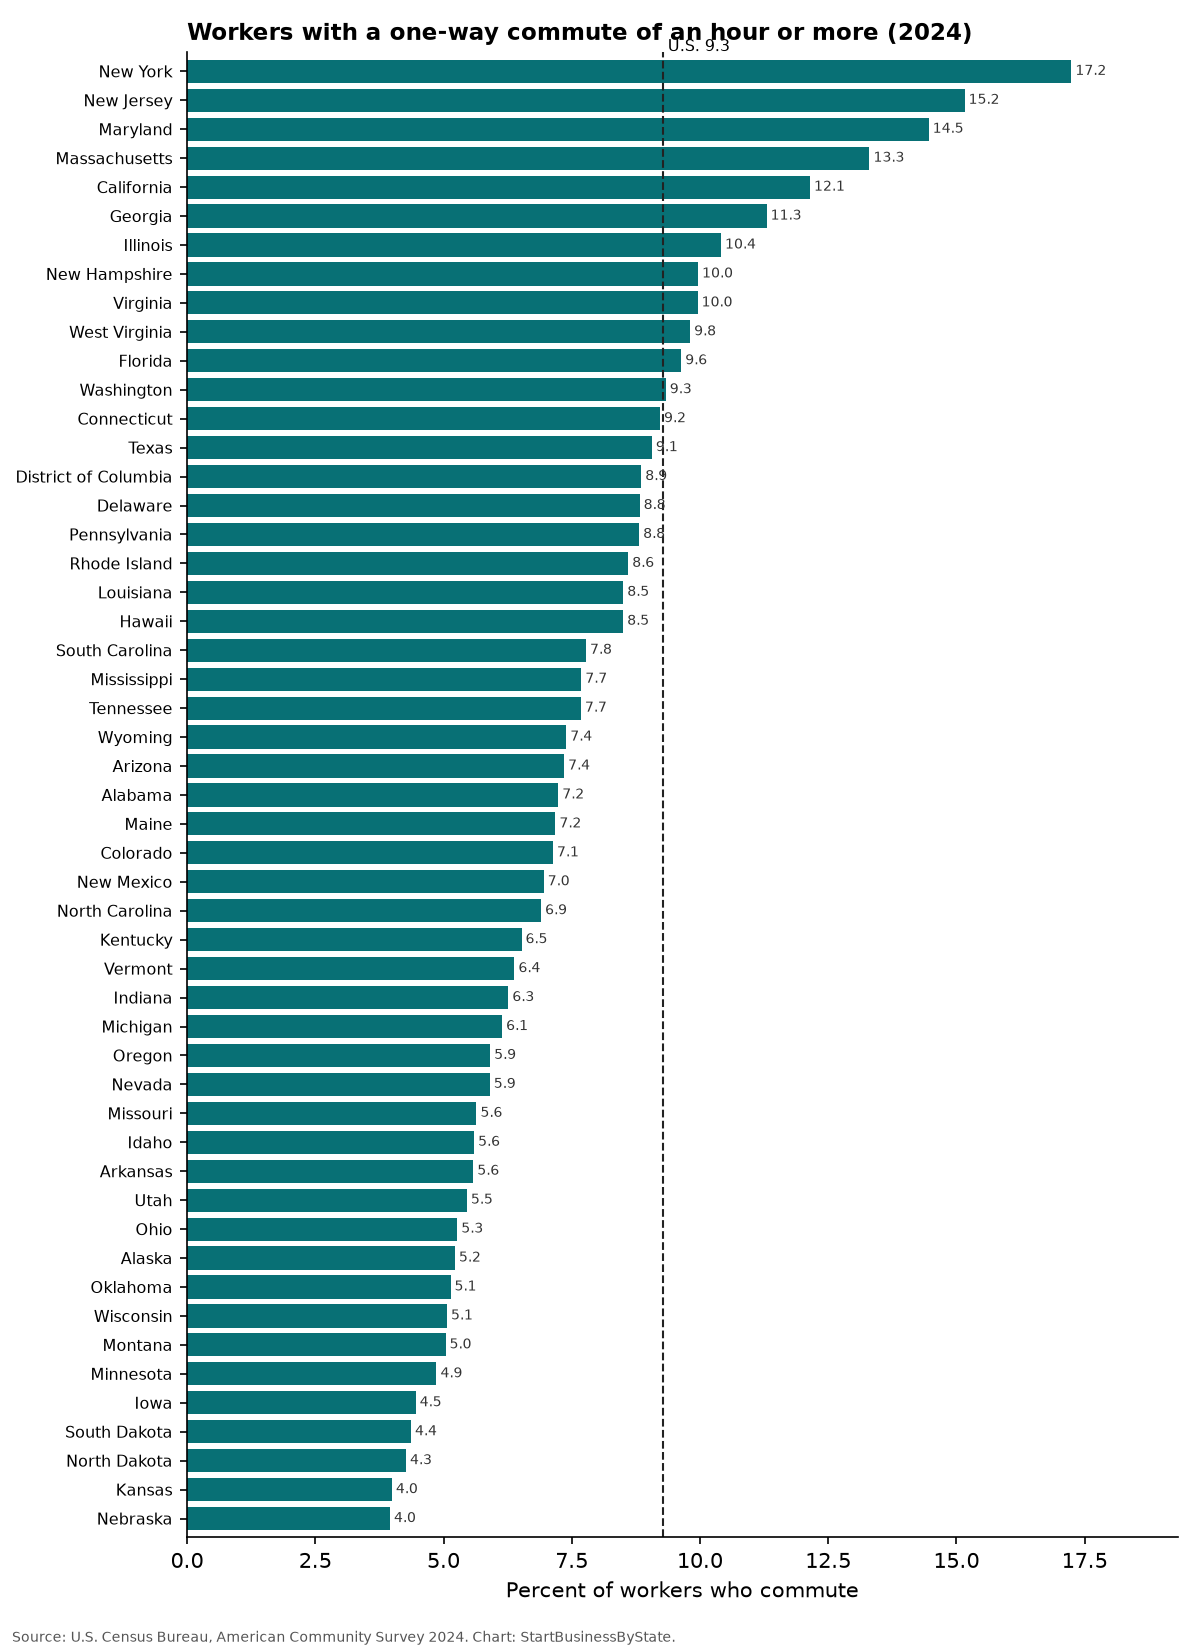
Every state: hour-plus commutes
Click a column to sort. Percentages are of workers who don’t work from home.
| State | Share 60+ minutes, 2024 | Workers 60+ minutes | Share 90+ minutes | Share 60+ minutes, 2019 | Change (points) |
|---|---|---|---|---|---|
| U.S. | 9.3% | 13,294,179 | 3.0% | 9.8% | -0.6 |
| Alabama | 7.2% | 154,149 | 2.3% | 7.1% | +0.2 |
| Alaska | 5.2% | 17,311 | 2.3% | 5.1% | +0.1 |
| Arizona | 7.4% | 219,774 | 2.2% | 8.1% | -0.7 |
| Arkansas | 5.6% | 70,741 | 1.8% | 5.2% | +0.4 |
| California | 12.1% | 1,969,982 | 4.1% | 13.6% | -1.5 |
| Colorado | 7.1% | 181,039 | 2.2% | 7.7% | -0.6 |
| Connecticut | 9.2% | 149,731 | 3.8% | 9.6% | -0.4 |
| Delaware | 8.8% | 38,458 | 2.7% | 9.2% | -0.4 |
| District of Columbia | 8.9% | 26,512 | 3.0% | 9.6% | -0.8 |
| Florida | 9.6% | 902,315 | 2.9% | 9.2% | +0.4 |
| Georgia | 11.3% | 519,551 | 3.3% | 11.4% | -0.1 |
| Hawaii | 8.5% | 55,523 | 2.3% | 10.3% | -1.8 |
| Idaho | 5.6% | 46,508 | 2.1% | 4.8% | +0.8 |
| Illinois | 10.4% | 568,043 | 2.7% | 11.9% | -1.5 |
| Indiana | 6.3% | 189,916 | 2.1% | 6.2% | +0.0 |
| Iowa | 4.5% | 66,274 | 1.9% | 3.8% | +0.6 |
| Kansas | 4.0% | 53,555 | 1.5% | 3.6% | +0.4 |
| Kentucky | 6.5% | 122,684 | 2.6% | 6.6% | -0.1 |
| Louisiana | 8.5% | 159,883 | 3.0% | 8.7% | -0.2 |
| Maine | 7.2% | 43,044 | 2.6% | 6.8% | +0.4 |
| Maryland | 14.5% | 393,767 | 4.1% | 16.6% | -2.1 |
| Massachusetts | 13.3% | 425,163 | 3.7% | 14.2% | -0.9 |
| Michigan | 6.1% | 261,732 | 1.9% | 6.8% | -0.7 |
| Minnesota | 4.9% | 124,754 | 1.7% | 6.0% | -1.1 |
| Mississippi | 7.7% | 93,843 | 3.0% | 6.9% | +0.8 |
| Missouri | 5.6% | 152,000 | 2.0% | 5.7% | -0.0 |
| Montana | 5.0% | 25,149 | 2.0% | 5.1% | -0.1 |
| Nebraska | 4.0% | 36,995 | 1.8% | 3.7% | +0.2 |
| Nevada | 5.9% | 82,739 | 2.3% | 6.1% | -0.2 |
| New Hampshire | 10.0% | 63,075 | 3.3% | 10.3% | -0.3 |
| New Jersey | 15.2% | 625,683 | 5.3% | 17.0% | -1.8 |
| New Mexico | 7.0% | 59,526 | 2.8% | 5.9% | +1.1 |
| New York | 17.2% | 1,453,906 | 5.4% | 18.5% | -1.2 |
| North Carolina | 6.9% | 313,890 | 2.2% | 7.1% | -0.2 |
| North Dakota | 4.3% | 16,752 | 1.5% | 4.4% | -0.1 |
| Ohio | 5.3% | 267,548 | 1.8% | 5.7% | -0.4 |
| Oklahoma | 5.1% | 87,762 | 2.1% | 5.2% | -0.0 |
| Oregon | 5.9% | 101,951 | 1.8% | 6.7% | -0.8 |
| Pennsylvania | 8.8% | 485,393 | 2.9% | 9.7% | -0.9 |
| Rhode Island | 8.6% | 43,035 | 3.2% | 6.8% | +1.8 |
| South Carolina | 7.8% | 175,352 | 2.5% | 7.1% | +0.7 |
| South Dakota | 4.4% | 19,106 | 2.3% | 3.3% | +1.1 |
| Tennessee | 7.7% | 233,338 | 2.3% | 7.2% | +0.5 |
| Texas | 9.1% | 1,193,814 | 2.6% | 8.8% | +0.2 |
| Utah | 5.5% | 81,468 | 2.0% | 5.2% | +0.3 |
| Vermont | 6.4% | 18,266 | 2.0% | 6.3% | +0.1 |
| Virginia | 10.0% | 372,433 | 3.1% | 10.9% | -0.9 |
| Washington | 9.3% | 306,808 | 3.0% | 10.7% | -1.3 |
| West Virginia | 9.8% | 67,925 | 3.4% | 9.9% | -0.1 |
| Wisconsin | 5.1% | 136,329 | 1.9% | 5.1% | -0.0 |
| Wyoming | 7.4% | 19,684 | 3.1% | 6.5% | +0.9 |
Why it matters for small businesses
- Hiring. Workers facing long drives may take a lower-paying job closer to home. See work from home rates in each state.
- Housing costs push commutes longer. Compare with rent vs. own costs and 2027 fair market rents.
- Time-saving services like house cleaning, meal prep, dog walking and child care sell well to people who lose two hours a day to commuting.
Starting a service business?
Form your LLC with ZenBusiness. For coverage, compare business insurance quotes from Simply Business.
We may earn a commission if you use this link. It doesn’t change what you pay, and it doesn’t affect the data on this page.
How we counted
- Source: U.S. Census Bureau, American Community Survey 1-year estimates, table B08303 (travel time to work), 2024 and 2019. “An hour or more” adds the 60–89 minute and 90+ minute groups.
- Who’s counted: workers 16 and older who didn’t work from home, based on their usual trip to work in the week before the survey.
- Survey figures have margins of error, especially in smaller states.
Sources
Cite this data
Reporters and bloggers may use these numbers and charts. Please credit StartBusinessByState and link to this page.
Source: StartBusinessByState, “Almost 1 in 10 Workers Commute an Hour or More Each Way,” https://startbusinessbystate.com/long-commutes/ (updated October 14, 2026).
FAQ
How many Americans commute an hour or more?
About 13,294,179 workers, 9.3% of commuters, traveled an hour or more each way in 2024, according to the U.S. Census Bureau.
Which state has the longest commutes?
New York, where 17.2% of commuters travel an hour or more, followed by New Jersey (15.2%) and Maryland (14.5%).
Which state has the fewest long commutes?
Nebraska (4.0%), then Kansas (4.0%) and North Dakota (4.3%).
Are long commutes becoming less common?
Yes. The share fell from 9.8% in 2019 to 9.3% in 2024.
Where is this data from?
The U.S. Census Bureau’s yearly American Community Survey.
Last updated October 14, 2026 by StartBusinessByState.