Updated October 12, 2026. Data: U.S. Census Bureau, American Community Survey, 2024 one-year estimates (the latest year available; the 2025 release has been delayed).
13.3% of U.S. workers, about 22.0 million people, usually worked from home in 2024. That’s more than double the 2019 share (about 5.7%). District of Columbia had the highest share (22.9%), followed by Colorado (19.9%) and Oregon (17.1%). Mississippi had the lowest (6.2%). A home-based business can still form an LLC; compare LLC cost by state to see the yearly fees.
Work-from-home share by state
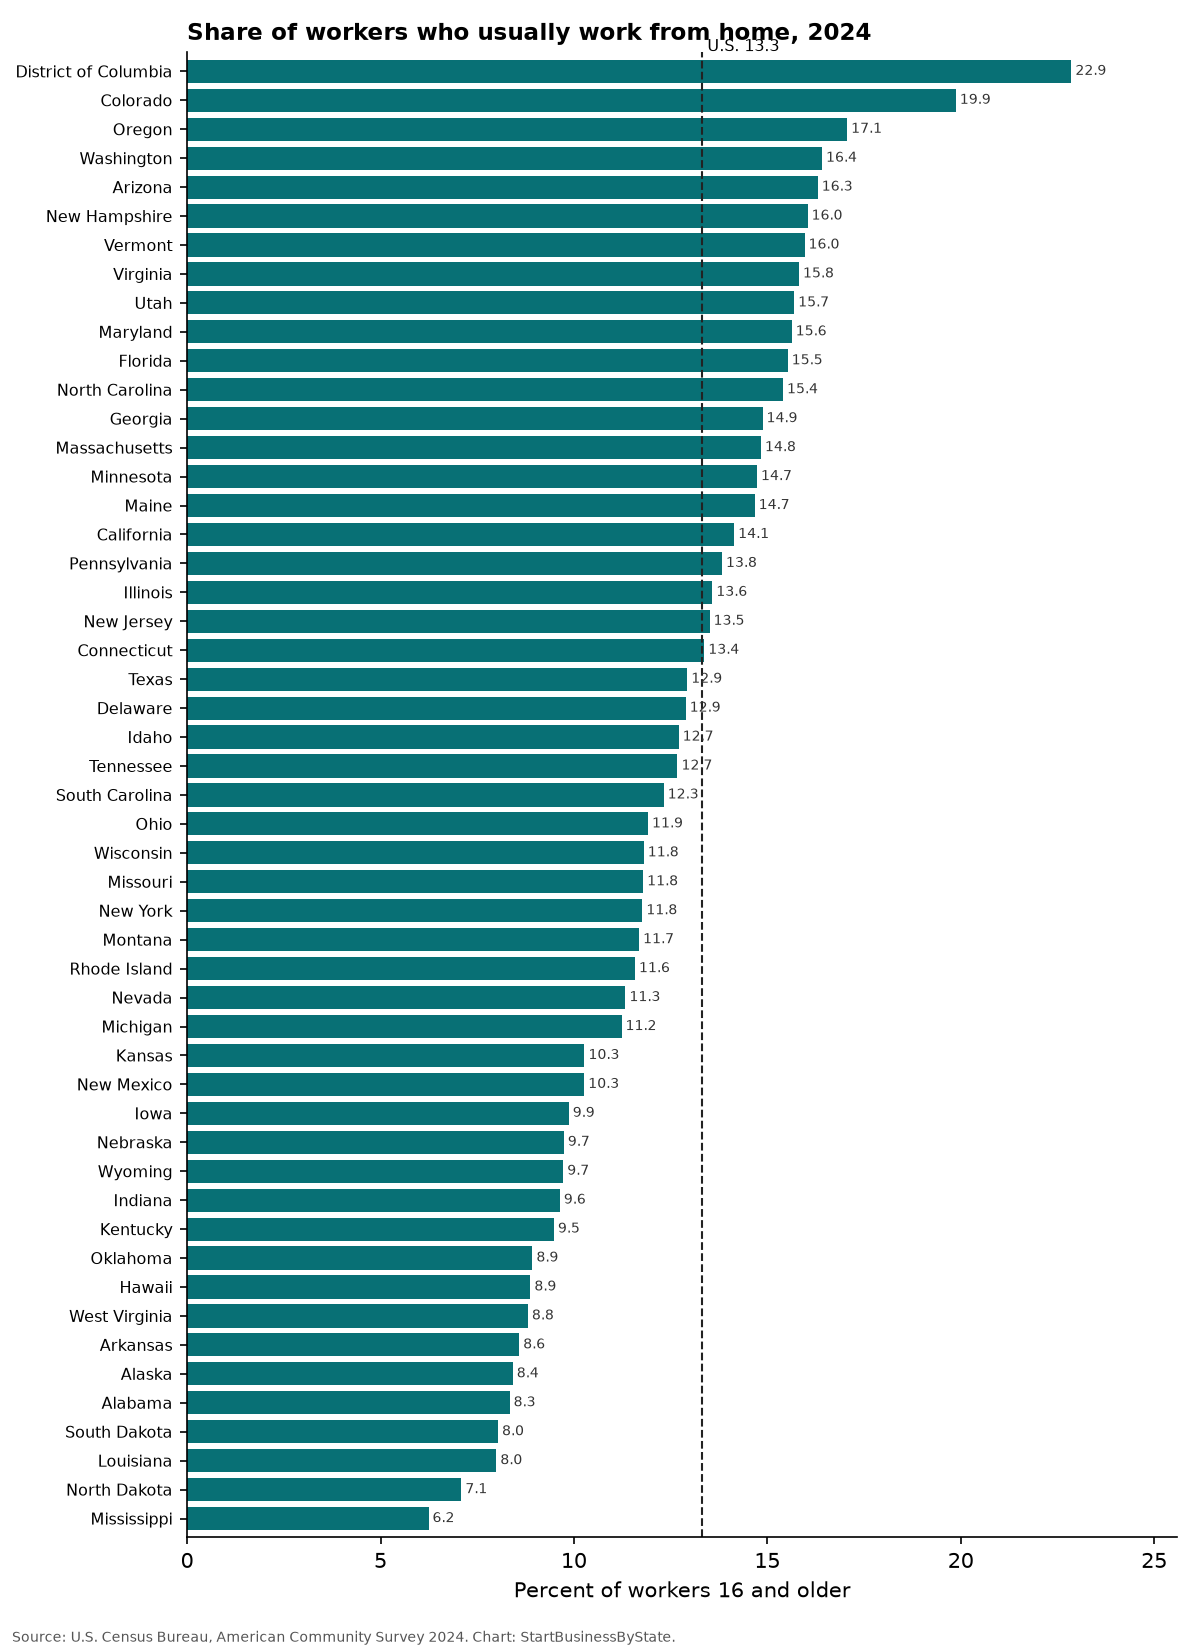
States with lots of office and tech jobs (and big metro areas) have the highest shares. States where more people work in farming, factories, energy and health care have lower shares, because those jobs mostly have to be done in person.
State-by-state table
Click a column to sort. The ± figure is the margin of error at the 90% level.
| State | Worked from home, 2024 | People working from home | All workers | Worked from home, 2019 | Change (points) |
|---|---|---|---|---|---|
| U.S. | 13.3% | 22,026,371 | 165,360,450 | 5.7% | +7.6 |
| Alabama | 8.3% ±0.4 | 193,754 | 2,323,881 | 3.4% | +4.9 |
| Alaska | 8.4% ±0.8 | 30,477 | 361,983 | 4.3% | +4.1 |
| Arizona | 16.3% ±0.4 | 582,289 | 3,571,875 | 7.6% | +8.7 |
| Arkansas | 8.6% ±0.5 | 119,058 | 1,386,650 | 3.5% | +5.1 |
| California | 14.1% ±0.2 | 2,672,106 | 18,893,770 | 6.3% | +7.8 |
| Colorado | 19.9% ±0.5 | 629,420 | 3,167,362 | 9.1% | +10.7 |
| Connecticut | 13.4% ±0.5 | 250,606 | 1,874,388 | 5.6% | +7.8 |
| Delaware | 12.9% ±0.9 | 64,492 | 500,340 | 5.2% | +7.7 |
| District of Columbia | 22.9% ±1.2 | 88,726 | 388,136 | 7.4% | +15.5 |
| Florida | 15.5% ±0.3 | 1,721,372 | 11,086,922 | 7.0% | +8.5 |
| Georgia | 14.9% ±0.3 | 803,593 | 5,402,123 | 6.9% | +7.9 |
| Hawaii | 8.9% ±0.7 | 63,594 | 716,578 | 4.8% | +4.1 |
| Idaho | 12.7% ±0.6 | 120,976 | 952,044 | 7.4% | +5.3 |
| Illinois | 13.6% ±0.3 | 857,301 | 6,314,165 | 5.4% | +8.2 |
| Indiana | 9.6% ±0.4 | 323,341 | 3,355,446 | 4.3% | +5.3 |
| Iowa | 9.9% ±0.4 | 162,777 | 1,649,748 | 5.8% | +4.1 |
| Kansas | 10.3% ±0.5 | 153,539 | 1,494,667 | 5.1% | +5.2 |
| Kentucky | 9.5% ±0.4 | 197,124 | 2,078,668 | 4.3% | +5.2 |
| Louisiana | 8.0% ±0.3 | 163,353 | 2,043,342 | 3.9% | +4.1 |
| Maine | 14.7% ±0.7 | 103,070 | 702,479 | 6.3% | +8.4 |
| Maryland | 15.6% ±0.4 | 504,513 | 3,227,926 | 5.5% | +10.1 |
| Massachusetts | 14.8% ±0.3 | 556,682 | 3,752,433 | 5.4% | +9.4 |
| Michigan | 11.2% ±0.2 | 539,125 | 4,800,270 | 4.5% | +6.7 |
| Minnesota | 14.7% ±0.4 | 443,318 | 3,009,002 | 6.4% | +8.3 |
| Mississippi | 6.2% ±0.4 | 81,270 | 1,302,251 | 3.1% | +3.1 |
| Missouri | 11.8% ±0.4 | 360,070 | 3,054,047 | 5.1% | +6.7 |
| Montana | 11.7% ±0.7 | 66,029 | 565,069 | 6.5% | +5.2 |
| Nebraska | 9.7% ±0.5 | 100,914 | 1,036,126 | 4.6% | +5.1 |
| Nevada | 11.3% ±0.6 | 179,164 | 1,581,033 | 4.9% | +6.5 |
| New Hampshire | 16.0% ±0.8 | 120,950 | 754,095 | 7.3% | +8.7 |
| New Jersey | 13.5% ±0.3 | 644,549 | 4,772,330 | 4.9% | +8.6 |
| New Mexico | 10.3% ±0.7 | 97,946 | 954,026 | 5.1% | +5.2 |
| New York | 11.8% ±0.2 | 1,124,869 | 9,557,920 | 4.8% | +7.0 |
| North Carolina | 15.4% ±0.3 | 828,181 | 5,375,927 | 6.7% | +8.7 |
| North Dakota | 7.1% ±0.7 | 29,953 | 422,457 | 3.6% | +3.5 |
| Ohio | 11.9% ±0.3 | 687,025 | 5,765,669 | 4.6% | +7.3 |
| Oklahoma | 8.9% ±0.3 | 167,486 | 1,876,156 | 4.4% | +4.5 |
| Oregon | 17.1% ±0.4 | 354,930 | 2,080,165 | 7.3% | +9.8 |
| Pennsylvania | 13.8% ±0.3 | 883,654 | 6,390,587 | 5.4% | +8.4 |
| Rhode Island | 11.6% ±0.9 | 65,520 | 565,855 | 4.5% | +7.1 |
| South Carolina | 12.3% ±0.4 | 316,801 | 2,571,377 | 5.1% | +7.2 |
| South Dakota | 8.0% ±0.7 | 38,257 | 475,913 | 6.1% | +1.9 |
| Tennessee | 12.7% ±0.4 | 441,140 | 3,479,795 | 5.6% | +7.0 |
| Texas | 12.9% ±0.2 | 1,956,349 | 15,130,603 | 5.7% | +7.2 |
| Utah | 15.7% ±0.5 | 277,963 | 1,771,258 | 7.4% | +8.3 |
| Vermont | 16.0% ±0.9 | 54,357 | 340,565 | 7.0% | +8.9 |
| Virginia | 15.8% ±0.3 | 703,153 | 4,445,265 | 5.8% | +10.1 |
| Washington | 16.4% ±0.4 | 645,514 | 3,932,815 | 6.5% | +9.9 |
| West Virginia | 8.8% ±0.6 | 66,915 | 759,466 | 3.9% | +4.9 |
| Wisconsin | 11.8% ±0.3 | 360,127 | 3,050,562 | 5.1% | +6.7 |
| Wyoming | 9.7% ±1.1 | 28,679 | 294,920 | 5.7% | +4.0 |
What this means for small businesses
- Home-based businesses are mainstream. Millions of people already have a home office setup, which makes starting a side business or freelance practice from home easier. Internet service is one of those costs; see what households spend on internet.
- Neighborhood demand shifts. When people work from home, they spend more near home: lunch spots, coffee shops, dog walkers, house cleaners and handymen in residential areas can benefit.
- Check local rules. Many cities require a home occupation permit, and your homeowners association or lease may limit customer visits or signs.
- Compare housing costs with rent vs. own costs by state, and see how many service businesses are one-person shops.
Starting a business from home?
Forming an LLC can keep business and personal finances separate. Form your LLC with ZenBusiness.
We may earn a commission if you use this link. It doesn’t change what you pay, and it doesn’t affect the data on this page.
About the data
- Source: U.S. Census Bureau, American Community Survey 2024 and 2019 one-year estimates, table “Sex of Workers by Means of Transportation to Work.”
- Who counts: workers 16 and older who said they usually worked from home in the week before the survey. Hybrid workers who commute most days are counted as commuters.
- The U.S. 2019 figure is the sum of the 50 states and DC.
Sources
Cite this data
Reporters and bloggers may use these numbers and charts. Please credit StartBusinessByState and link to this page.
Source: StartBusinessByState, “Work From Home by State: Where Remote Work Is Most Common,” https://startbusinessbystate.com/work-from-home-by-state/ (updated October 12, 2026).
FAQ
What percent of Americans work from home?
13.3% of workers, about 22.0 million people, usually worked from home in 2024, according to the U.S. Census Bureau.
Which state has the most remote workers?
By share, District of Columbia (22.9%), Colorado (19.9%) and Oregon (17.1%). By number of people, California has the most (2,672,106).
Which state has the fewest people working from home?
Mississippi (6.2%), followed by North Dakota (7.1%).
Is working from home declining?
Compared with 2019, it is still much higher (13.3% vs. about 5.7%). It has eased from its 2021 peak as more employers asked people back to the office.
Where is this data from?
The U.S. Census Bureau’s American Community Survey, which asks workers how they usually got to work in the past week.
Last updated October 12, 2026 by StartBusinessByState.