Updated October 14, 2026. Data: U.S. Labor Department, Bureau of Labor Statistics, quarterly count of jobs and wages from employer tax records, first quarter 2026 vs. first quarter 2025. Figures are preliminary. Second-quarter 2026 figures are due in December.
Roofing contractors in Florida employed about 35,021 people in early 2026, down from 43,677 a year earlier, a drop of 19.8%, or about 1 in 5 jobs. Nationally, roofing jobs fell 3.6% to 231,153, even though the number of roofing business locations grew 4.2%. Jobs fell in 25 states. After Florida, the biggest drops were in Delaware (-15.1%), Mississippi (-15.0%) and Colorado (-10.2%). The biggest gains were in North Dakota (+27.5%), Montana (+13.1%) and West Virginia (+10.9%).
Change in jobs in each state
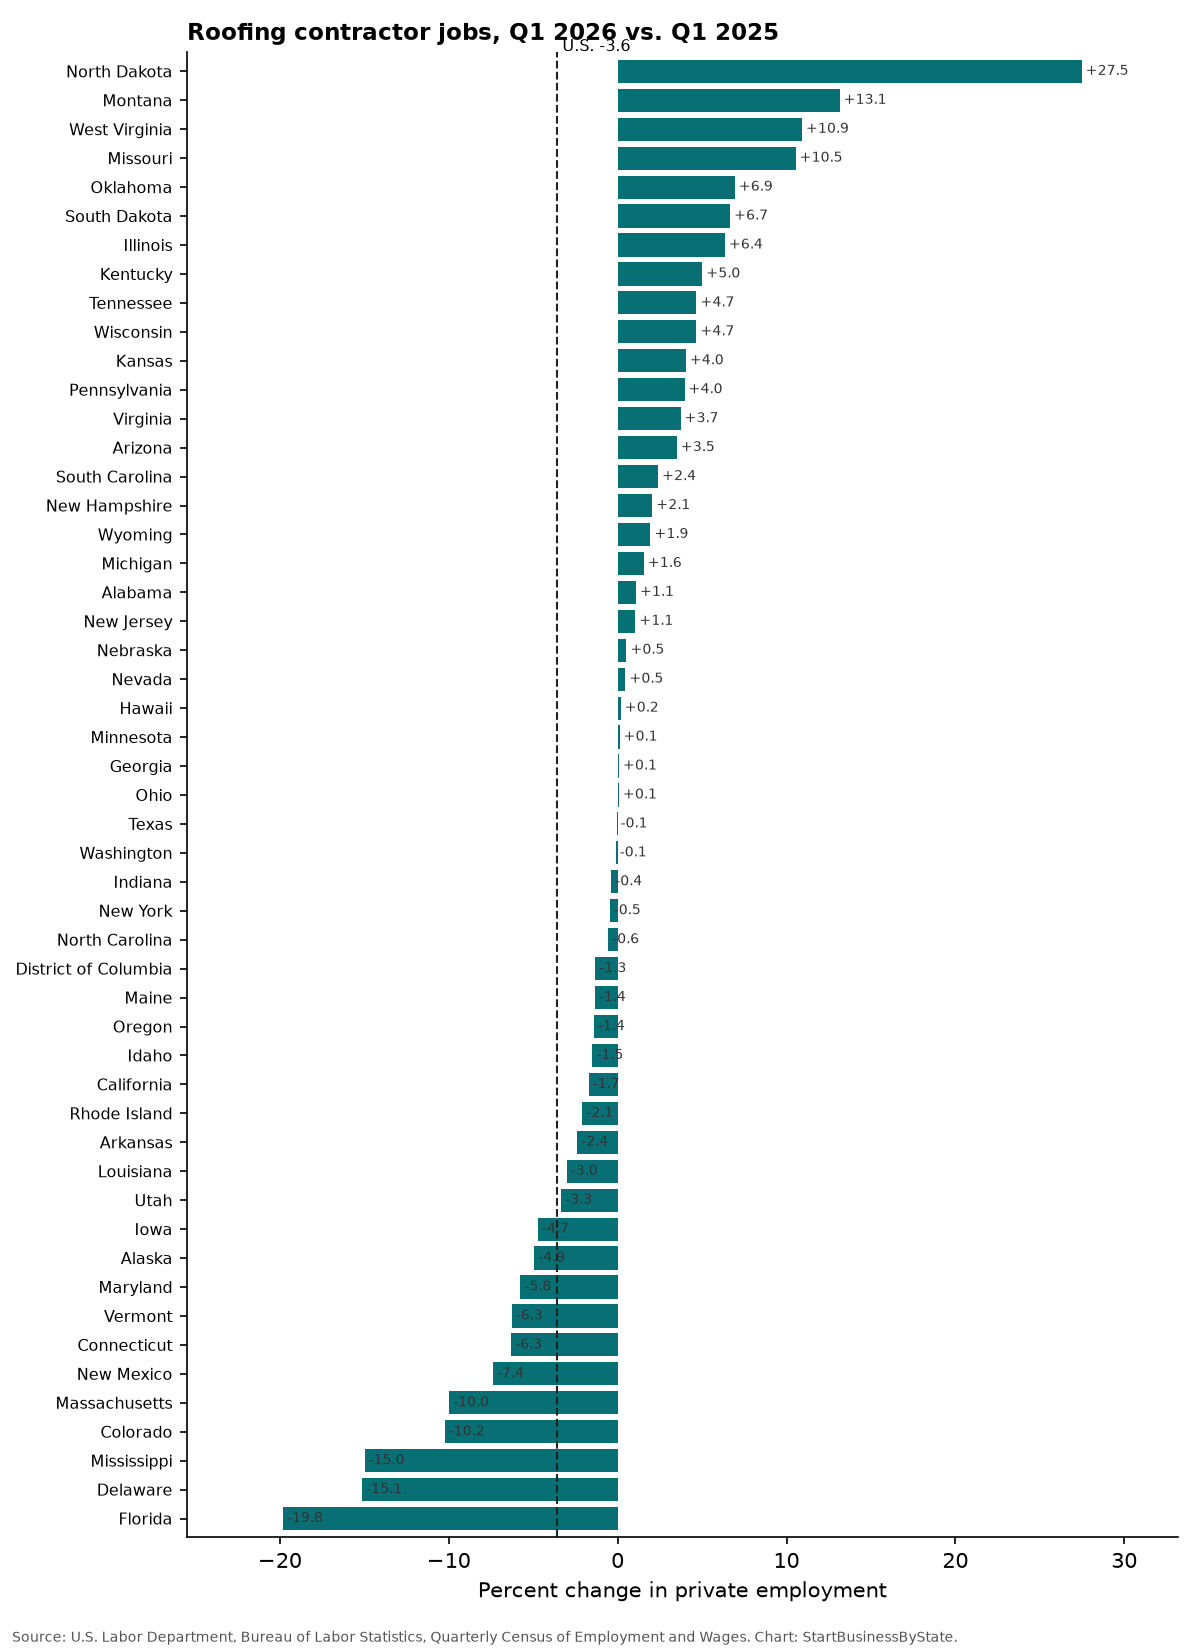
The biggest employers are Florida (35,021 jobs), California (31,294 jobs) and Texas (19,615 jobs).
Every state: jobs, locations and pay
Click a column to sort. Jobs are the average of January, February and March.
| State | Jobs, Q1 2026 | Jobs, Q1 2025 | Change | Locations, Q1 2026 | Locations change | Average weekly pay |
|---|---|---|---|---|---|---|
| U.S. | 231,153 | 239,702 | -3.6% | 33,653 | +4.2% | $1,311 |
| Alabama | 2,293 | 2,268 | +1.1% | 470 | +5.4% | $1,361 |
| Alaska | 296 | 311 | -4.9% | 81 | +17.4% | $1,632 |
| Arizona | 7,393 | 7,143 | +3.5% | 637 | +2.4% | $1,312 |
| Arkansas | 2,113 | 2,165 | -2.4% | 339 | +2.7% | $1,259 |
| California | 31,294 | 31,840 | -1.7% | 3,822 | +8.1% | $1,403 |
| Colorado | 5,920 | 6,595 | -10.2% | 1,006 | +6.9% | $1,419 |
| Connecticut | 1,532 | 1,635 | -6.3% | 249 | +8.7% | $1,449 |
| Delaware | 438 | 516 | -15.1% | 83 | +5.1% | $1,323 |
| District of Columbia | 75 | 76 | -1.3% | 18 | +5.9% | $1,358 |
| Florida | 35,021 | 43,677 | -19.8% | 5,148 | -1.6% | $1,095 |
| Georgia | 5,440 | 5,435 | +0.1% | 1,164 | +5.1% | $1,466 |
| Hawaii | 1,258 | 1,255 | +0.2% | 138 | +3.8% | $1,262 |
| Idaho | 1,608 | 1,632 | -1.5% | 388 | -5.8% | $1,091 |
| Illinois | 7,261 | 6,827 | +6.4% | 1,157 | +7.2% | $1,347 |
| Indiana | 5,030 | 5,049 | -0.4% | 672 | +3.2% | $1,252 |
| Iowa | 1,616 | 1,696 | -4.7% | 292 | -3.0% | $1,269 |
| Kansas | 2,414 | 2,321 | +4.0% | 291 | +5.1% | $1,352 |
| Kentucky | 2,373 | 2,260 | +5.0% | 407 | +7.7% | $1,282 |
| Louisiana | 1,717 | 1,771 | -3.0% | 409 | +1.0% | $1,167 |
| Maine | 828 | 839 | -1.4% | 116 | -2.5% | $1,209 |
| Maryland | 3,236 | 3,434 | -5.8% | 338 | -1.2% | $1,402 |
| Massachusetts | 2,886 | 3,206 | -10.0% | 425 | +2.2% | $1,605 |
| Michigan | 4,430 | 4,362 | +1.6% | 571 | +2.7% | $1,266 |
| Minnesota | 3,168 | 3,164 | +0.1% | 465 | +9.4% | $1,681 |
| Mississippi | 1,084 | 1,275 | -15.0% | 208 | +7.2% | $1,134 |
| Missouri | 4,961 | 4,488 | +10.5% | 724 | +13.3% | $1,415 |
| Montana | 737 | 652 | +13.1% | 177 | +4.7% | $1,350 |
| Nebraska | 2,128 | 2,117 | +0.5% | 364 | +4.0% | $1,383 |
| Nevada | 3,126 | 3,112 | +0.5% | 170 | +4.9% | $1,250 |
| New Hampshire | 530 | 519 | +2.1% | 108 | +8.0% | $1,406 |
| New Jersey | 3,078 | 3,046 | +1.1% | 455 | +6.6% | $1,461 |
| New Mexico | 1,517 | 1,638 | -7.4% | 203 | -1.0% | $1,019 |
| New York | 5,793 | 5,820 | -0.5% | 765 | -4.5% | $1,327 |
| North Carolina | 6,409 | 6,445 | -0.6% | 1,066 | +11.9% | $1,544 |
| North Dakota | 472 | 370 | +27.5% | 107 | +5.9% | $978 |
| Ohio | 7,652 | 7,646 | +0.1% | 1,134 | +2.5% | $1,287 |
| Oklahoma | 2,825 | 2,642 | +6.9% | 597 | +9.7% | $1,165 |
| Oregon | 4,524 | 4,588 | -1.4% | 637 | +3.2% | $1,188 |
| Pennsylvania | 6,389 | 6,146 | +4.0% | 984 | +6.1% | $1,257 |
| Rhode Island | 423 | 432 | -2.1% | 91 | -6.2% | $1,292 |
| South Carolina | 2,620 | 2,559 | +2.4% | 397 | +4.2% | $1,307 |
| South Dakota | 587 | 551 | +6.7% | 125 | +2.5% | $1,271 |
| Tennessee | 4,886 | 4,668 | +4.7% | 641 | +13.9% | $1,436 |
| Texas | 19,615 | 19,628 | -0.1% | 2,975 | +5.7% | $1,418 |
| Utah | 3,739 | 3,868 | -3.3% | 486 | +6.3% | $1,170 |
| Vermont | 374 | 399 | -6.3% | 90 | -10.0% | $1,210 |
| Virginia | 4,733 | 4,563 | +3.7% | 587 | +2.4% | $1,290 |
| Washington | 8,079 | 8,088 | -0.1% | 1,092 | +2.2% | $1,279 |
| West Virginia | 816 | 736 | +10.9% | 120 | +12.1% | $981 |
| Wisconsin | 3,977 | 3,800 | +4.7% | 584 | +7.9% | $1,283 |
| Wyoming | 437 | 429 | +1.9% | 80 | +3.9% | $1,099 |
What the numbers show, and what they don’t
- More companies, fewer workers. The U.S. had 33,653 roofing locations in early 2026, up from 32,299, but fewer people on payroll. That can mean smaller crews, more owner-operators or more work done by subcontractors who aren’t on a roofing company’s payroll.
- Florida’s comparison year was unusual. Hurricanes Helene and Milton hit Florida in the fall of 2024, and the first months of 2025 came right after. Repair work after big storms tends to swell roofing payrolls for a while, so some of the drop may be that work winding down. The data alone can’t show how much.
- Weather and seasons. January through March is the slow season for roofing in cold states, so first-quarter counts there are small and can swing a lot.
- Small states swing more. In North Dakota or Montana, one company opening or closing can move the percentage a lot.
For owners and would-be owners
- Roofing is risky work. See fatal injury rates by trade.
- Hiring and heat rules vary from place to place. See heat protection laws for outdoor workers.
- Construction overall: compare with the change in construction jobs in each state.
Starting or growing a roofing company?
Compare contractor insurance quotes from Simply Business. Need to form your company first? Form your LLC with ZenBusiness.
We may earn a commission if you use this link. It doesn’t change what you pay, and it doesn’t affect the data on this page.
How we counted
- Source: U.S. Labor Department, Bureau of Labor Statistics, Quarterly Census of Employment and Wages, industry 23816 (roofing contractors), privately owned businesses, first quarter of 2026 and 2025.
- Jobs are the average of the three monthly counts and include full- and part-time workers on payroll. Owners with no payroll and self-employed people aren’t counted.
- Locations are individual work sites (establishments), not companies. One company with ten offices counts ten times.
- State is where the job is located as reported by the employer.
- Preliminary: first-quarter 2026 figures can be revised.
Sources
Cite this data
Reporters and bloggers may use these numbers and charts. Please credit StartBusinessByState and link to this page.
Source: StartBusinessByState, “Florida Lost About 1 in 5 Roofing Jobs in a Year, Even as Roofing Companies Grew,” https://startbusinessbystate.com/roofing-jobs/ (updated October 14, 2026).
FAQ
Are roofing jobs declining?
Nationally, yes, slightly. Private roofing contractor jobs were 3.6% lower in the first quarter of 2026 than a year earlier, while the number of roofing locations rose 4.2%.
Which state lost the most roofing jobs?
Florida, down 19.8% (43,677 to 35,021). Next were Delaware (-15.1%) and Mississippi (-15.0%).
Where are roofing jobs growing?
North Dakota (+27.5%), Montana (+13.1%) and West Virginia (+10.9%).
Why did Florida roofing jobs drop?
The data doesn’t give reasons. Early 2025 came right after Hurricanes Helene and Milton, when storm repair work was heavy, so part of the drop may be that work winding down.
Where is this data from?
The U.S. Labor Department’s quarterly count of jobs from employer unemployment-insurance tax records, which covers nearly all payroll jobs.
Last updated October 14, 2026 by StartBusinessByState.